- Results & Reports
 Test Plan Run Results
- Filters on Run Results
- Custom PDF Report Generation
- Custom Allure Reports Generation
- Custom JUnit Report Generation
- Dashboard
Testsigma Dashboard - Overview
Testsigma Dashboard is the control panel which gives us an overview of the currently selected Project and its components.
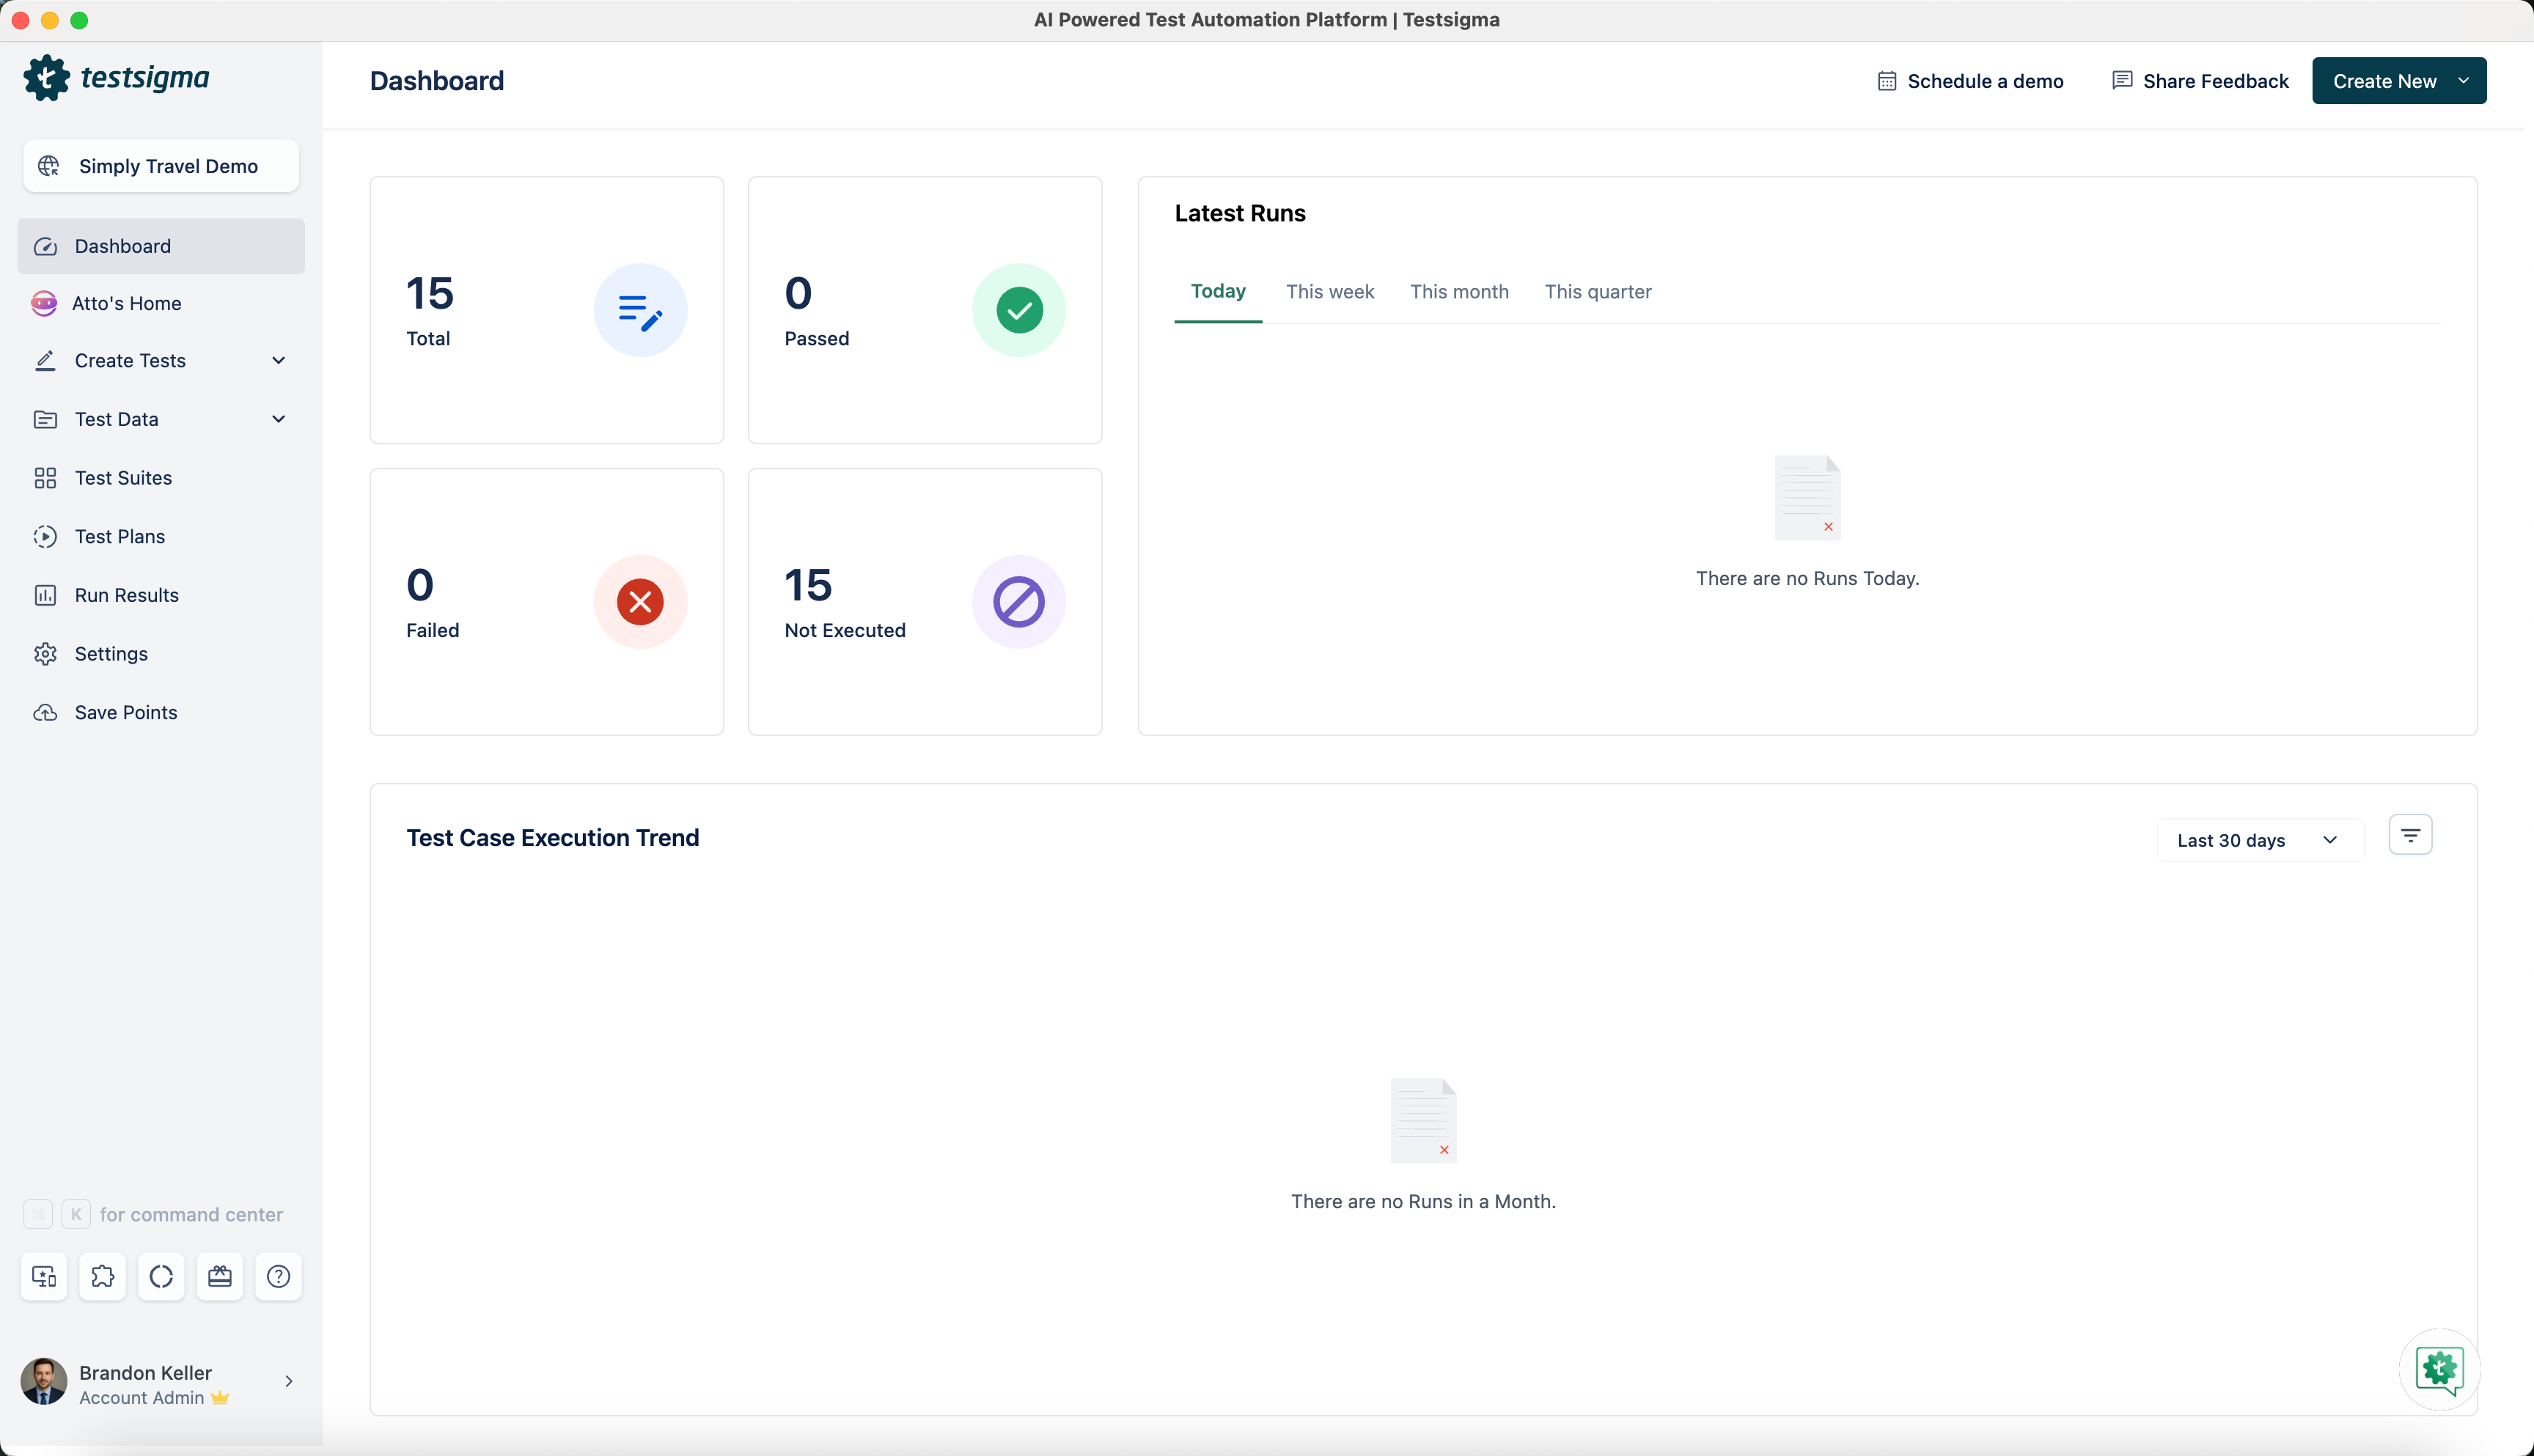
On the left, you can find the Navigation bar spanning across the height of the page. The Navigation bar is persistent for all the pages. It helps you to navigate across different pages easily.
The bottom left of the navigation bar gives access to the Usage Details, Help section, What’s New section, and My Profile section.
The Navigation bar includes the following items: Dashboard, Atto's Home, Create Tests, Test Data, Test Suites, Test Plans, Run Results, Settings, and Save Points.
The bottom left of the navigation bar gives access to the Add Widget, Atto's Home shortcut, Command Center, and other utility options such as Help.
The logged-in user's name and role are also displayed at the bottom left.
On the top left corner, you can find the Project Switcher (e.g., Simply Travel Demo) that helps you to switch across different Projects, Applications, and Versions.
On the right corner, you see a link to the Schedule a demo page, Share Feedback page, and a Create New button that helps you to create any entity quickly.
There are a number of sections within the Dashboard page that give detailed information regarding various components such as:
- Test Case Overview: Displays the total number of test cases along with counts for Passed, Failed, and Not Executed statuses at a glance.
- Latest Runs: Details of the latest executions for the current project, filterable by Today, This week, This month, and This quarter.
- Test Case Execution Trend: A chart showing the execution trend over the last 30 days, with filter options.
- Review Management: View Test Cases and Elements submitted for review (with Reviewer name and Submitted On date) and those assigned to you for review, under Submitted for review and Assigned for your review sections respectively.
- Test Case Status: A donut chart breaking down test cases by status, including Draft, Inreview, Ready, Obsolete, and Rework.
- Test Case Type: A donut chart categorizing test cases by type, including Unit Test, Integration, Functional, Non Functional, and User Experience.
- Test Case Priority: A donut chart showing test case distribution by priority, including Critical, Major, Medium, and Minor.
Want to contribute or report missing content?