- runs
 Ad-hoc Run
- Test Plan Executions
- Dry Runs on Local Devices
- Run Tests on Private Grid
- Run Tests on Vendor Platforms
- Run Test Plans on Local Devices
- Test Locally Hosted Applications
- Flutter Integration Driver Testing on Testsigma
- Debug Test Case Failures
- Parallel and Allowed queues
Debug Test Case Failures
Investigate a failed test case from the Run Results page. Open the failing step, read the error and the analyzer verdict, check its logs, and compare it against an earlier run. Testsigma captures a screenshot, the element details, and the logs for the step.
Prerequisites
Before you begin, ensure that:
- A test plan run or dry run has completed.
- The run contains at least one failed step.
Open the Failing Step
- From the left navigation bar, go to Run Results and click the test plan for which you want to check the results.
- Click the test case you want to investigate.
-
Select the failed step from the step list on the left.
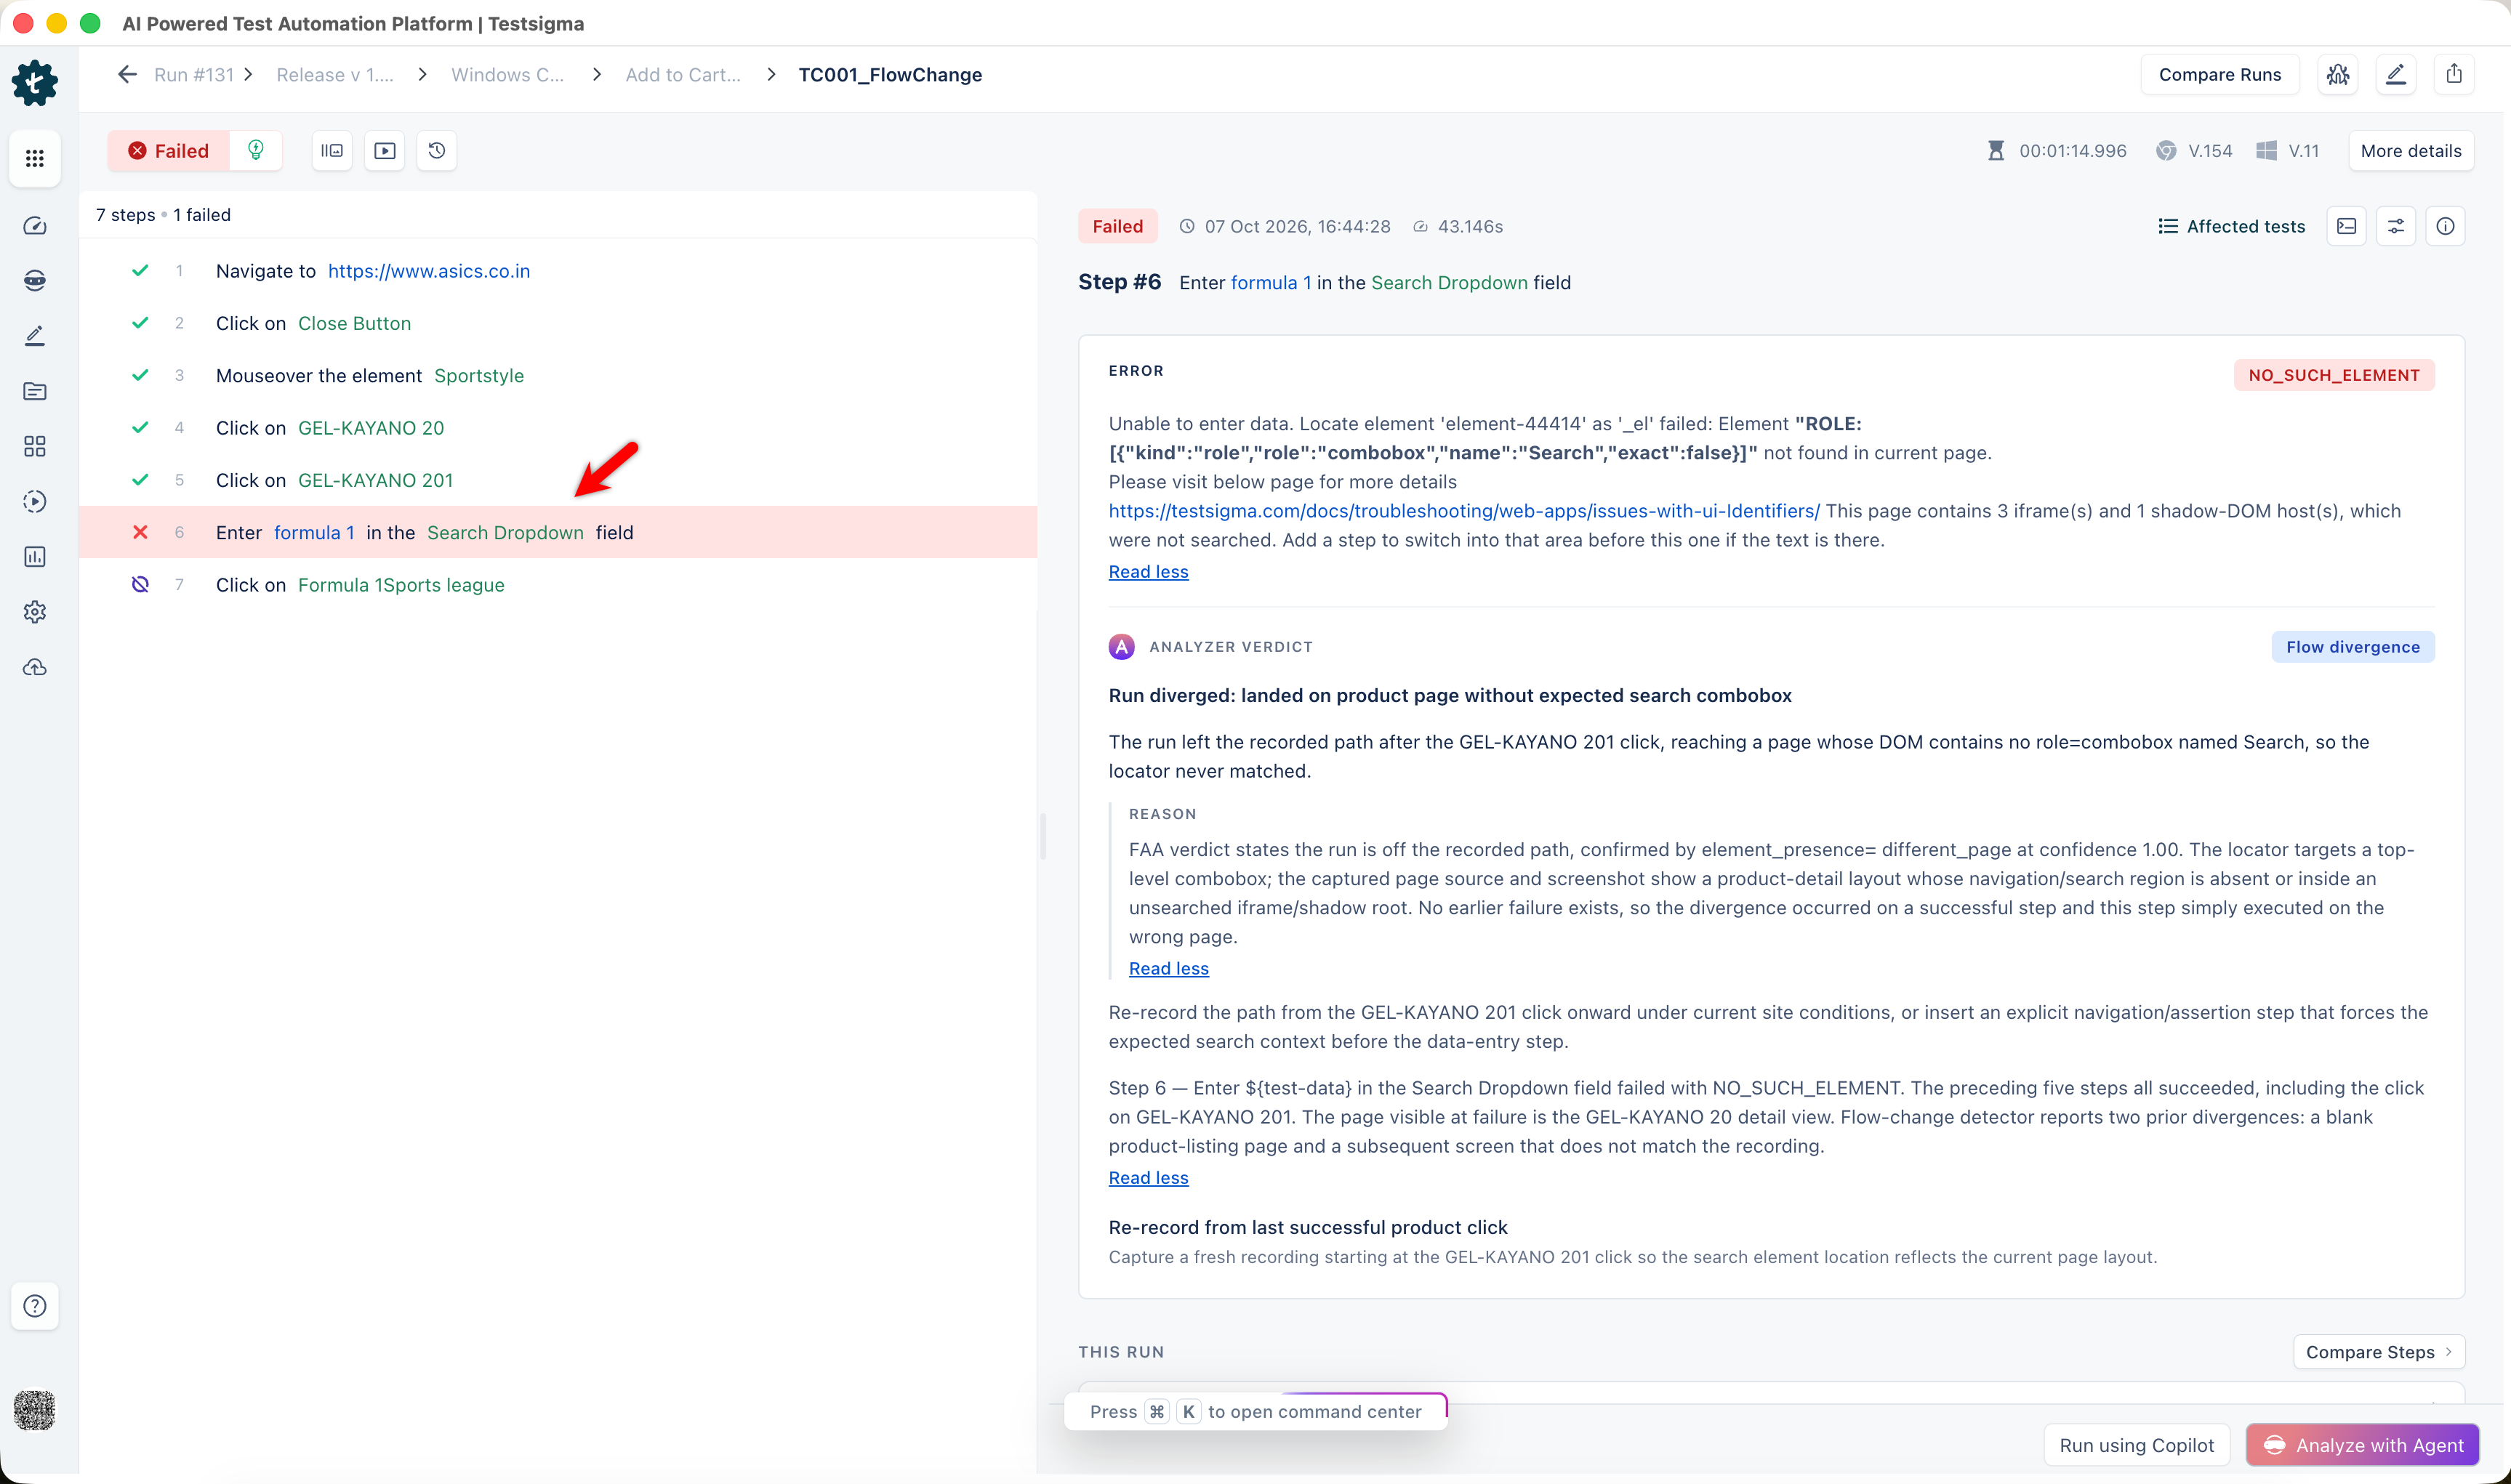
The list is headed by the step count and the number of failed steps. Each step carries an icon showing whether it passed, failed, or was not executed. Drag the divider between the step list and the details pane to resize either side.
The step header shows the step status, start time, duration, step number, and step action.
The step that reports a failure is not always the step that caused it. For details, refer to When the Failure Started at an Earlier Step.
Read the Error and the Analyzer Verdict
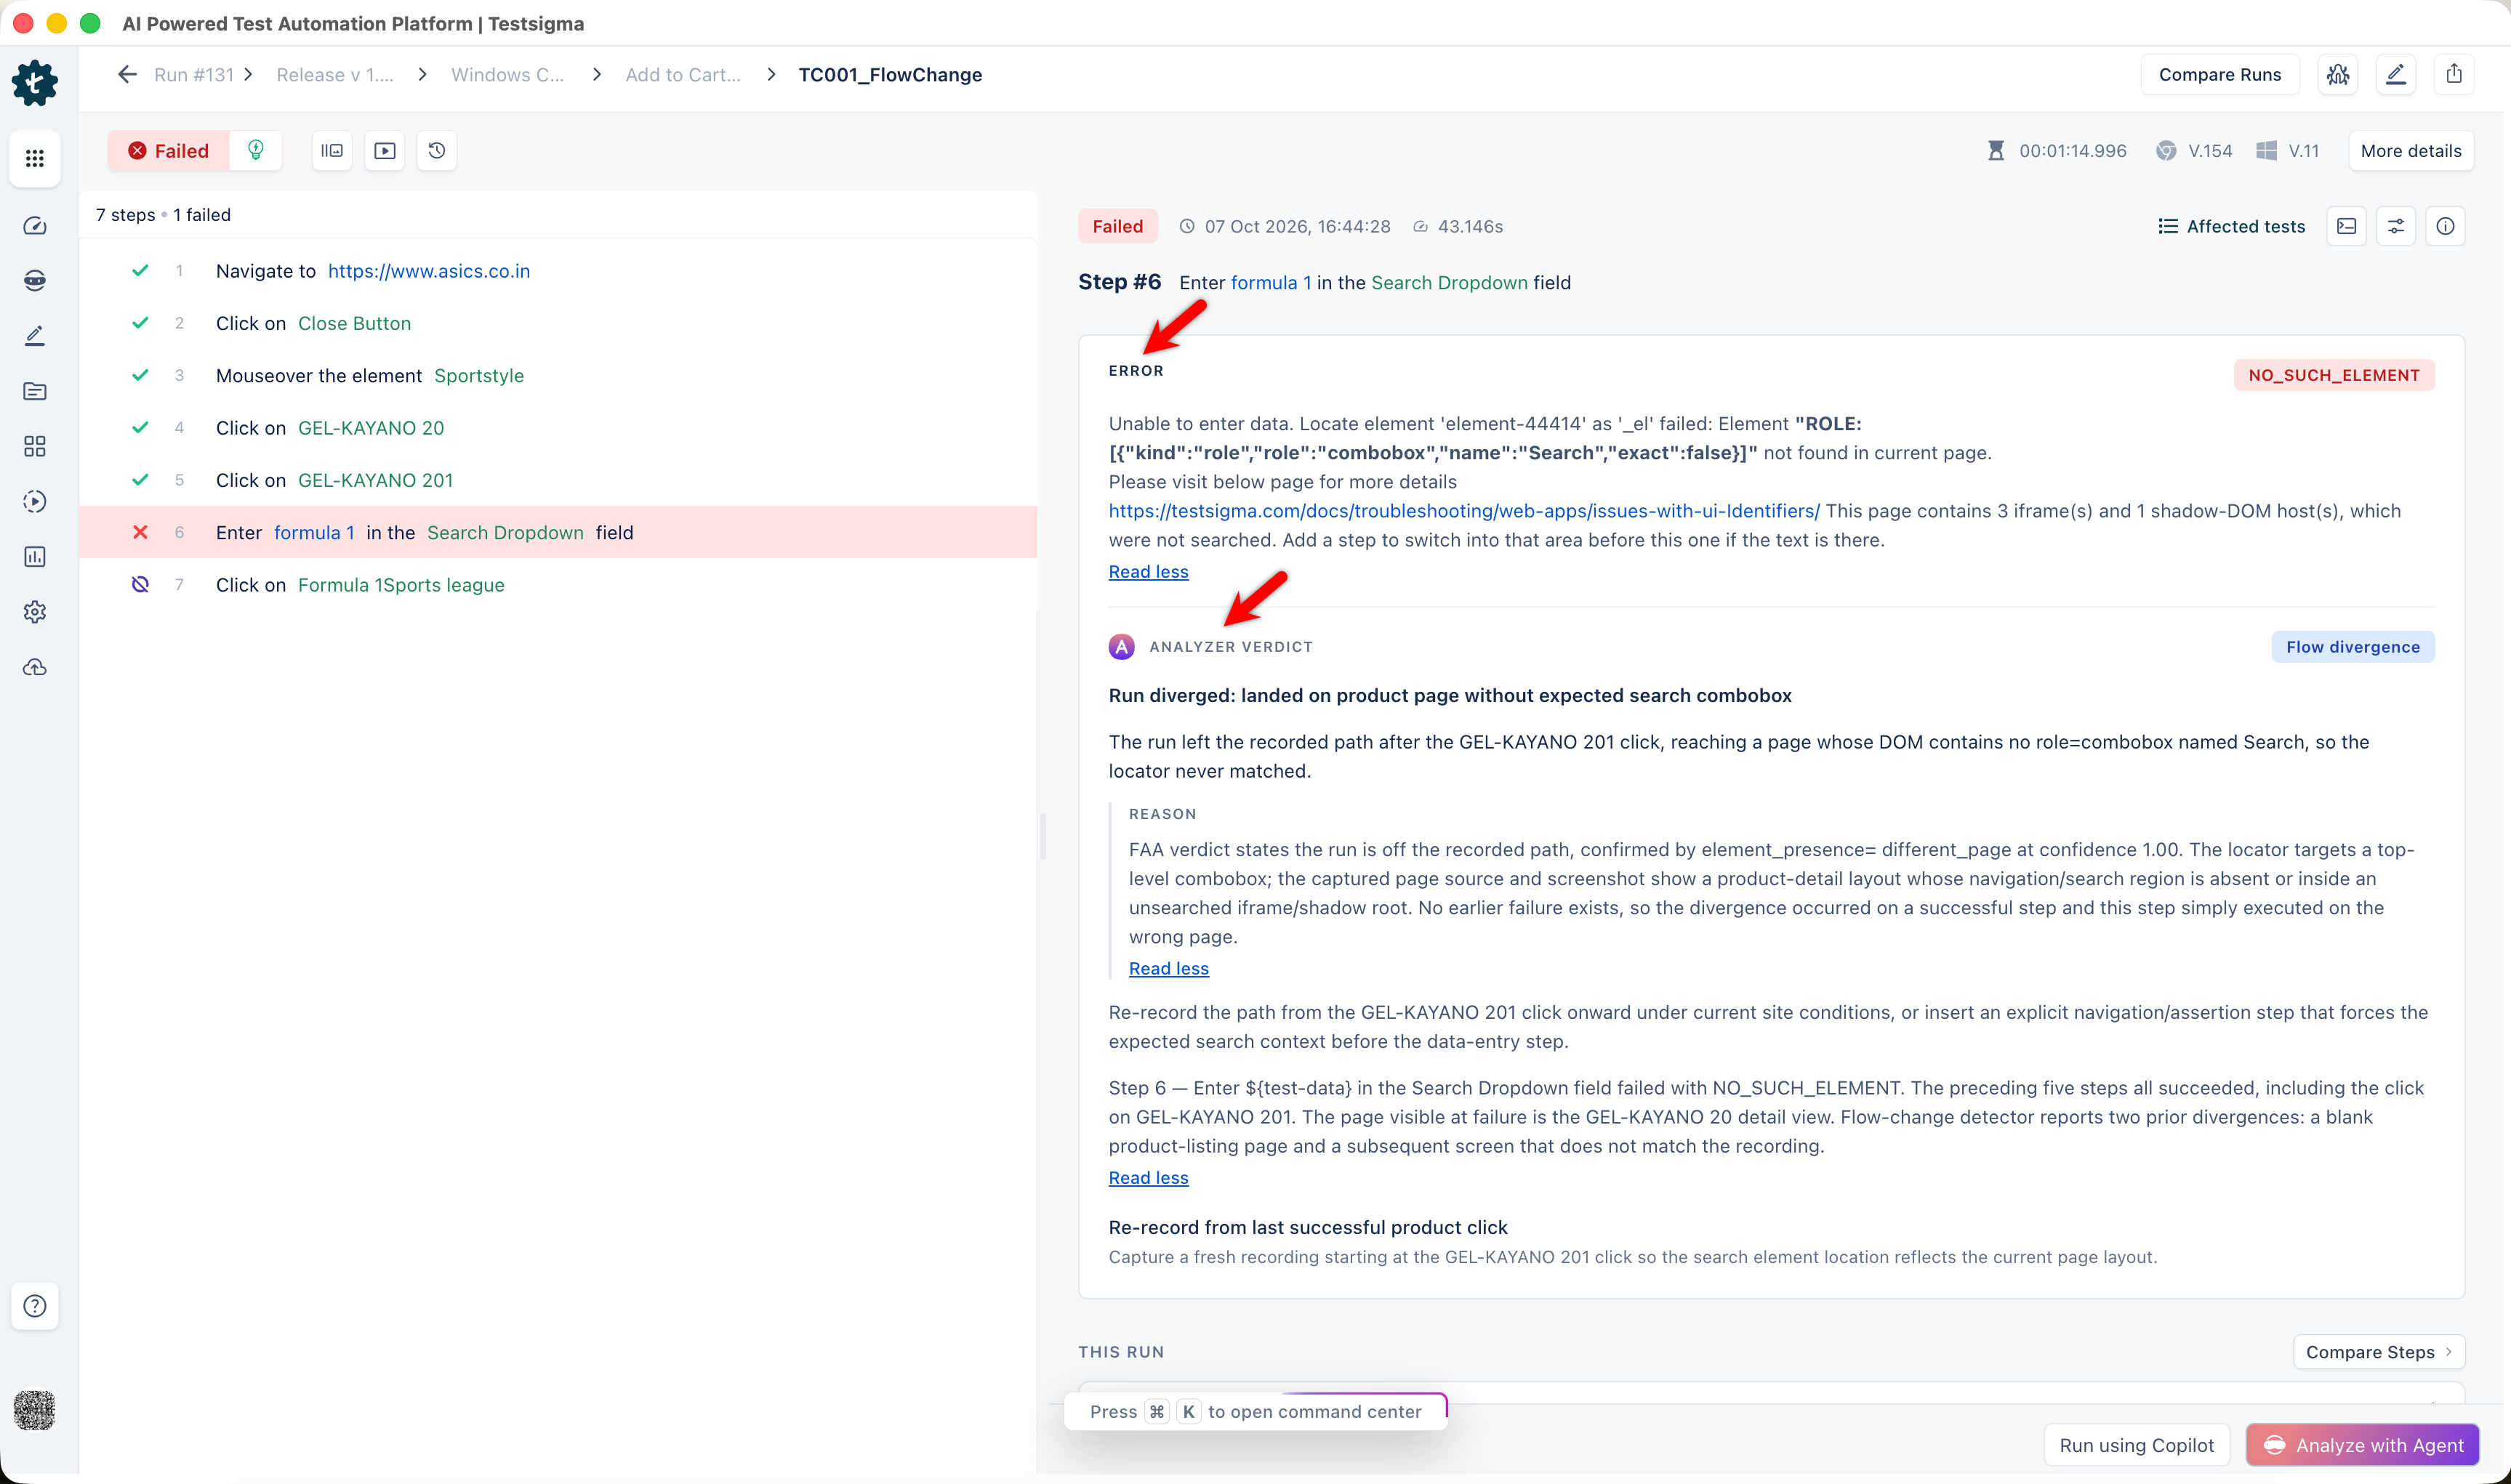
For a failed step, the ERROR and ANALYZER VERDICT sections appear below the step header.
-
Review the ERROR section, which shows the error code and the error message. Click Read more for the full message.
When the page contains iframes or shadow DOM hosts that were not searched, the error message says so. If the element is inside one of them, add a step to switch into it before the failed step.
-
Review the ANALYZER VERDICT section below it. Testsigma analyzes the failure automatically when you open the step.
The verdict contains:
Part What it shows Category The type of failure, shown as a badge, such as Flow divergence Summary One line naming the failed step and the cause, followed by a short explanation REASON Why the step failed, compared against the passing baseline. Click Read more to expand it. Recommendation What to change, and how to confirm the fix Evidence What the screenshots show for this run and the baseline Fix A named fix with a one-line description. When Testsigma can make the change for you, the fix lists options to select and an Apply fix button. - To compare the failed step against the baseline, click Compare Steps in the THIS RUN section.
-
To fix the step, do one of the following:
- If the verdict lists fix options, select one and click Apply fix.
- Click Analyze with Agent at the bottom of the page to open the Analyzer with Atto panel. The panel lists suggestions you can apply, lets you ask Atto follow-up questions, and lets you report the failure as a bug. For details, refer to the documentation on the Analyzer Agent.
Steps after the failed step are not run when the step is set to stop the test case on failure. These steps show the not executed icon.
When the Failure Started at an Earlier Step
A step can fail because the run left the recorded path before it. An earlier step opens a different page from the one recorded, or does not finish loading it, so the element the failed step needs never appears. The failed step reports the error, but the cause lies in the steps before it.
The verdict category shows which of these happened.
| Category | What happened | Fix |
|---|---|---|
| Flow divergence | The run reached a different page from the one recorded, so the element the step targets does not exist on the current page. | Re-record the steps from the point where the run left the recorded path, or add the missing navigation before the failed step. |
| Prerequisite not completed | An earlier step did not finish as recorded, such as a page that had not finished loading, so the next step could not find its element. | Select the fix option in the verdict, such as Add a wait for the page to settle, and click Apply fix. |
- On the Test Case Results page, select the failed step.
-
Review the ANALYZER VERDICT section.
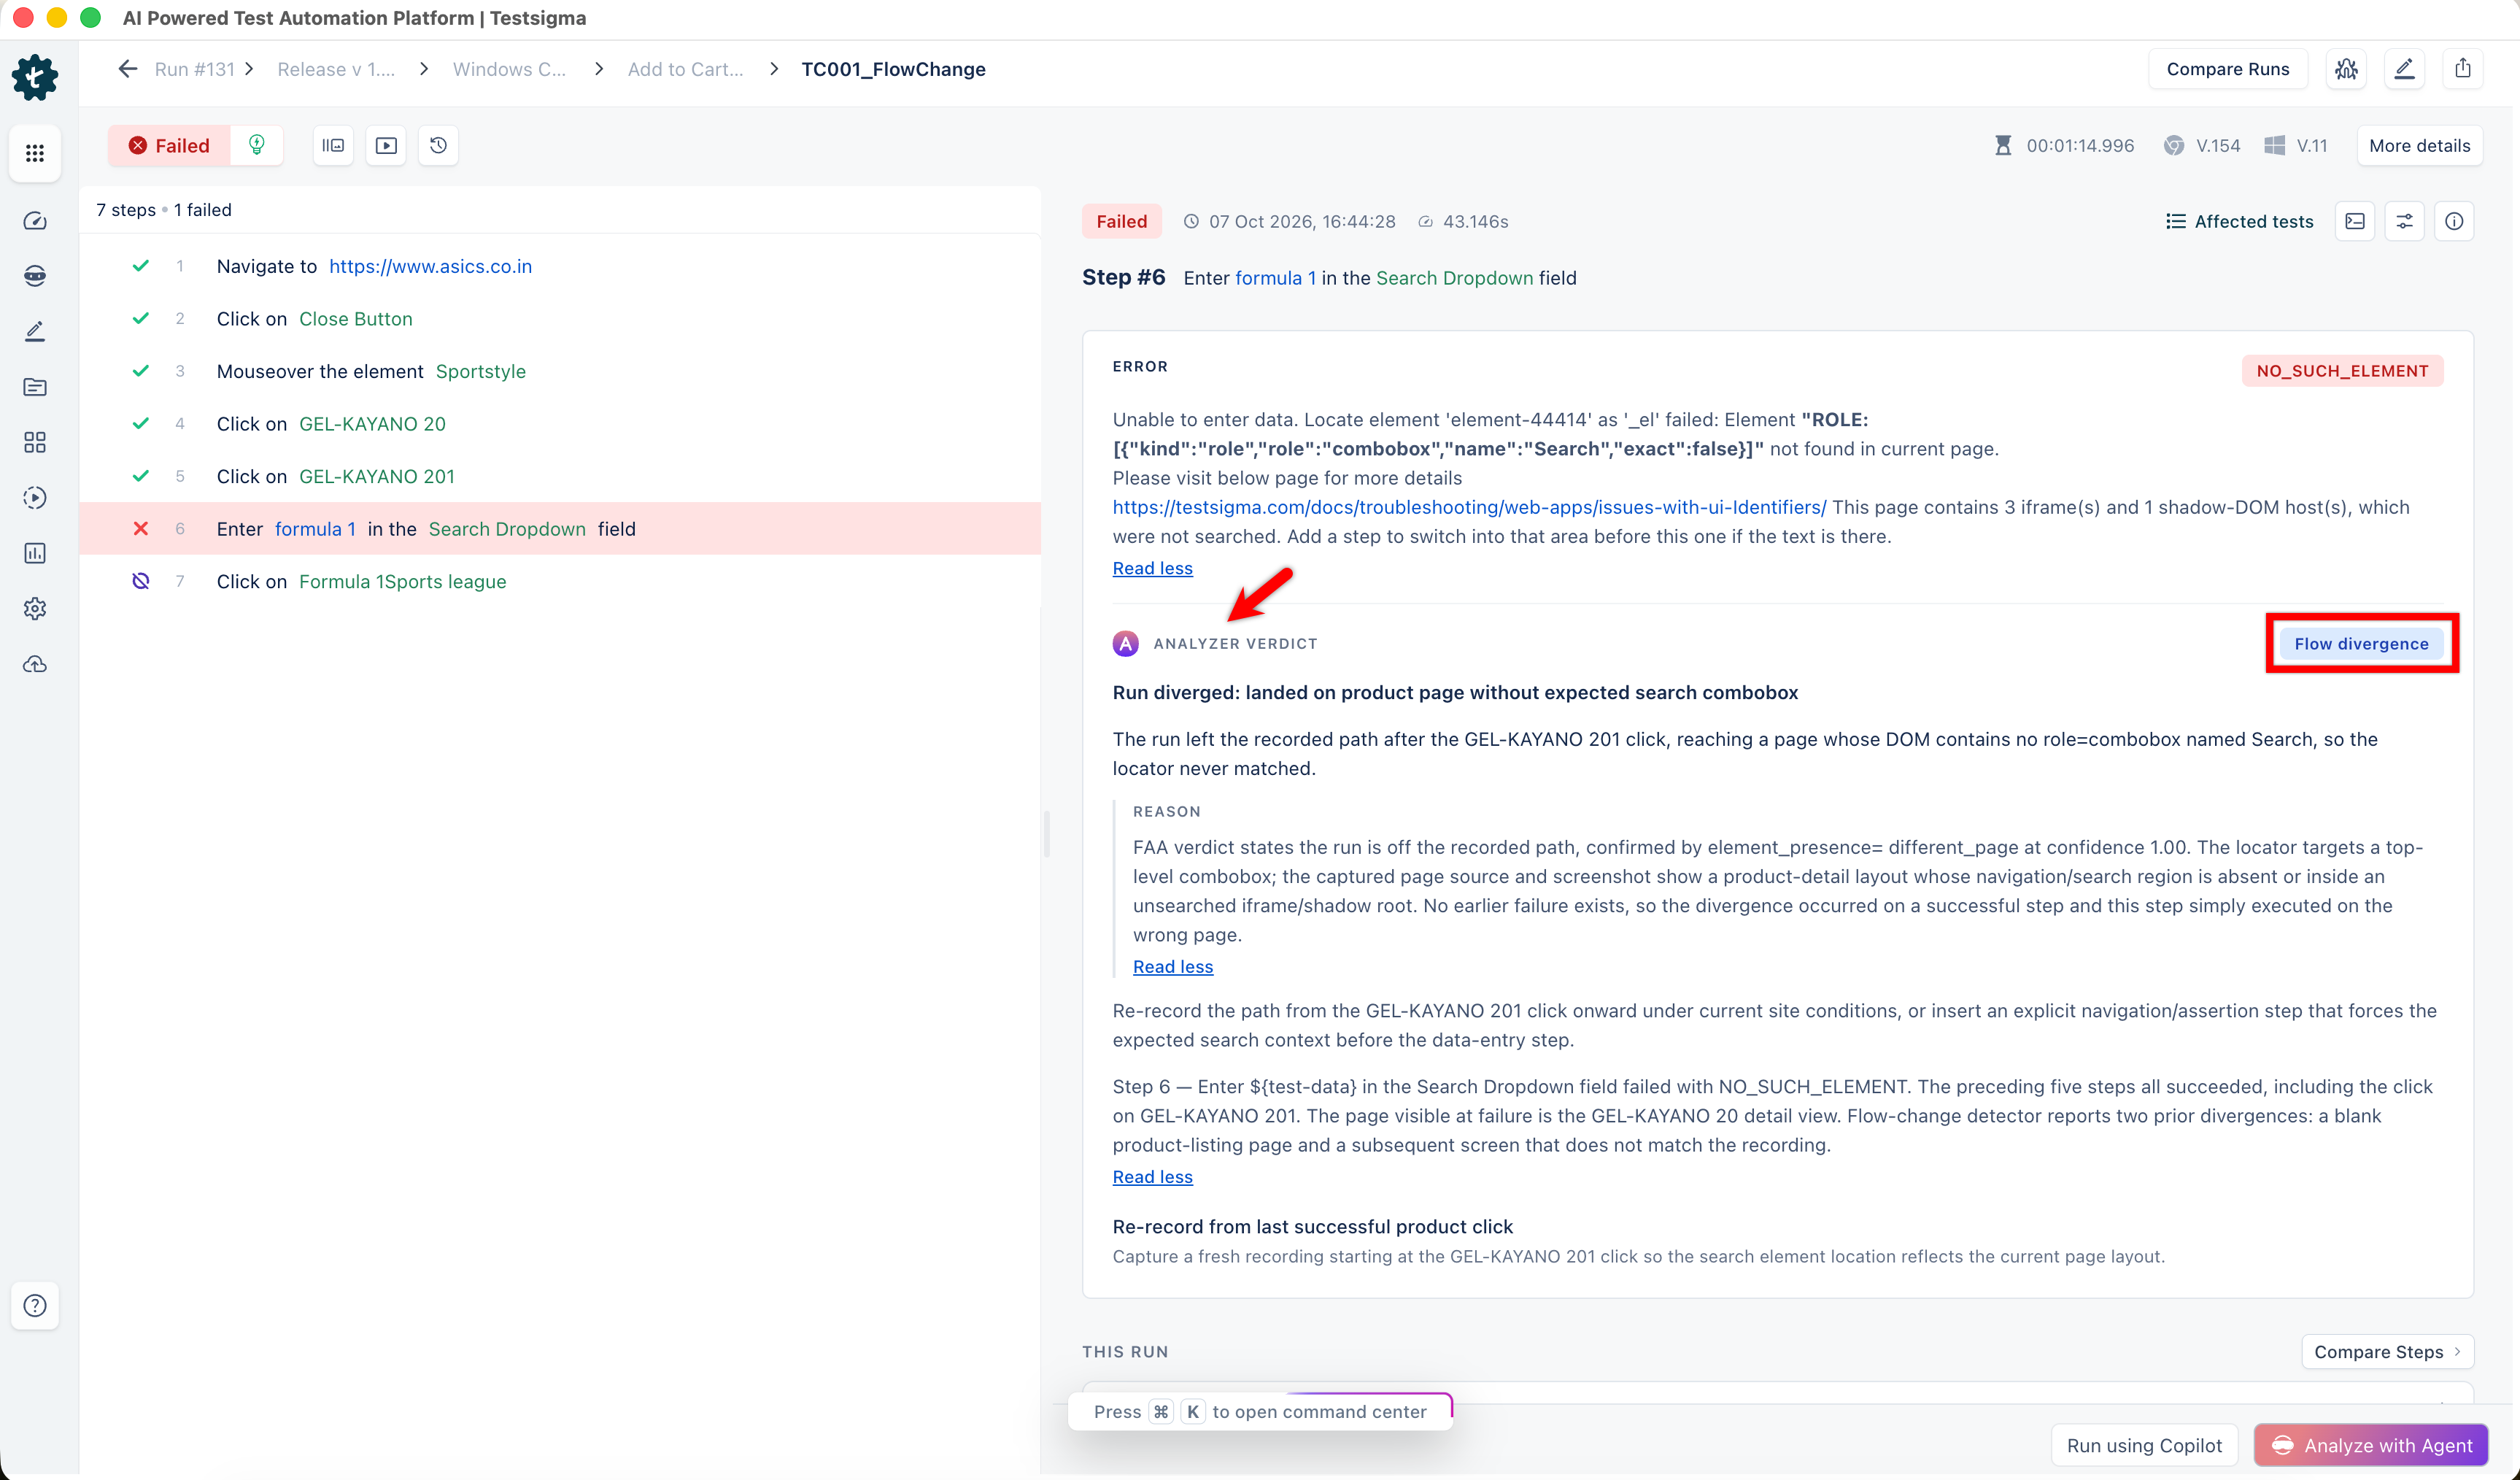
- The category badge reads Flow divergence or Prerequisite not completed.
- The summary names the failed step and what was on the page instead, such as a product page where a search page was expected.
- REASON explains how the run left the recorded path, and whether earlier failures caused it or it is an independent deviation. Click Read more to expand it.
- The recommendation names the step from which to re-record, or what to add before the failed step.
- Select the steps before the failed step in the step list, and check their screenshots in the THIS RUN section to find where the run left the recorded path.
-
Fix the test case:
- For Flow divergence, edit the test case and re-record the steps from the point where the run diverged, or add the navigation step that is missing.
- For Prerequisite not completed, select the fix option in the verdict and click Apply fix.
- Re-run the test to confirm the fix.
Not every verdict has an Apply fix button. When the fix requires re-recording steps, the verdict names the fix and describes it, but you make the change in the test case.
Check the Logs
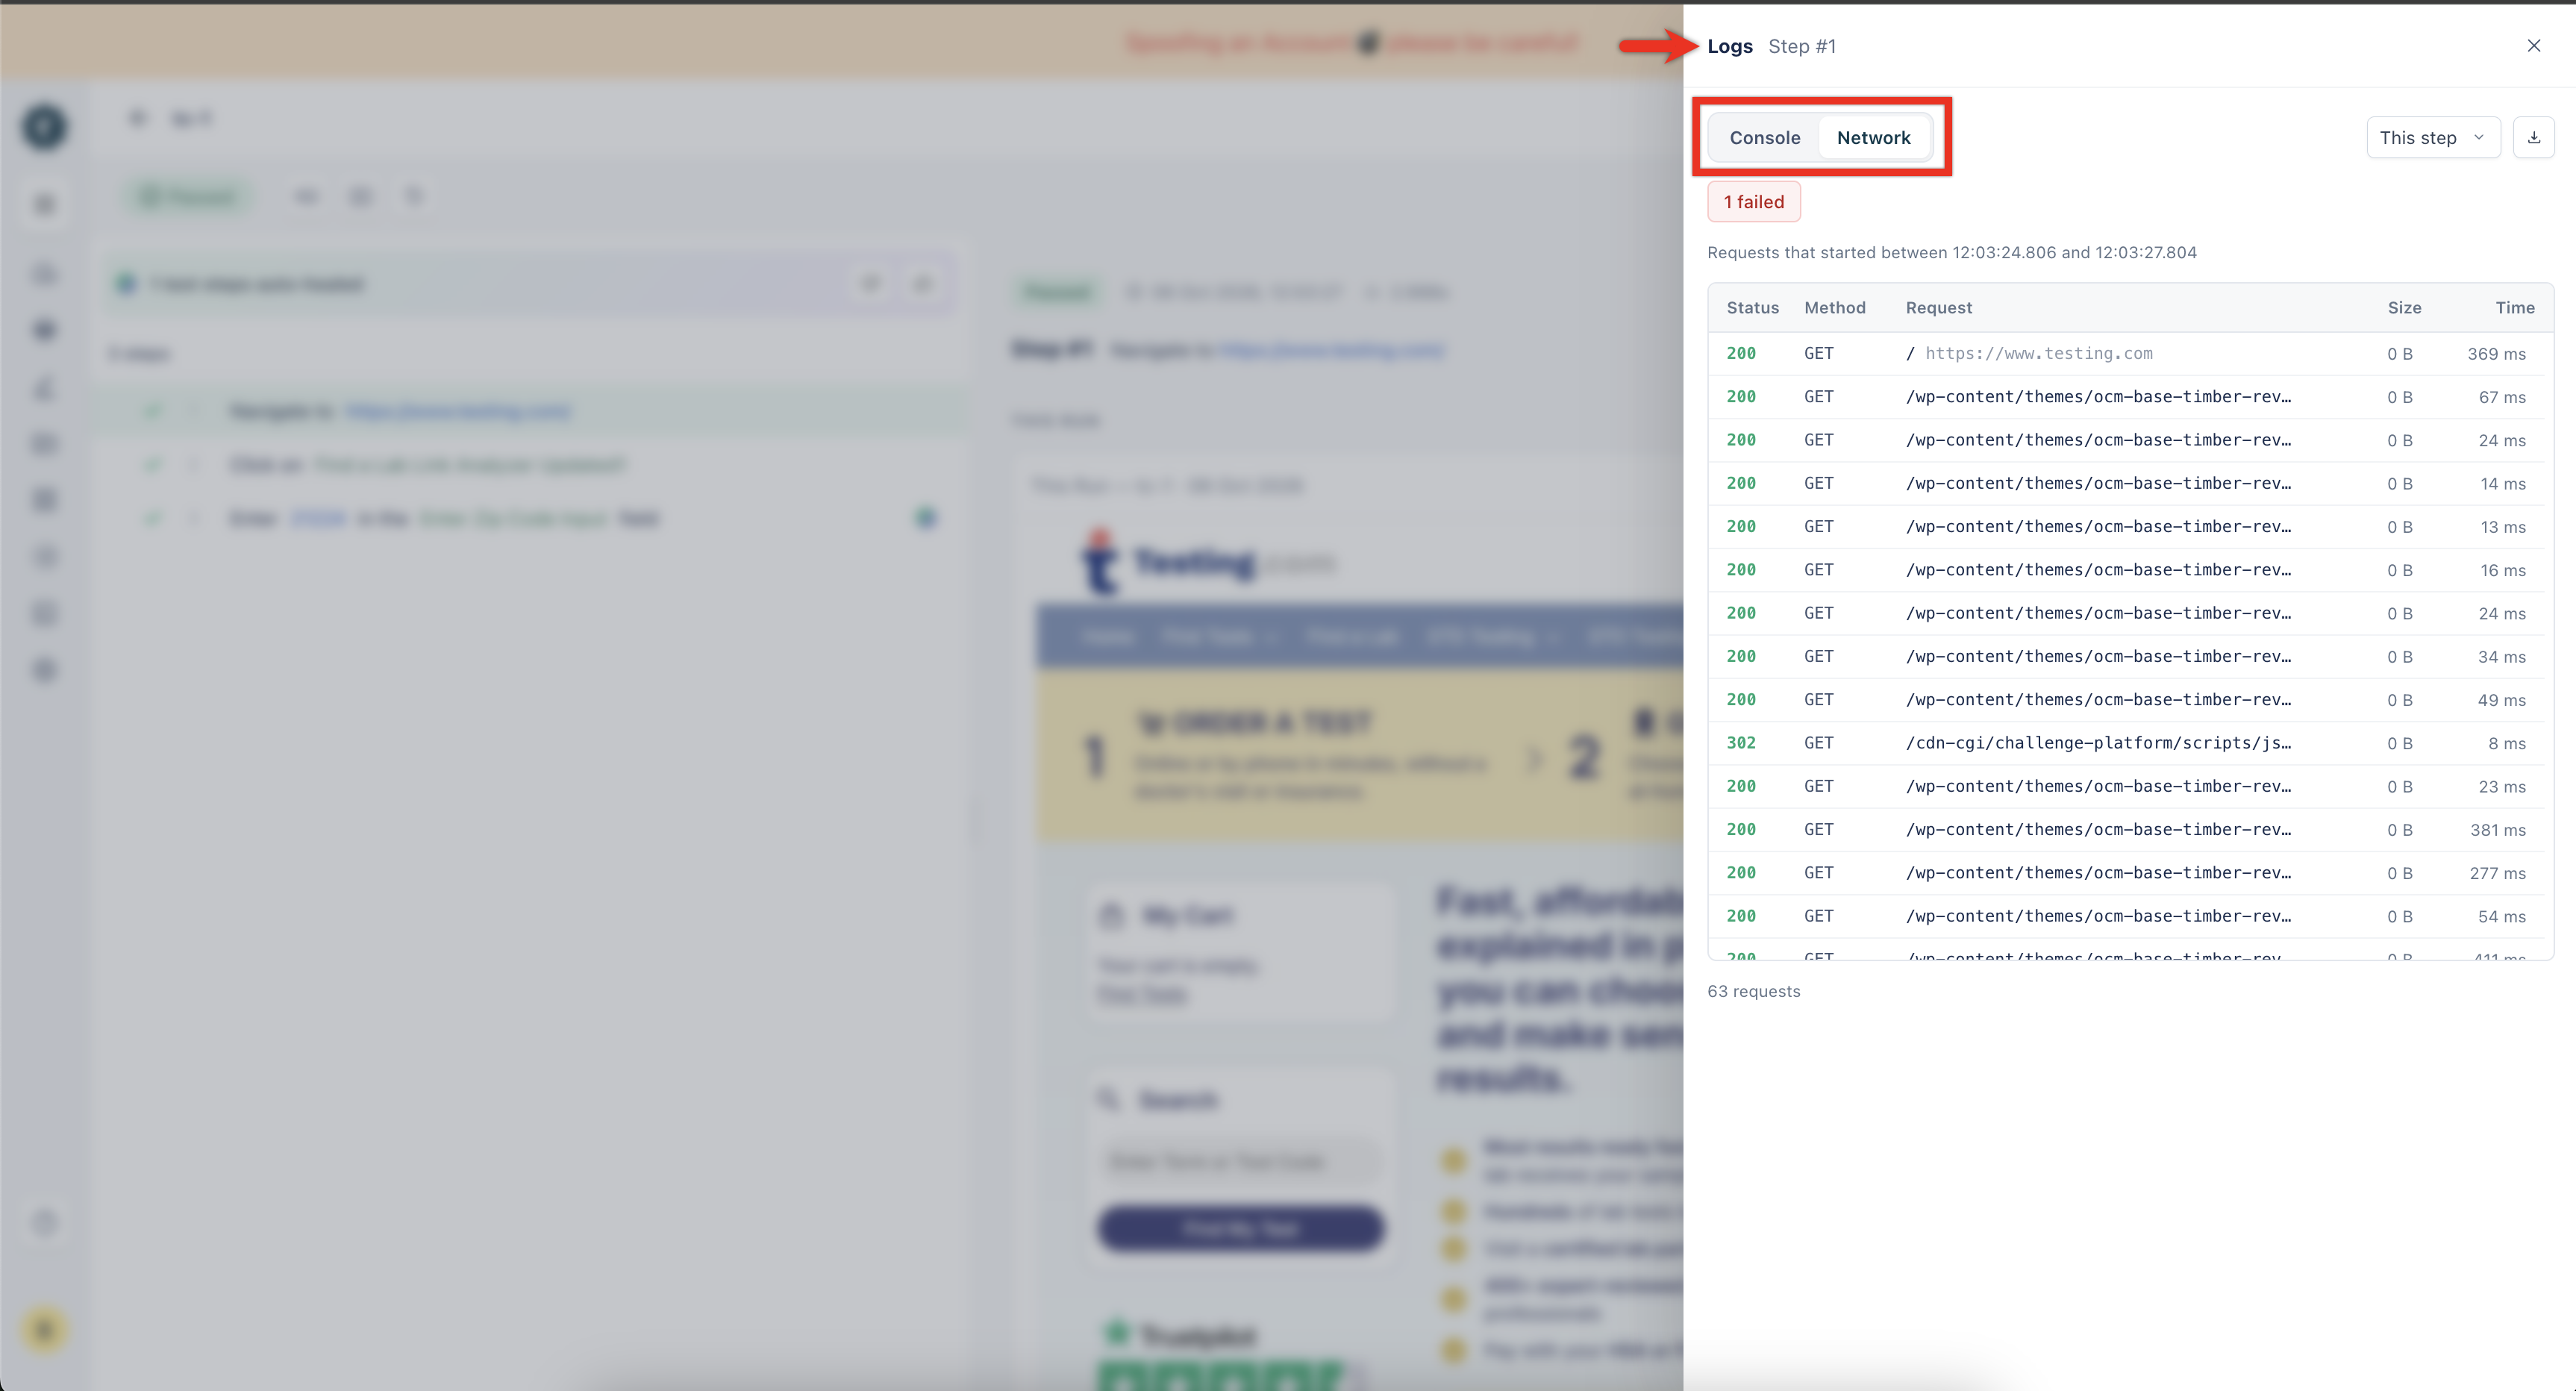
- In the step header, click the Logs icon. The Logs panel opens on the right.
- Click Console or Network.
-
From the scope list, select This step to see only the logs captured during the step.
The Network tab shows the number of failed requests, the time window the requests started in, and a table of requests with their status, method, URL, size, and time. The total request count appears below the table.
- Click the download icon to save the logs.
Some logs have no step markers. When that happens, the log shows every entry for the run and displays the message "Not scoped to this step: this log has no step markers, so the whole run is shown".
Additional Information
Network logs are captured only when they are switched on for the test machine, and they appear once the upload from the test machine finishes. Until then, the Network tab reads "No network log was recorded for this run".
Check Whether a Step Was Healed
When auto-healing resolves a locator during the run, the step's status reads Healed, and the step shows the auto-heal icon in the step list. A banner above the step list shows how many steps were healed.
Select the healed step to see the Healed this step card with the locator change and the Approve as Primary button. For the full workflow, refer to the documentation on auto-healing insights.
Compare Against an Earlier Run
Comparing a failing step against an earlier run shows what changed between them. There are two entry points:
- Click Compare Runs in the page header to compare the whole test case across two runs, step by step.
- Click Compare Steps in the THIS RUN section to compare the current step alone.
For both workflows, refer to the documentation on test plan run results.
Check What Else the Element Affects
When an element causes a failure, check which other tests depend on it before you fix it.
-
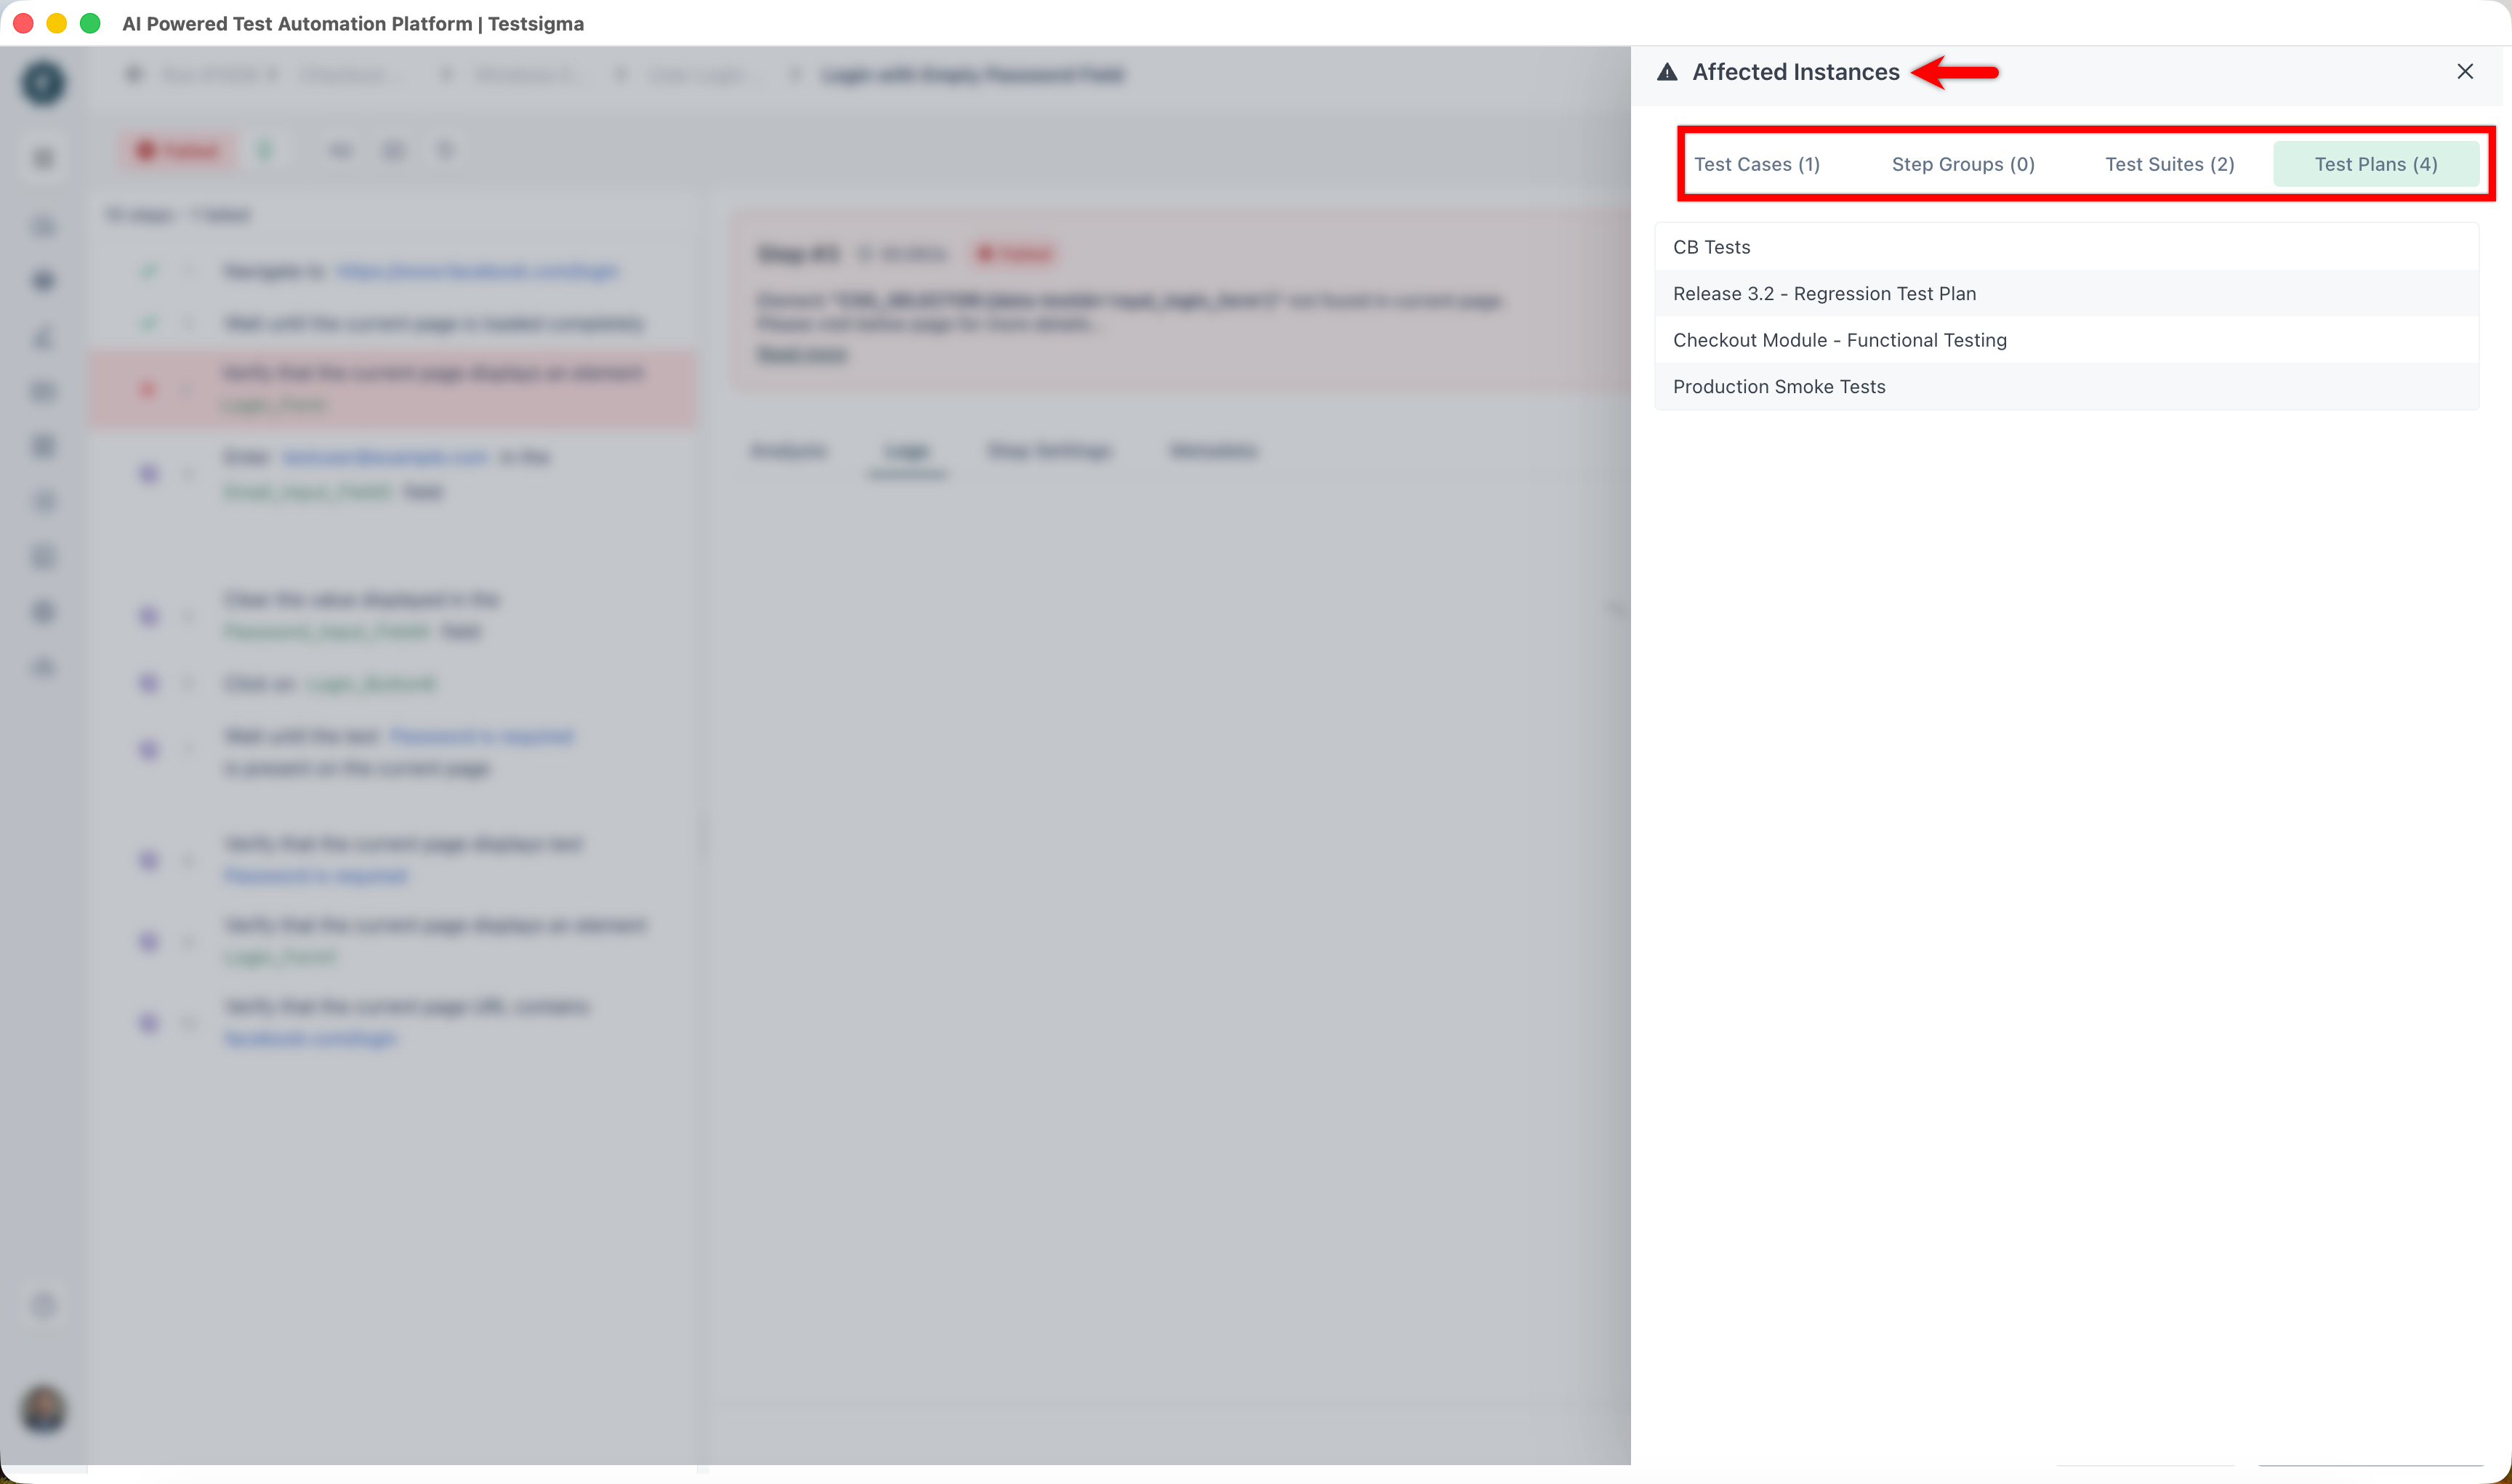
Click Affected tests in the step header.
The Affected Instances panel opens, showing the Test Cases, Step Groups, Test Suites, and Test Plans that use the same element, each with a count.
-
Review each tab to see what is at risk of the same failure.
When no test uses the element, the panel reads "There are no Test Cases associated with the element".
You can also reach this from the left navigation bar by going to Elements and clicking View Affected Test Cases for the element.
Act on the Failure
Resolve the failure without leaving the results page.
- If the ANALYZER VERDICT section lists fix options, select one and click Apply fix. When the run left the recorded path, re-record the affected steps instead.
- Click Analyze with Agent in the action bar to get the error type, the root cause, and a set of suggestions you can apply as a step update.
- Click Run using Copilot in the action bar to rerun the test case interactively.
- For a healed step, approve the new locator from the Healed this step card. For details, refer to the documentation on auto-healing insights.
Common Causes of Failure
Test cases commonly fail for these reasons:
- The element or UI identifier changed in the application.
- The application does not load.
- The local internet connection fails.
- The element is unchanged, but navigation to it changed.
- Add-on code does not perform as expected.
- The application under test contains a defect.
- The result is a false positive or false negative.
- An API is down.
- The element locator is incorrect.

Want to contribute or report missing content?