- Results & Reports
 Test Plan Run Results
- Filters on Run Results
- Custom PDF Report Generation
- Custom Allure Reports Generation
- Custom JUnit Report Generation
- Dashboard
Test Plan Run Results in Testsigma
View and download reports from the Run Results page. The page presents results at the test case, test suite, and test machine level, and shows the count of passed and failed tests along with the reason for each failure. Drill into a single step to read its details and errors, check its logs, and compare it against an earlier run.
Prerequisites
Before you begin, ensure that:
- You have referred to the documentation on creating test plans.
- A test plan has completed at least one run.
Steps to View Test Suite Results
- From the left navigation bar, go to Run Results and click the test plan for which you want to check the results.
- Results open at the test suite level by default.
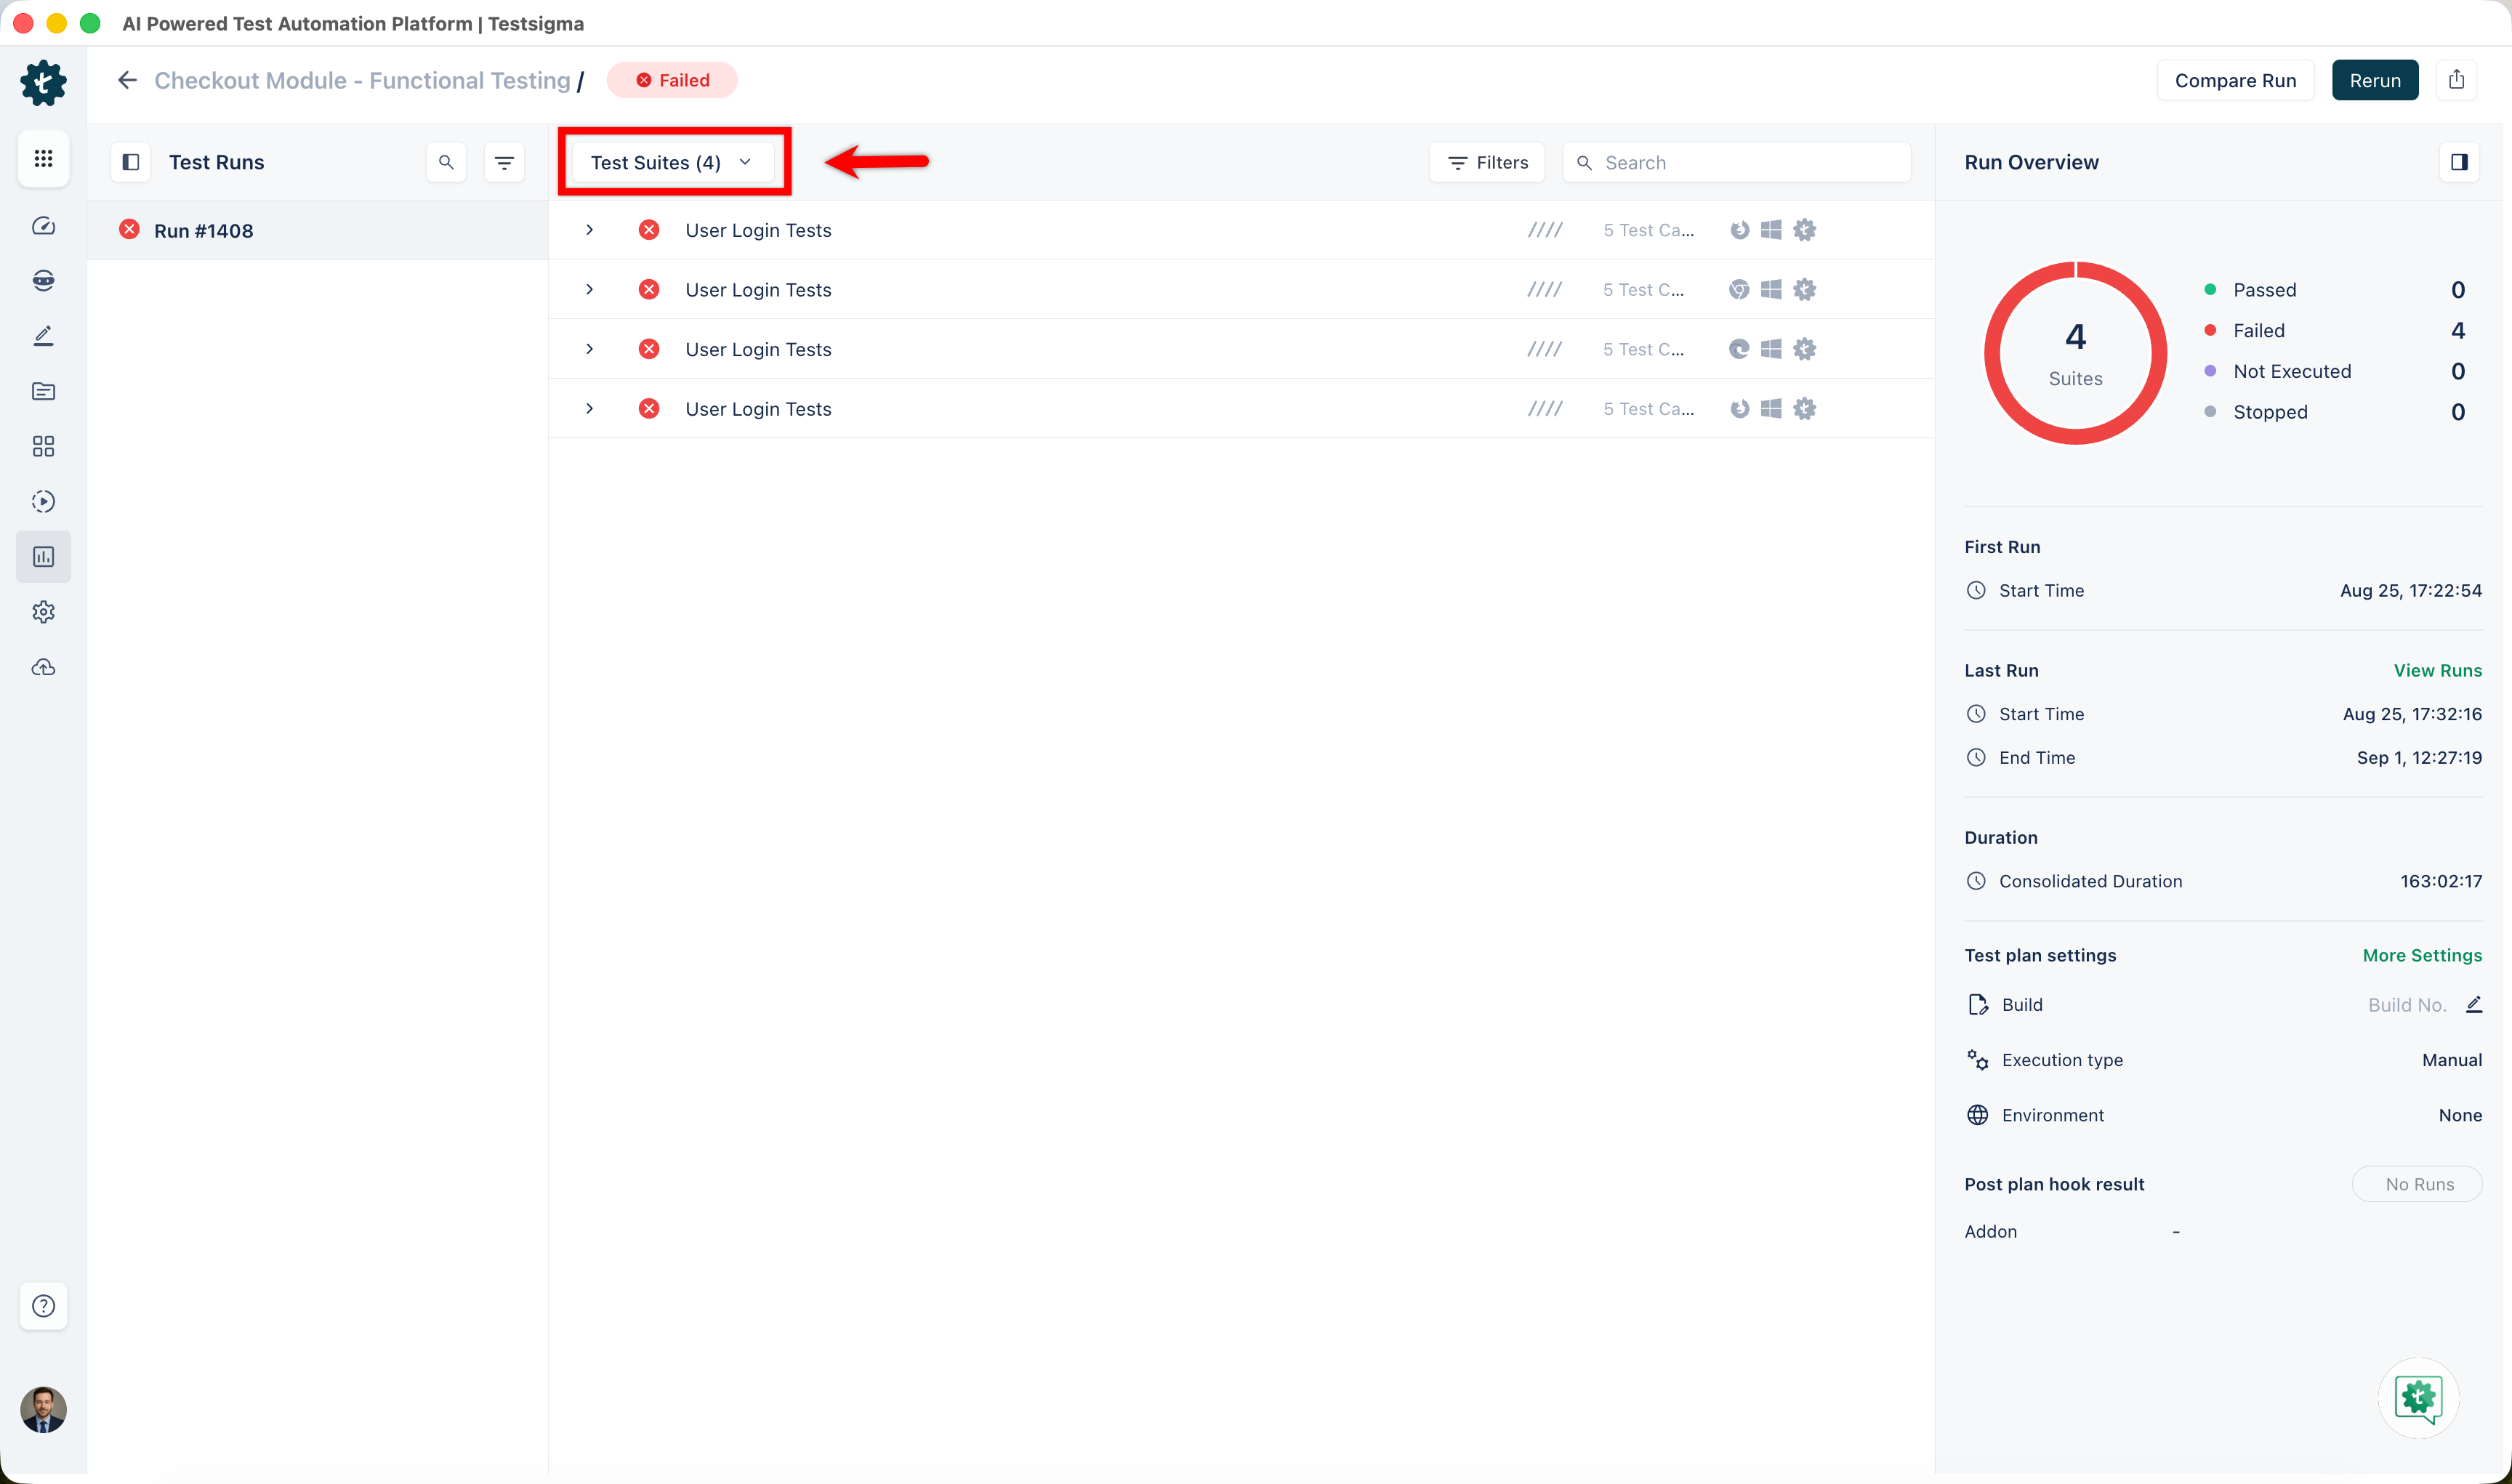
- Expand a test suite to check the test case results inside it.
- The parallel indicators on each row show how many test suites run in parallel, and how many test cases run in parallel within each suite.
Steps to View Test Case Results
- On the Run Results page, select Test Cases from the dropdown menu.
- The page displays all test cases from all test suites.
- Hover over a failed test case to view a brief description of the reason for failure.
- Click a test case to view its detailed results.
-
On the Test Case Results page, the step list appears on the left, headed by the step count. Select a step to open its details on the right.
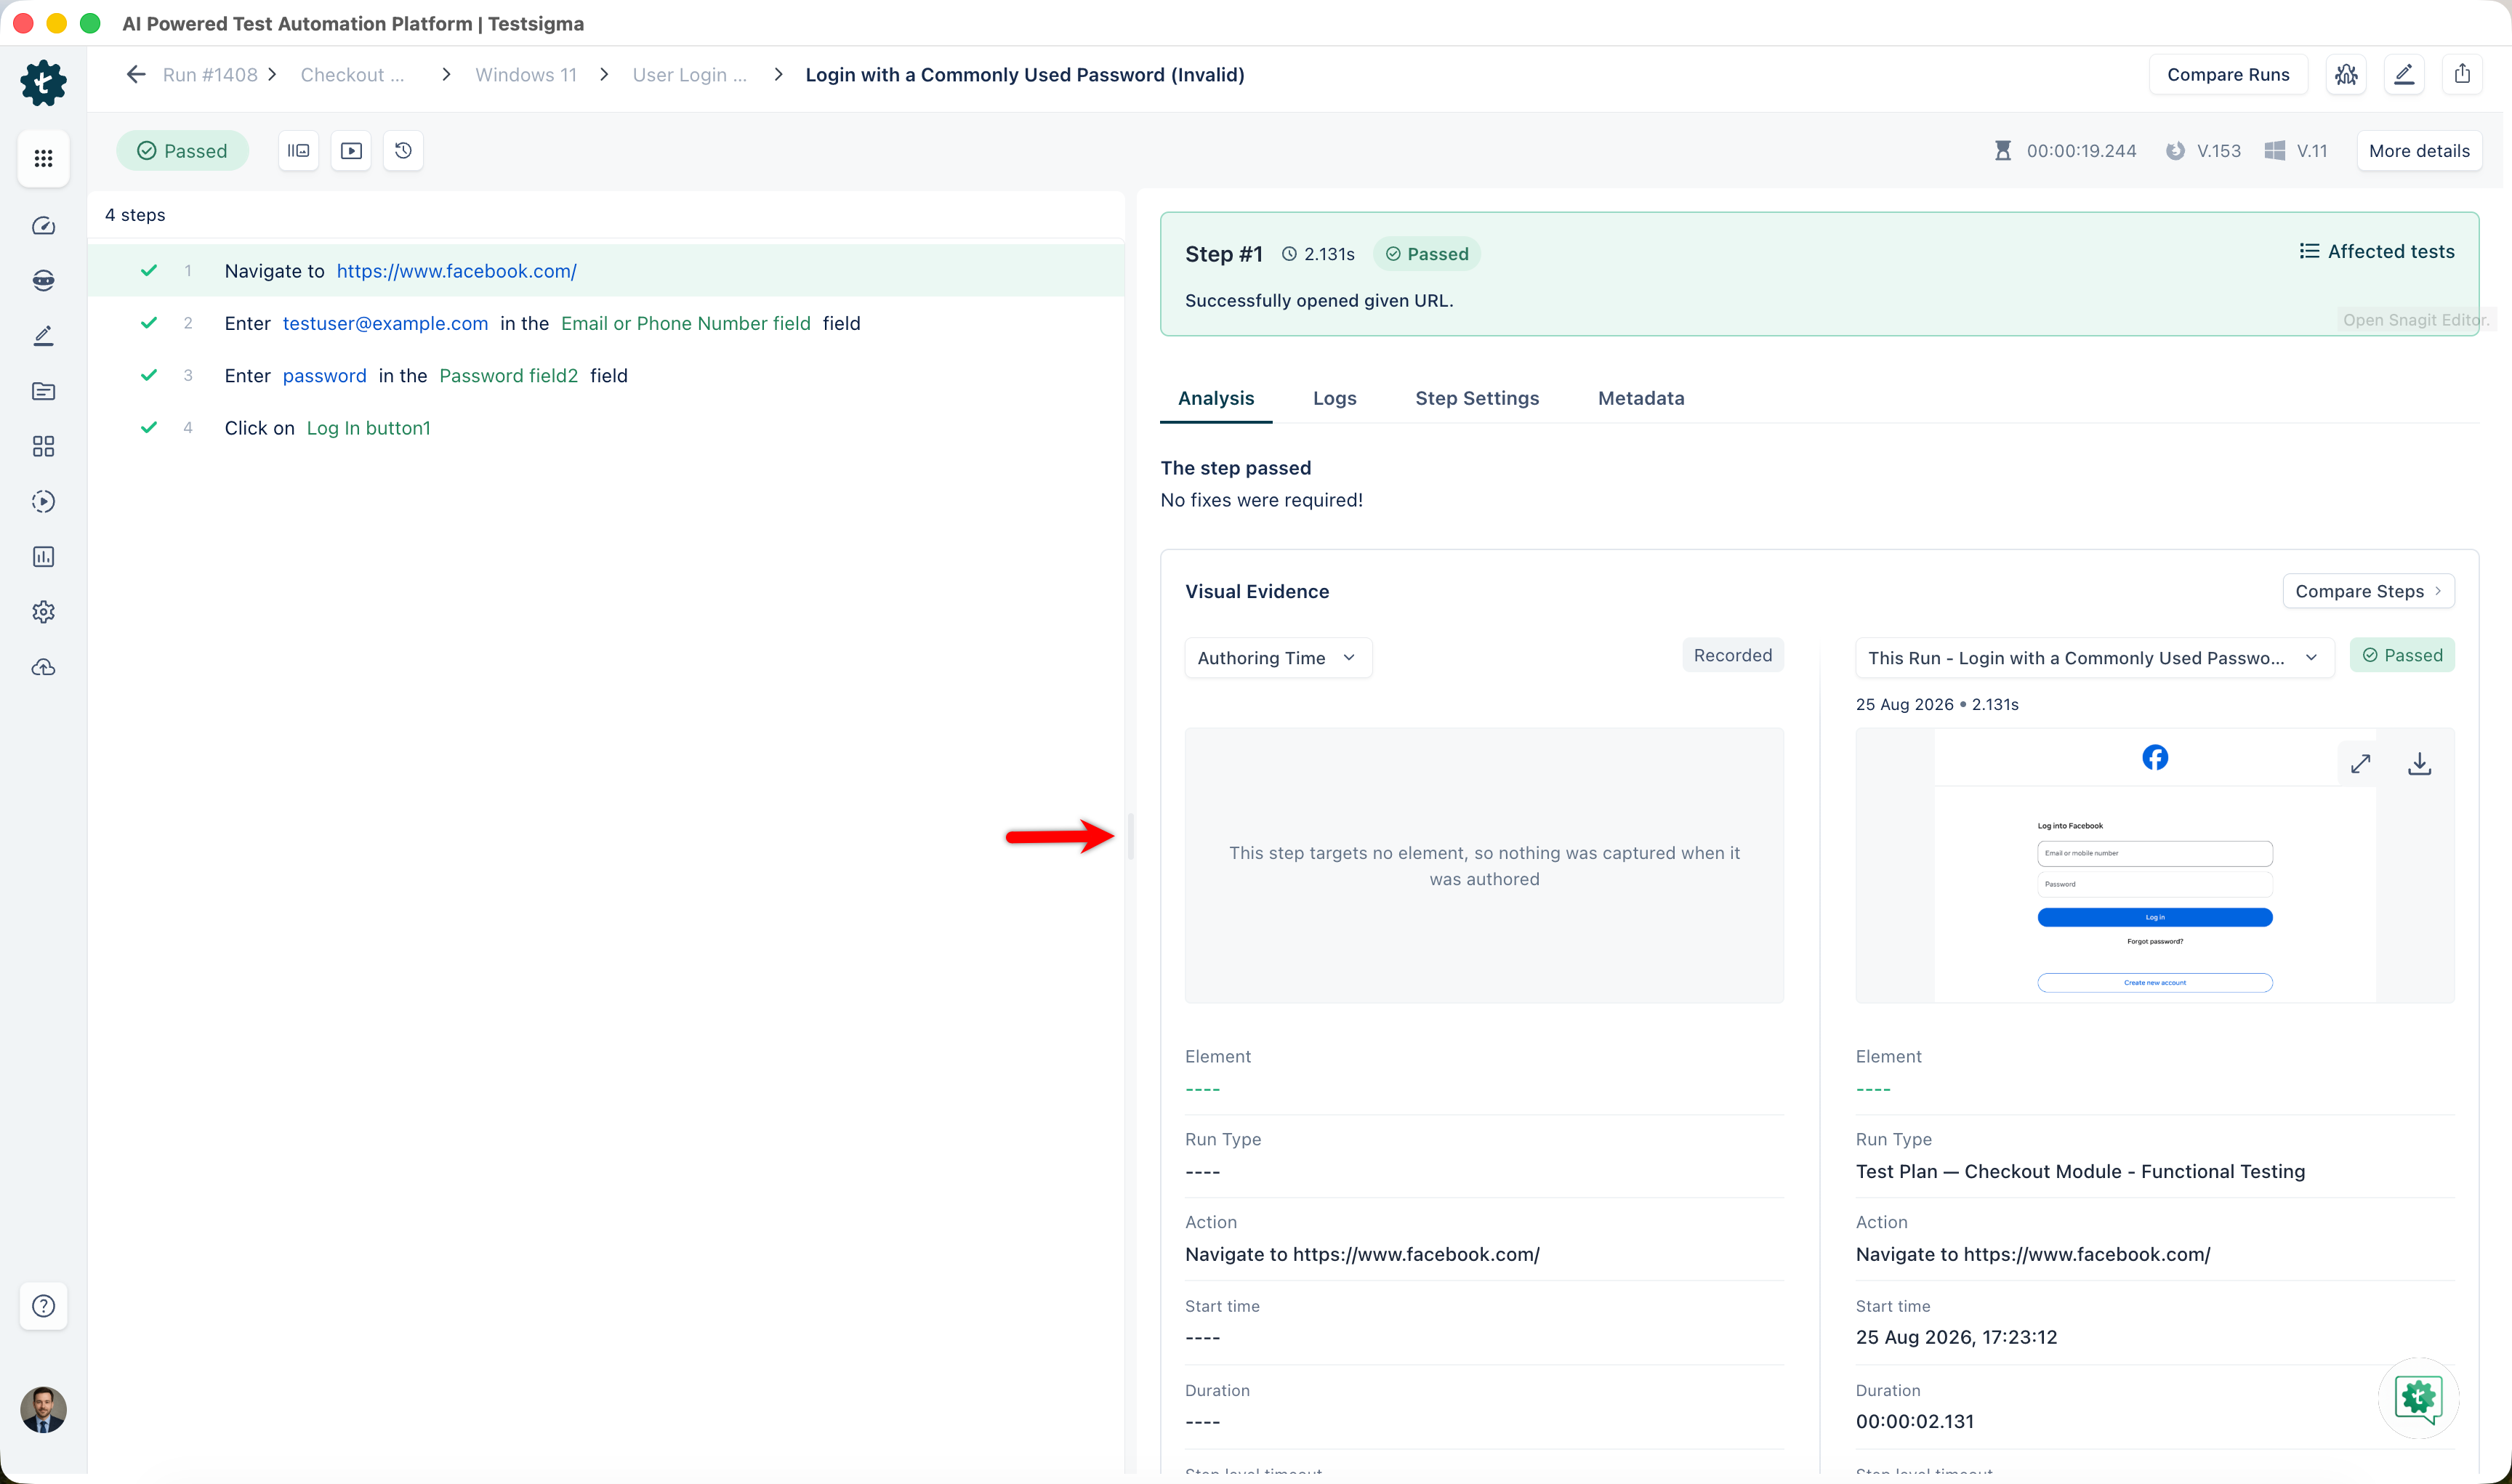
Each step in the list shows its status icon. A healed step also shows the auto-heal icon at the end of its row.
NOTE:When a run contains healed steps, a banner above the step list shows how many steps were auto-healed. Use the thumbs up and thumbs down icons on the banner to rate the heal.
-
Review the step details on the right.
The header above the step list shows the total run duration, the browser version, and the operating system version. The step header shows the step status, start time, duration, step number, and step action.
The THIS RUN section shows the screenshot captured for the step. Click the expand icon to view it full size, or the download icon to save it. Below the screenshot, the step details show:
Field What it shows Element The element the step targets. Steps without an element read "This step targets no element". Locator The locator type and value used for the element Run Type The type of run that produced this result Test data type and Test data The data type and the value passed to the step Start time and Duration When the step started and how long it ran Step level timeout and Plan level timeout The wait limits applied to the step Error code and Error message The error raised during execution, if any NOTE:For a failed step, the ERROR and ANALYZER VERDICT sections appear above THIS RUN. For details, refer to the documentation on debugging test case failures.
- Click Affected tests to see what else depends on the element this step uses. The Affected Instances panel opens with tabs for Test Cases, Step Groups, Test Suites, and Test Plans, each with its count.
- Click More details to open Test Case Overview, which shows the step breakdown across Passed, Failed, Not Executed, and Stopped, the run message, and Machine Details.
Steps to View Test Machine Results
- On the Run Results page, select Test Machines from the dropdown menu.
- The page displays all test machines included in the test plan.
- Click a test machine to expand and view the test suites it contains.
To view the test cases that are part of a test machine, go to the Test Suites view and apply a Test Machine filter. This shows all test cases in the selected test suite and test machine.
Step Details Panels
The icons in the step header open side panels with more information about the selected step.
| Panel | What it contains |
|---|---|
| 1. Locators | The locator search for a healed step. Appears only on healed steps. For details, refer to the documentation on auto-healing insights. |
| 2. Logs | Console and network logs, for the step or a wider scope, with a download option |
| 3. Step Settings | Maximum wait time, prerequisite, and whether the step stops the test case on failure, is ignored in the test case result, or uses visual testing, Smart Execution, or accessibility testing |
| 4. Metadata | The step's test data and type, its ID and action, whether it uses a password, whether it was migrated, any additional data, and its step type and priority |
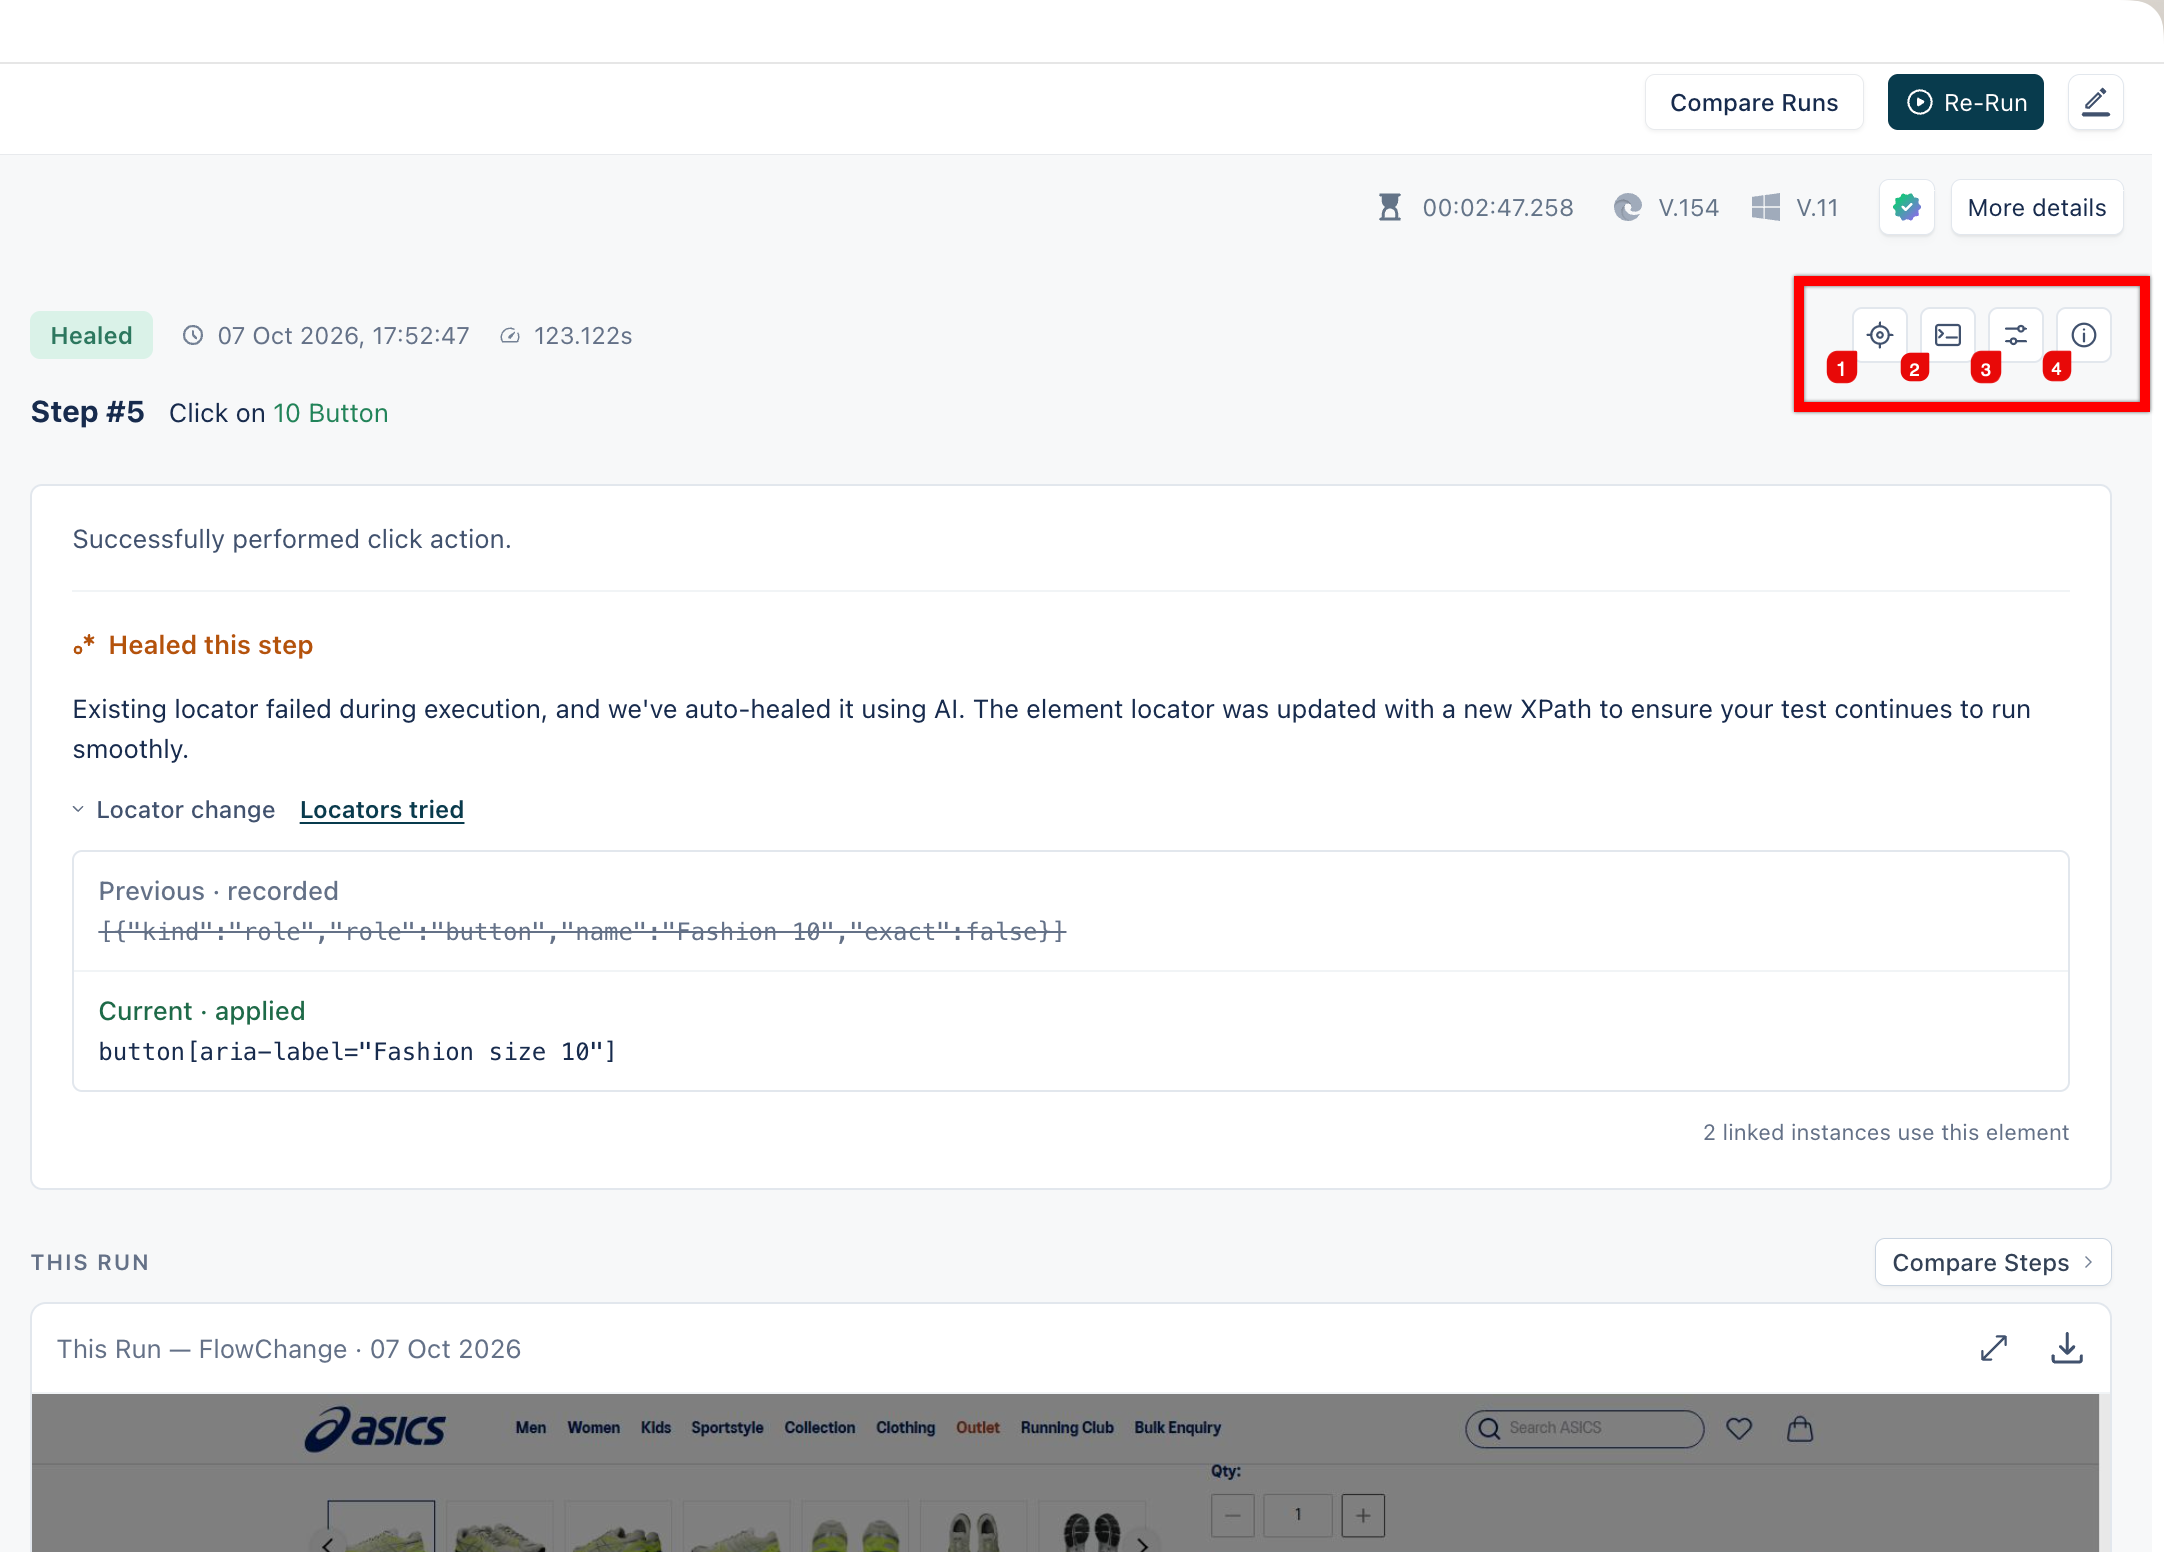
Click the close icon to return to the step details.
Test Runs in Run Results
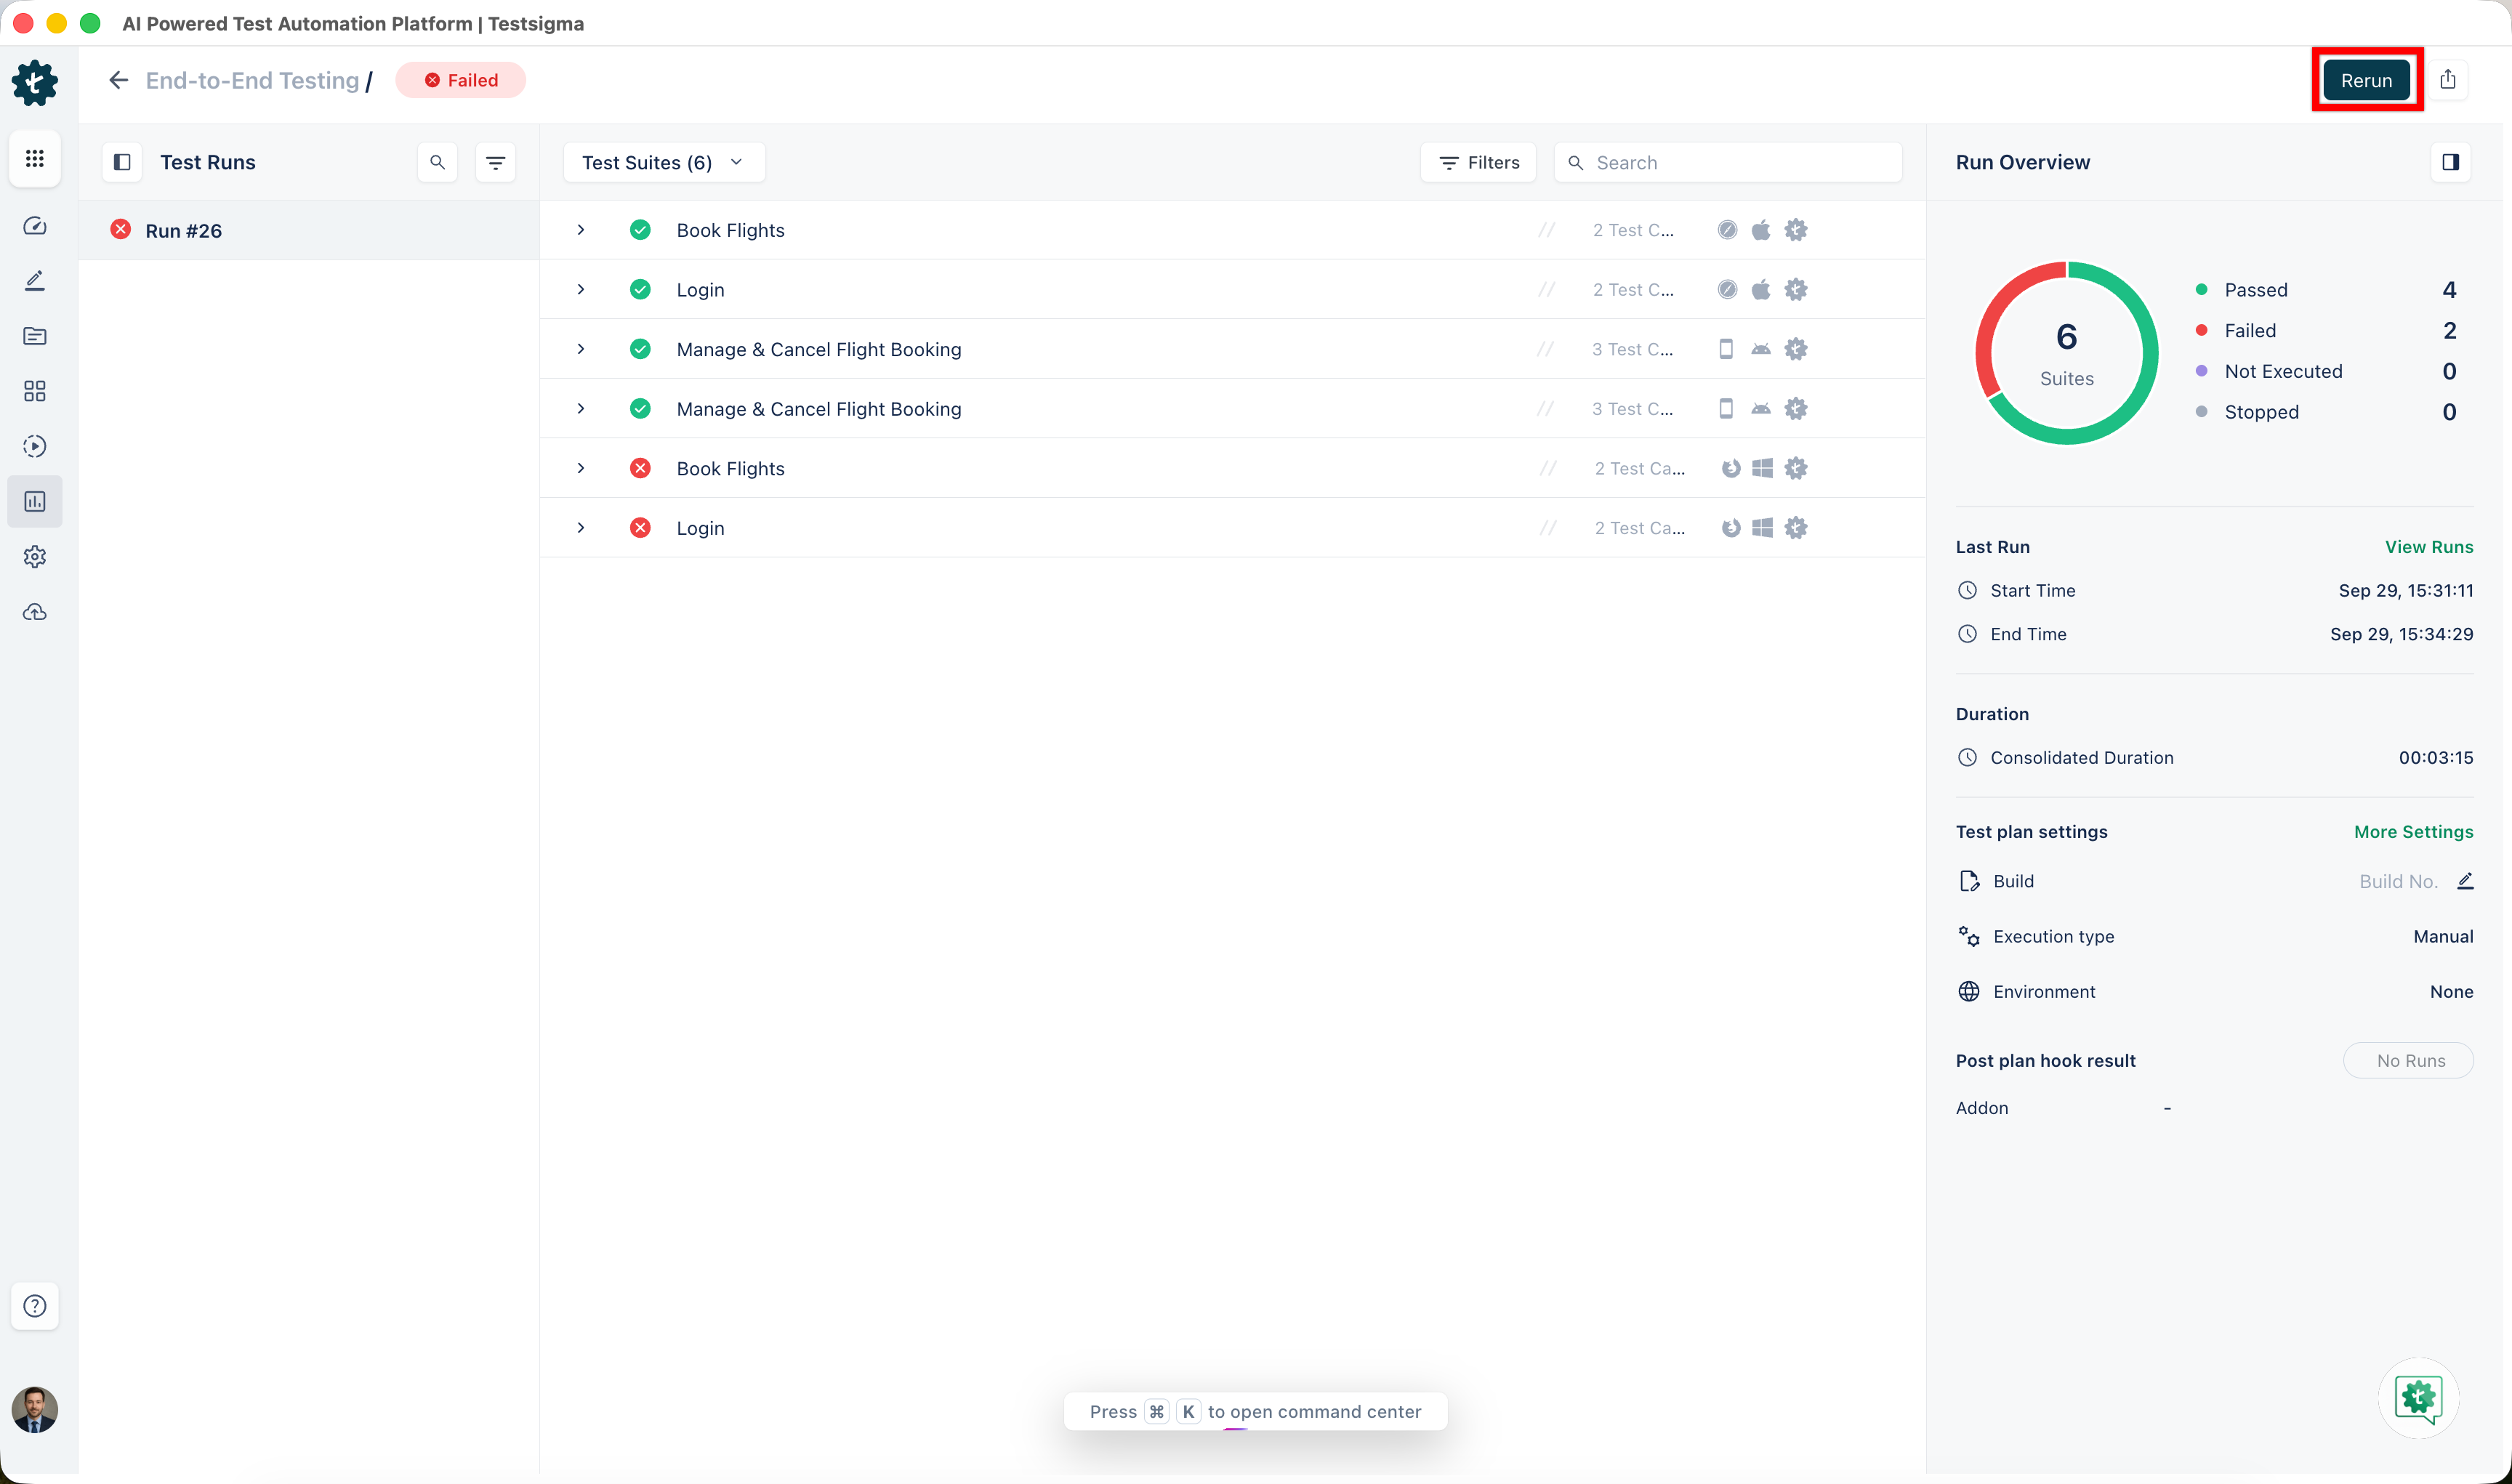
- From the Test Runs panel, select a run to view its test run results.
- Click Rerun in the top-right corner.
-
Select a rerun option:
- All Test Cases: Reruns all the test cases in the selected run.
- All Failed Test Cases: Reruns only the test cases that failed in the selected run.
- Select Cases for Re-Run: Reruns only the test cases you select.
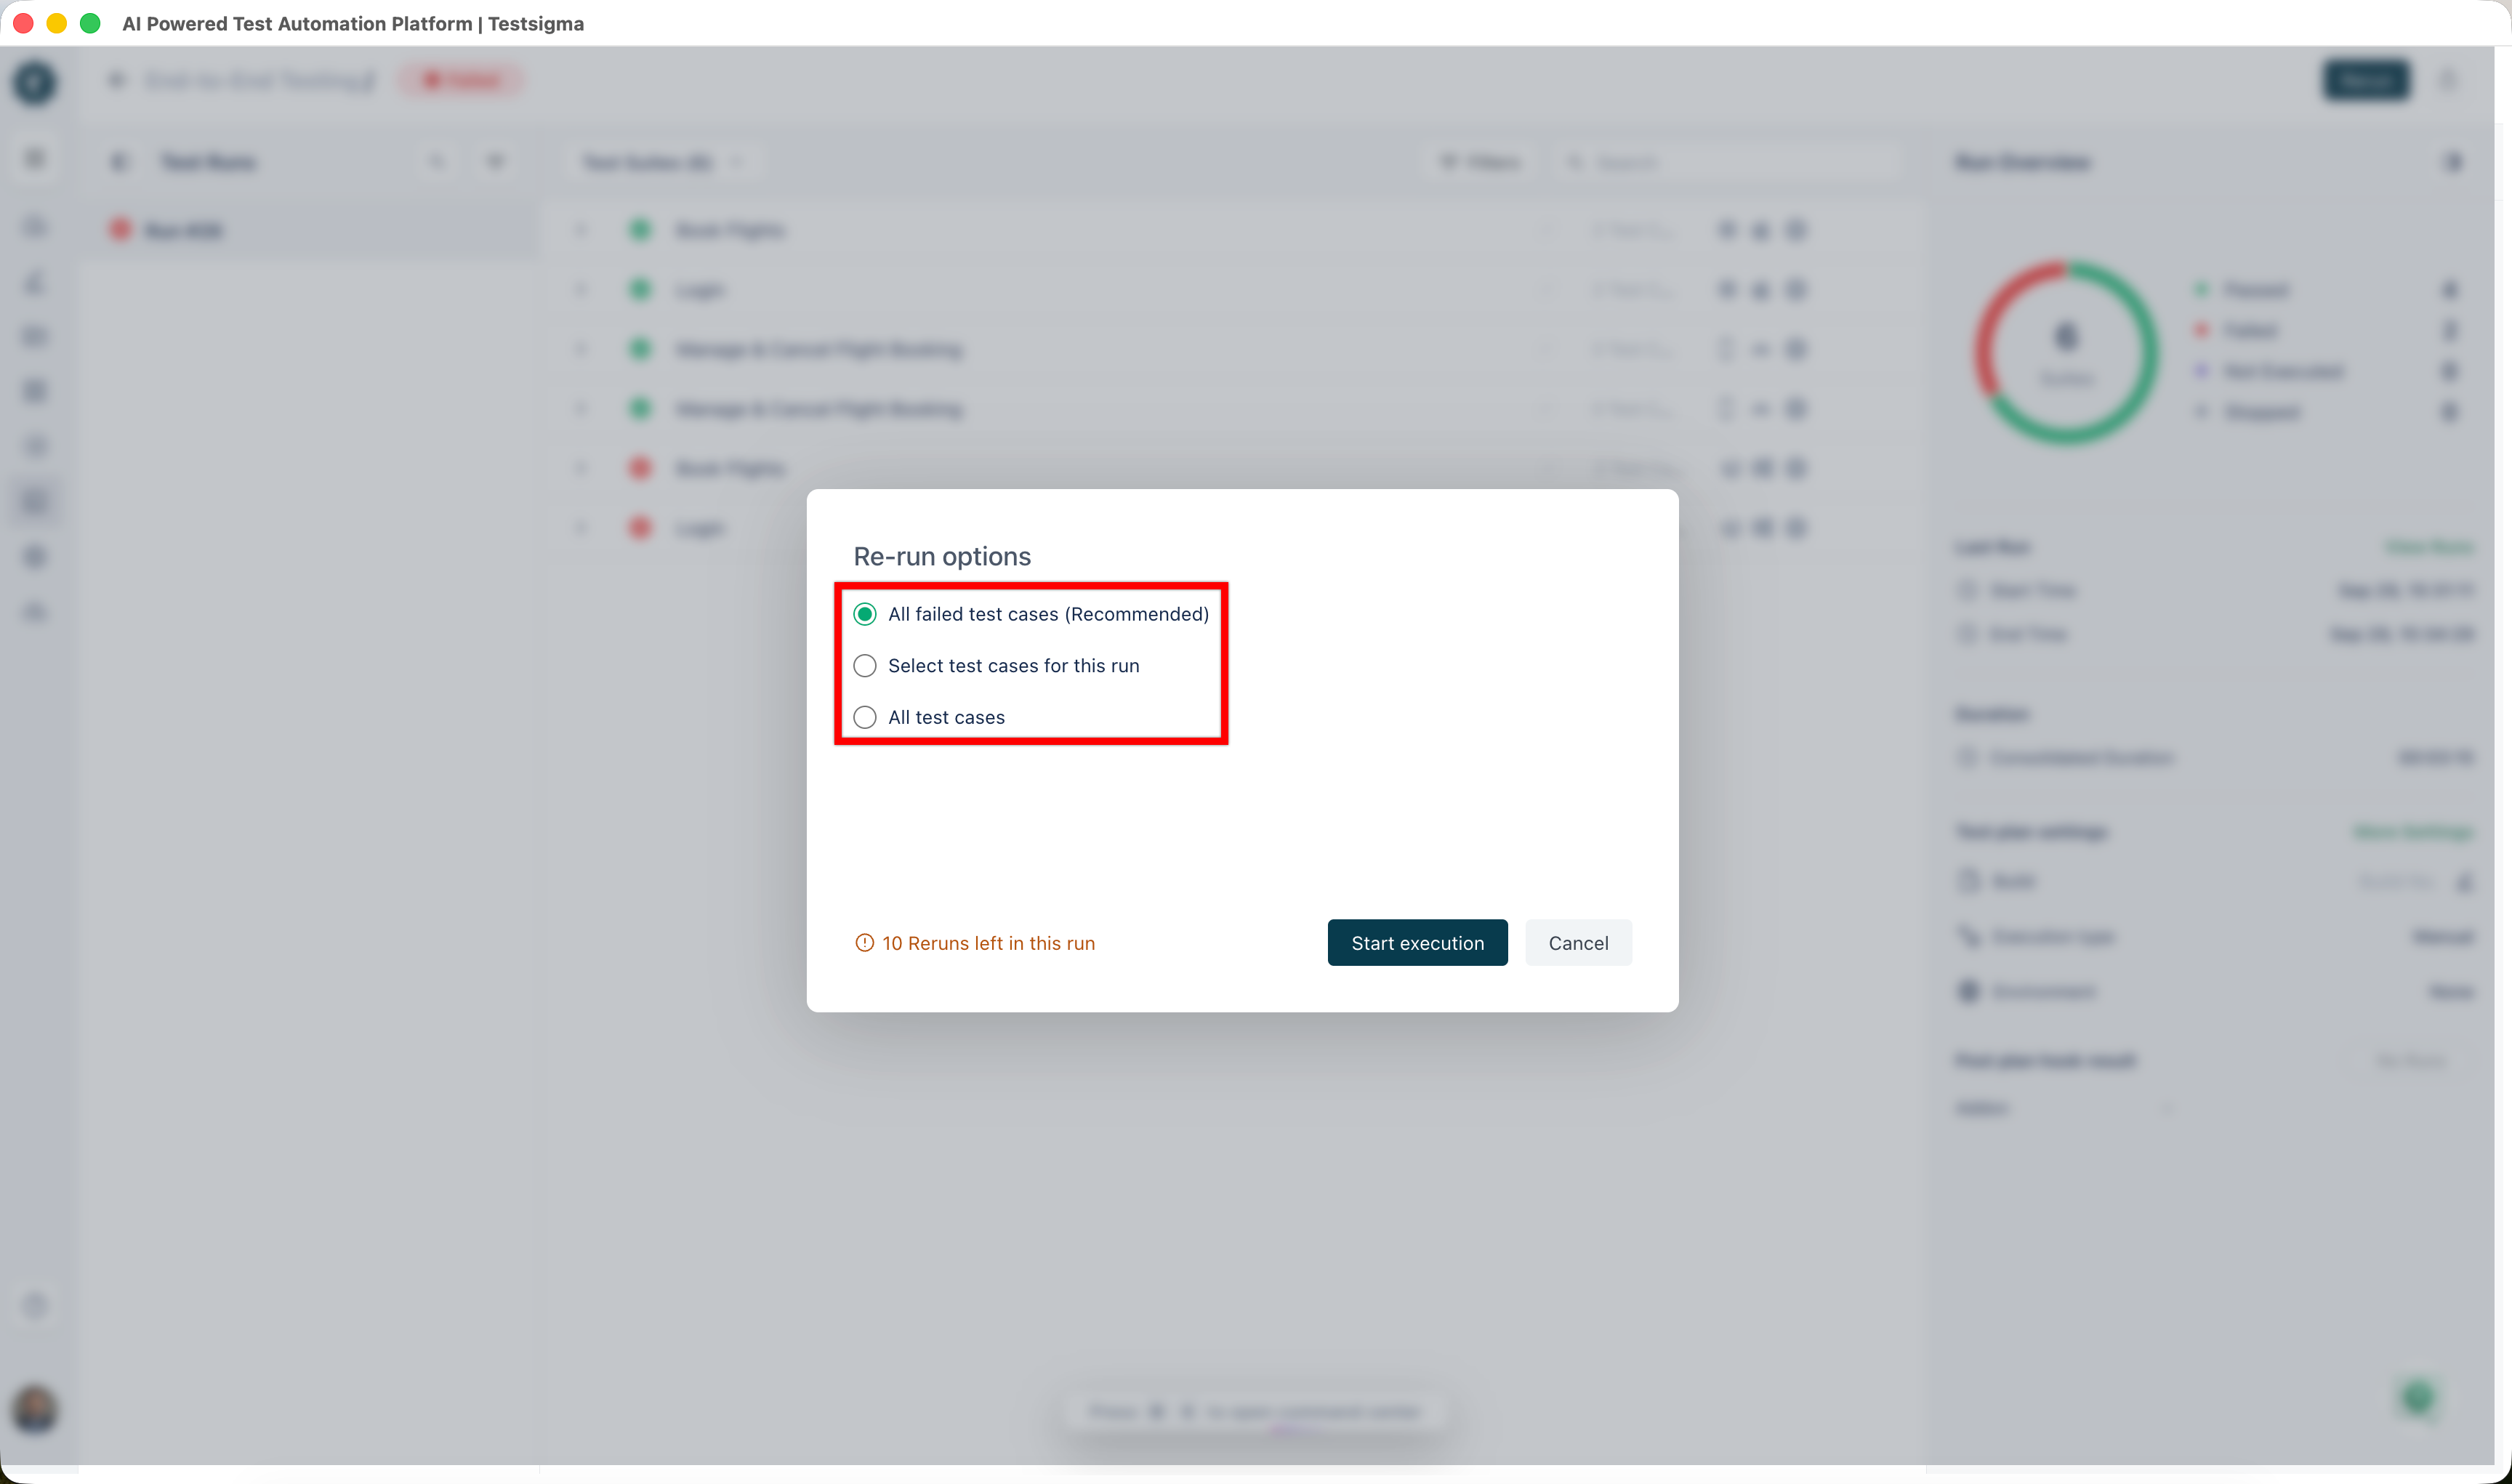
- Click Start execution.
Each run ID has a maximum rerun limit of 10.
When a test suite or test machine has a prerequisite, its Rerun options setting decides what happens to the prerequisite during a rerun. With Always run Pre-Requisite, the prerequisite runs again in full before the failed test cases. With Only execute failed Pre-Requisite iteration(s), only the prerequisite iterations that failed run again, so passed test cases aren't re-executed.
Compare Runs
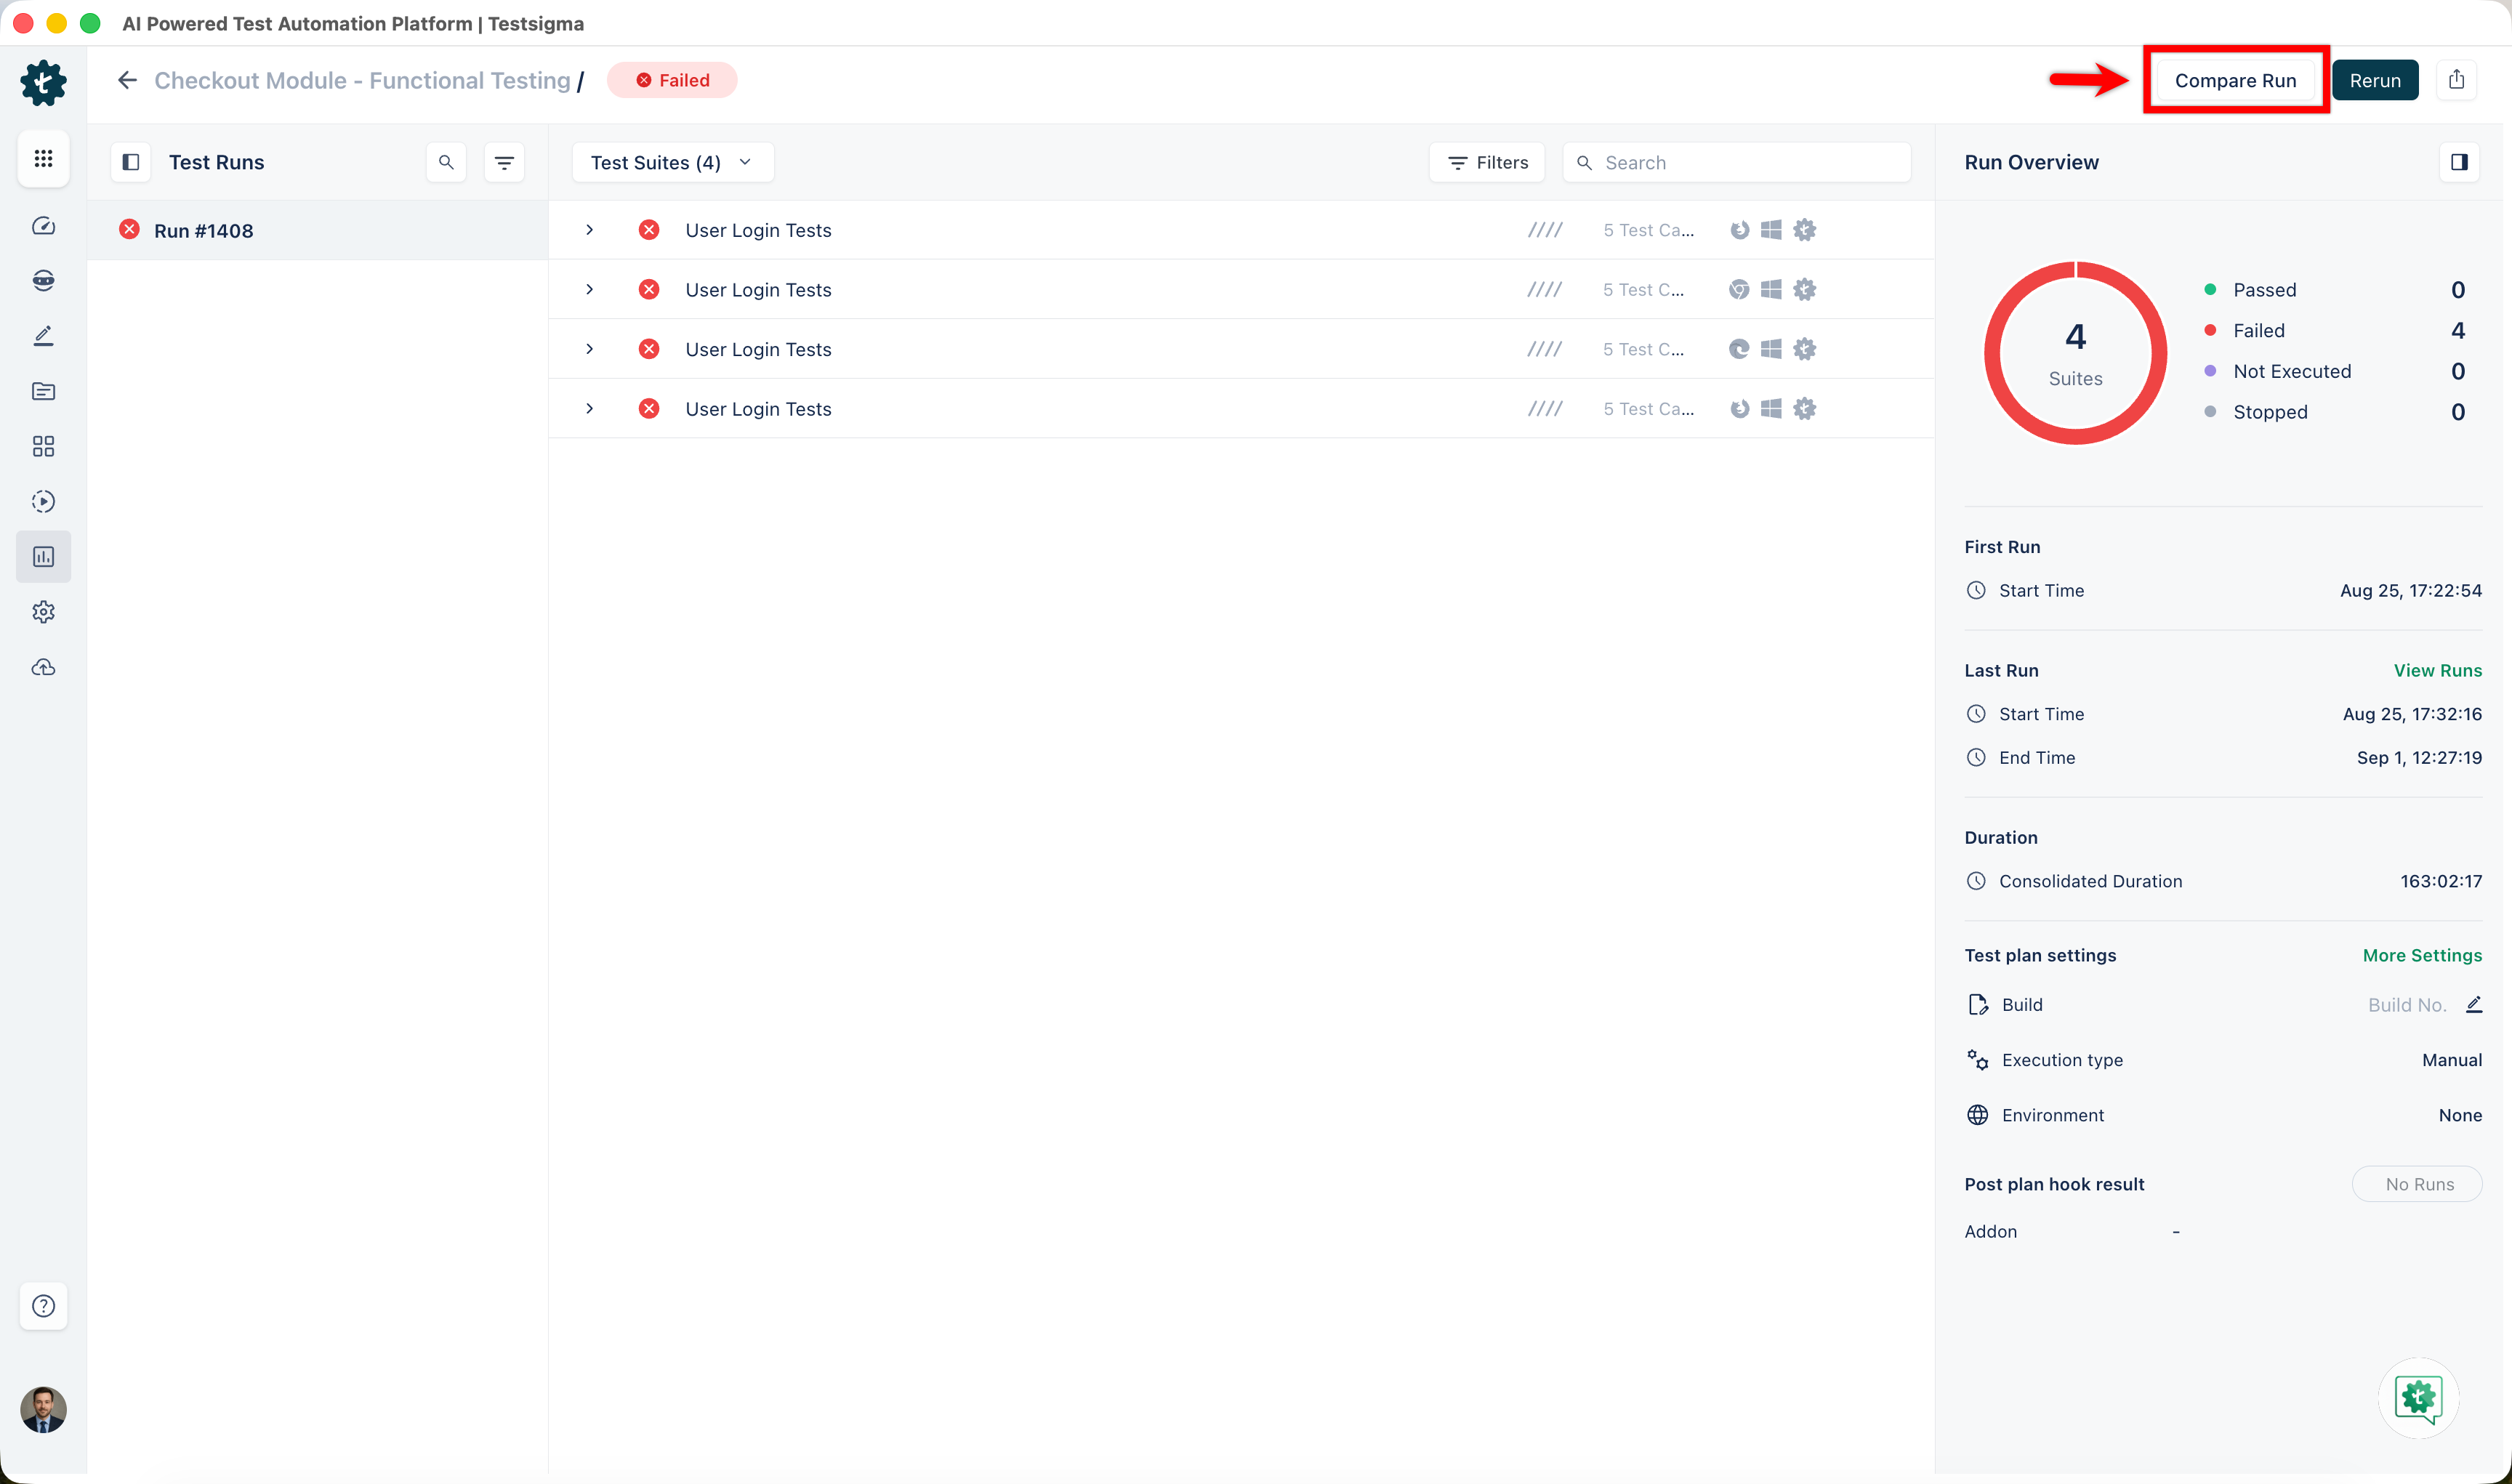
Compare two runs of the same test case side by side.
- On the Test Case Results page, click Compare Runs.
-
Select a run from the list at the top of either panel.
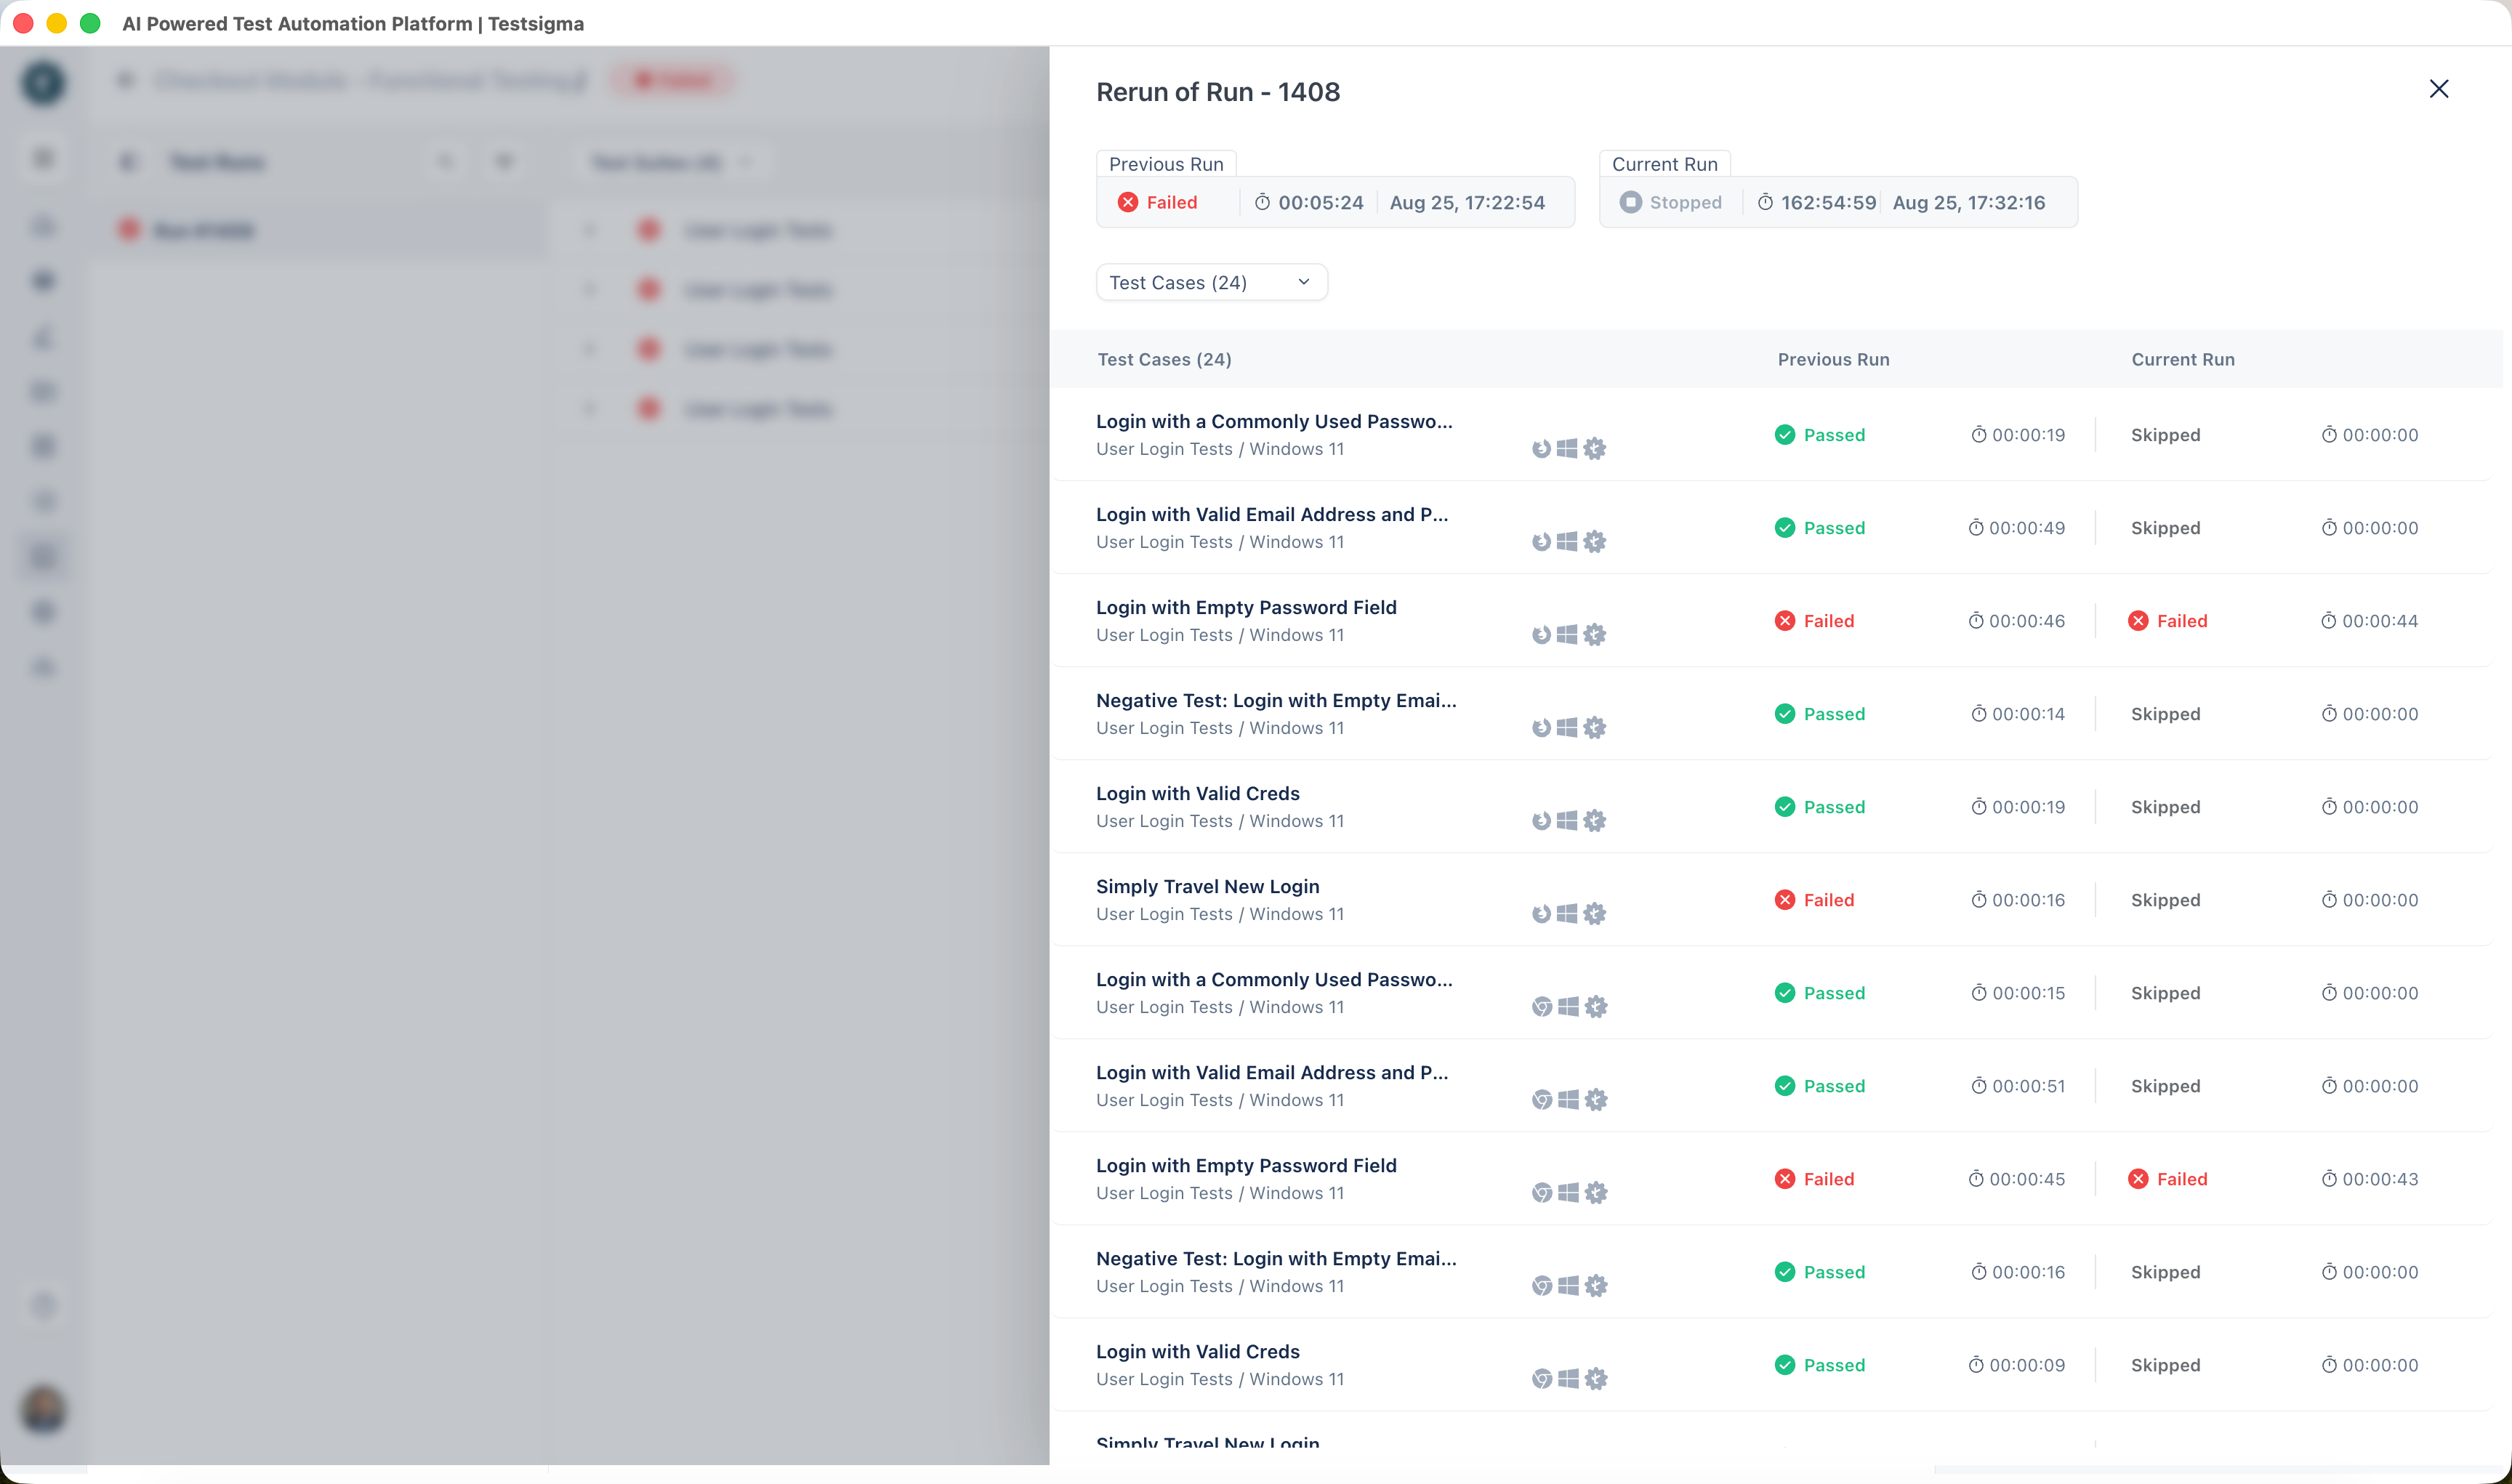
Each panel shows the run's duration, date, step count, and failed count, followed by every step with its own duration.
The run list includes Authoring Run, which holds the values captured when the test case was authored, along with each earlier run identified by its run ID. Every entry shows its run type and its status as Passed, Failed, or Healed, so you can pick the last run that behaved as expected without opening runs one by one.
Compare a Single Step
Compare one step against the same step in another run.
-
In the THIS RUN section of the step, click Compare Steps. The step comparison overlay opens, with the step under comparison in the breadcrumb.
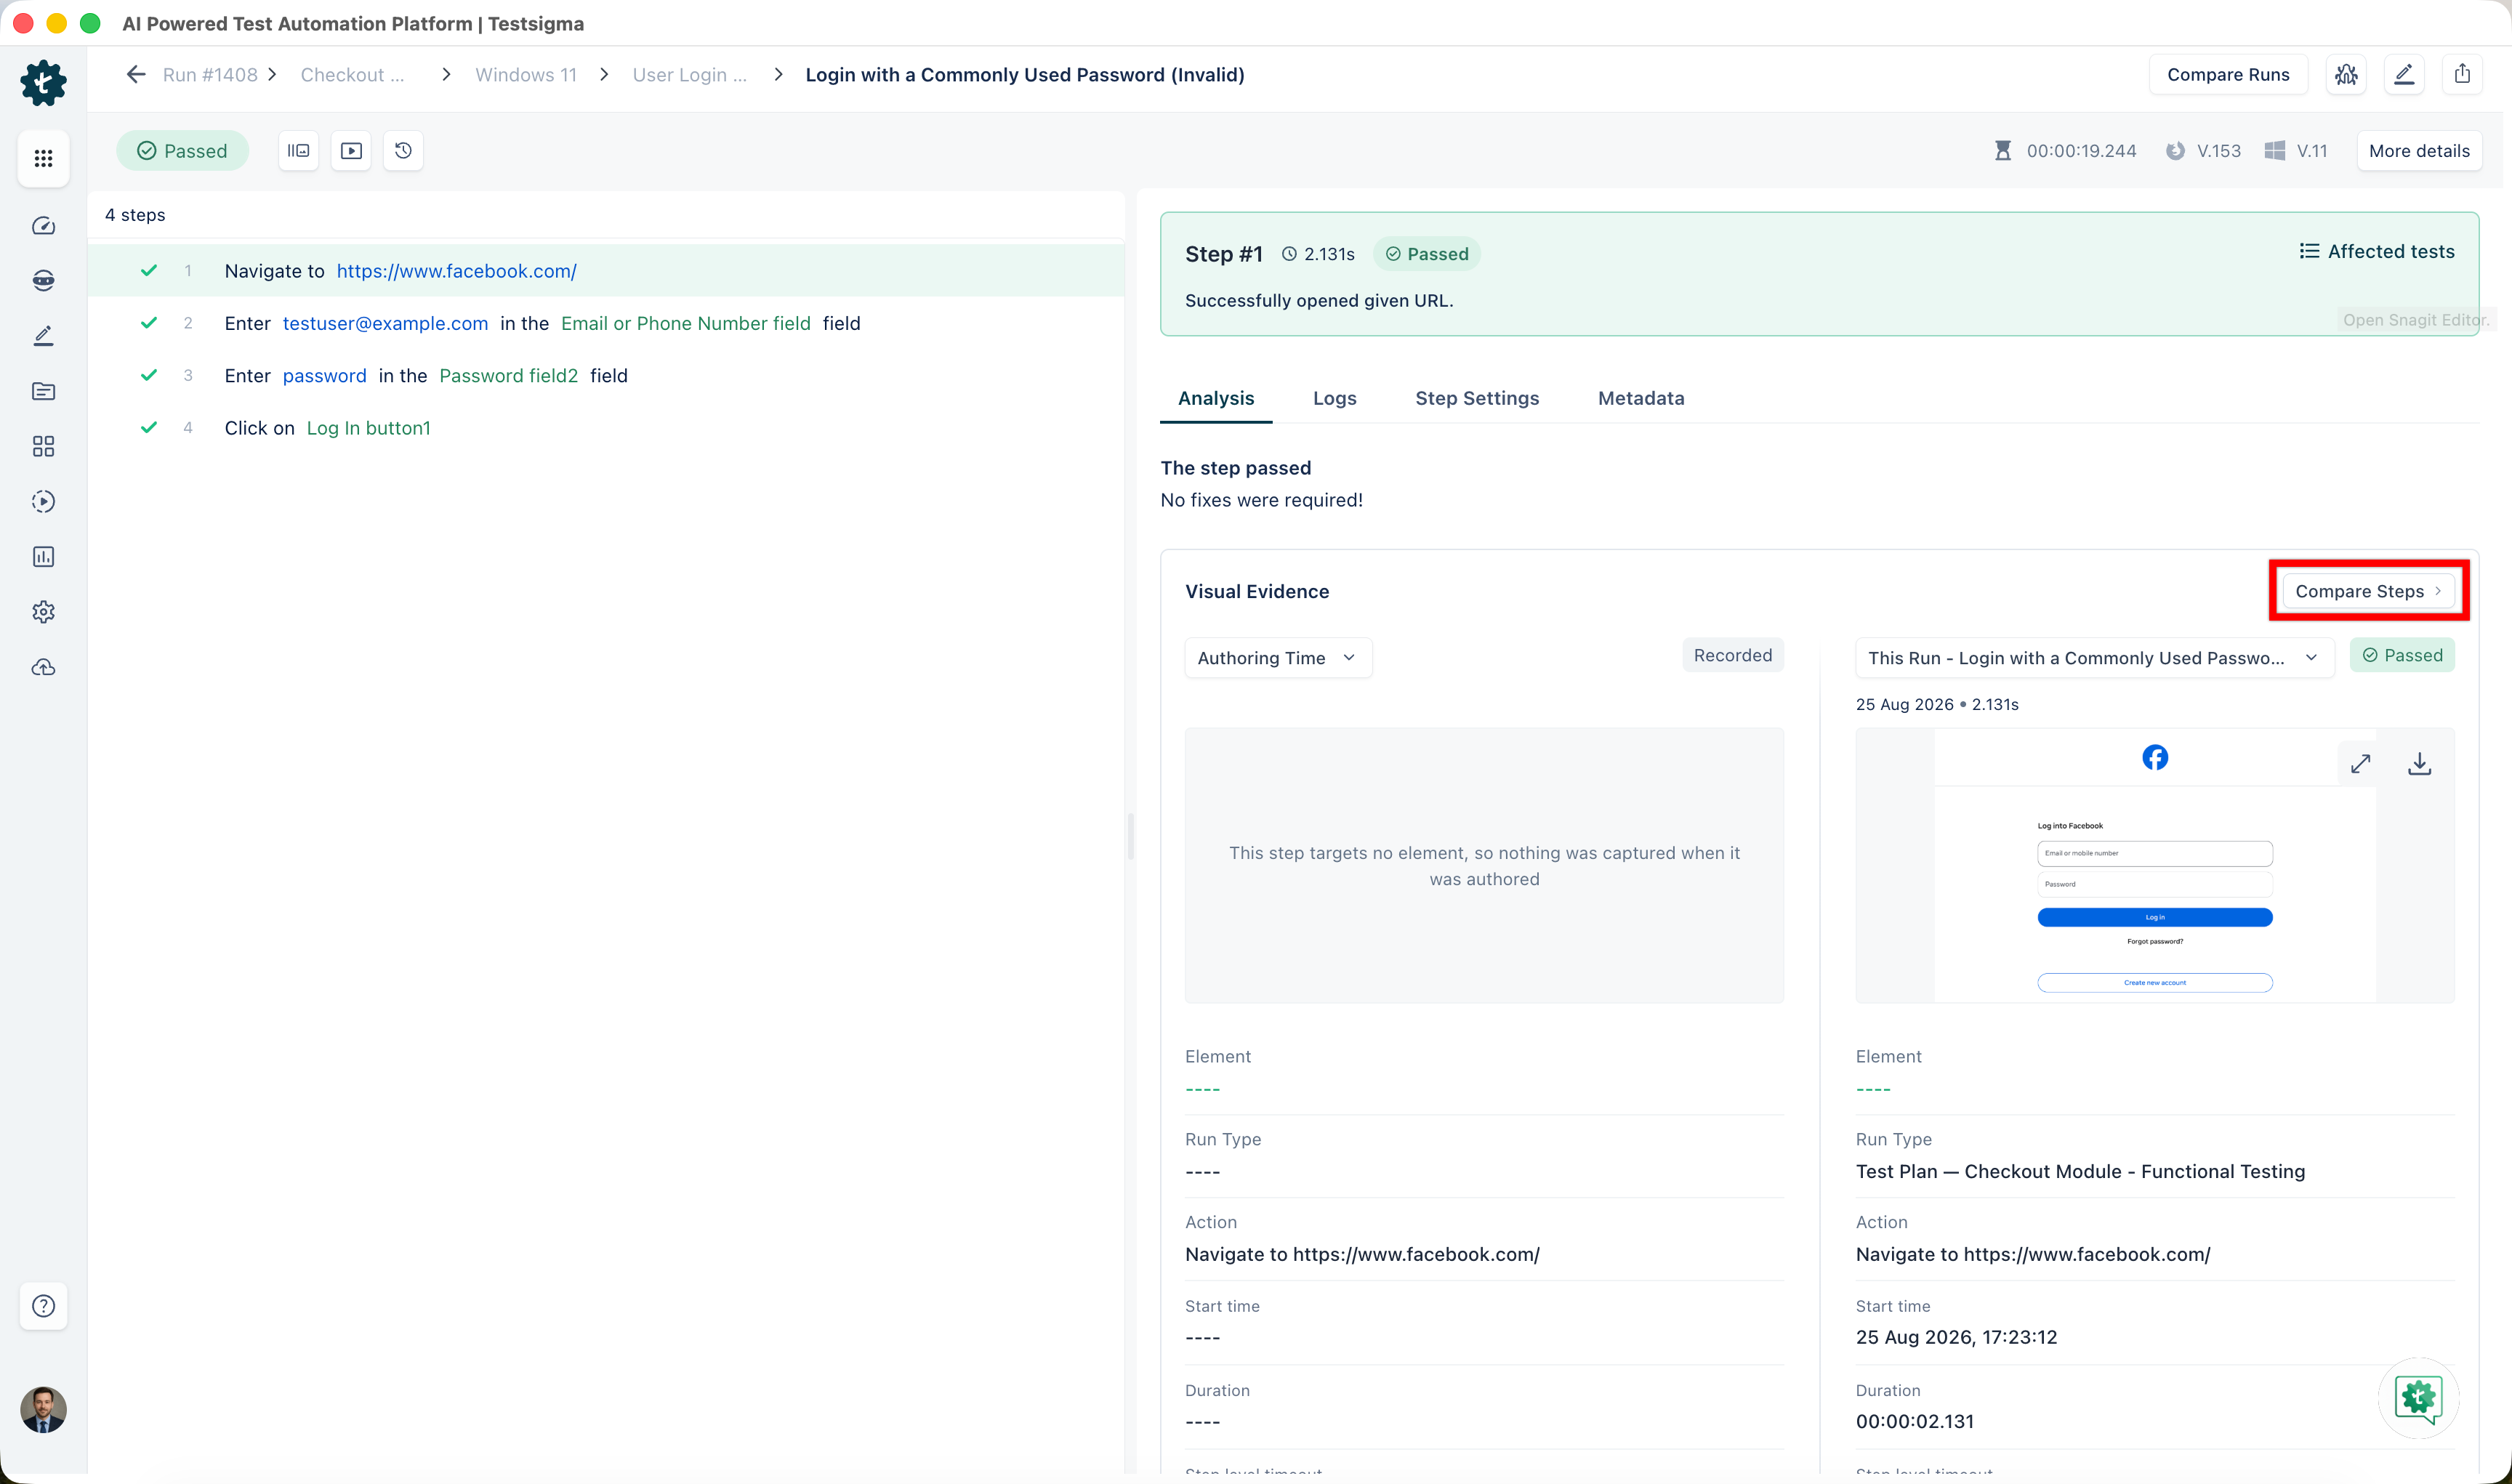
The left panel defaults to Authoring Time, and the right panel shows the current run with its date and time and its status, such as Passed or Healed. To change the comparison, select a different run from the list at the top of either panel.
-
From the View list, select a comparison mode.
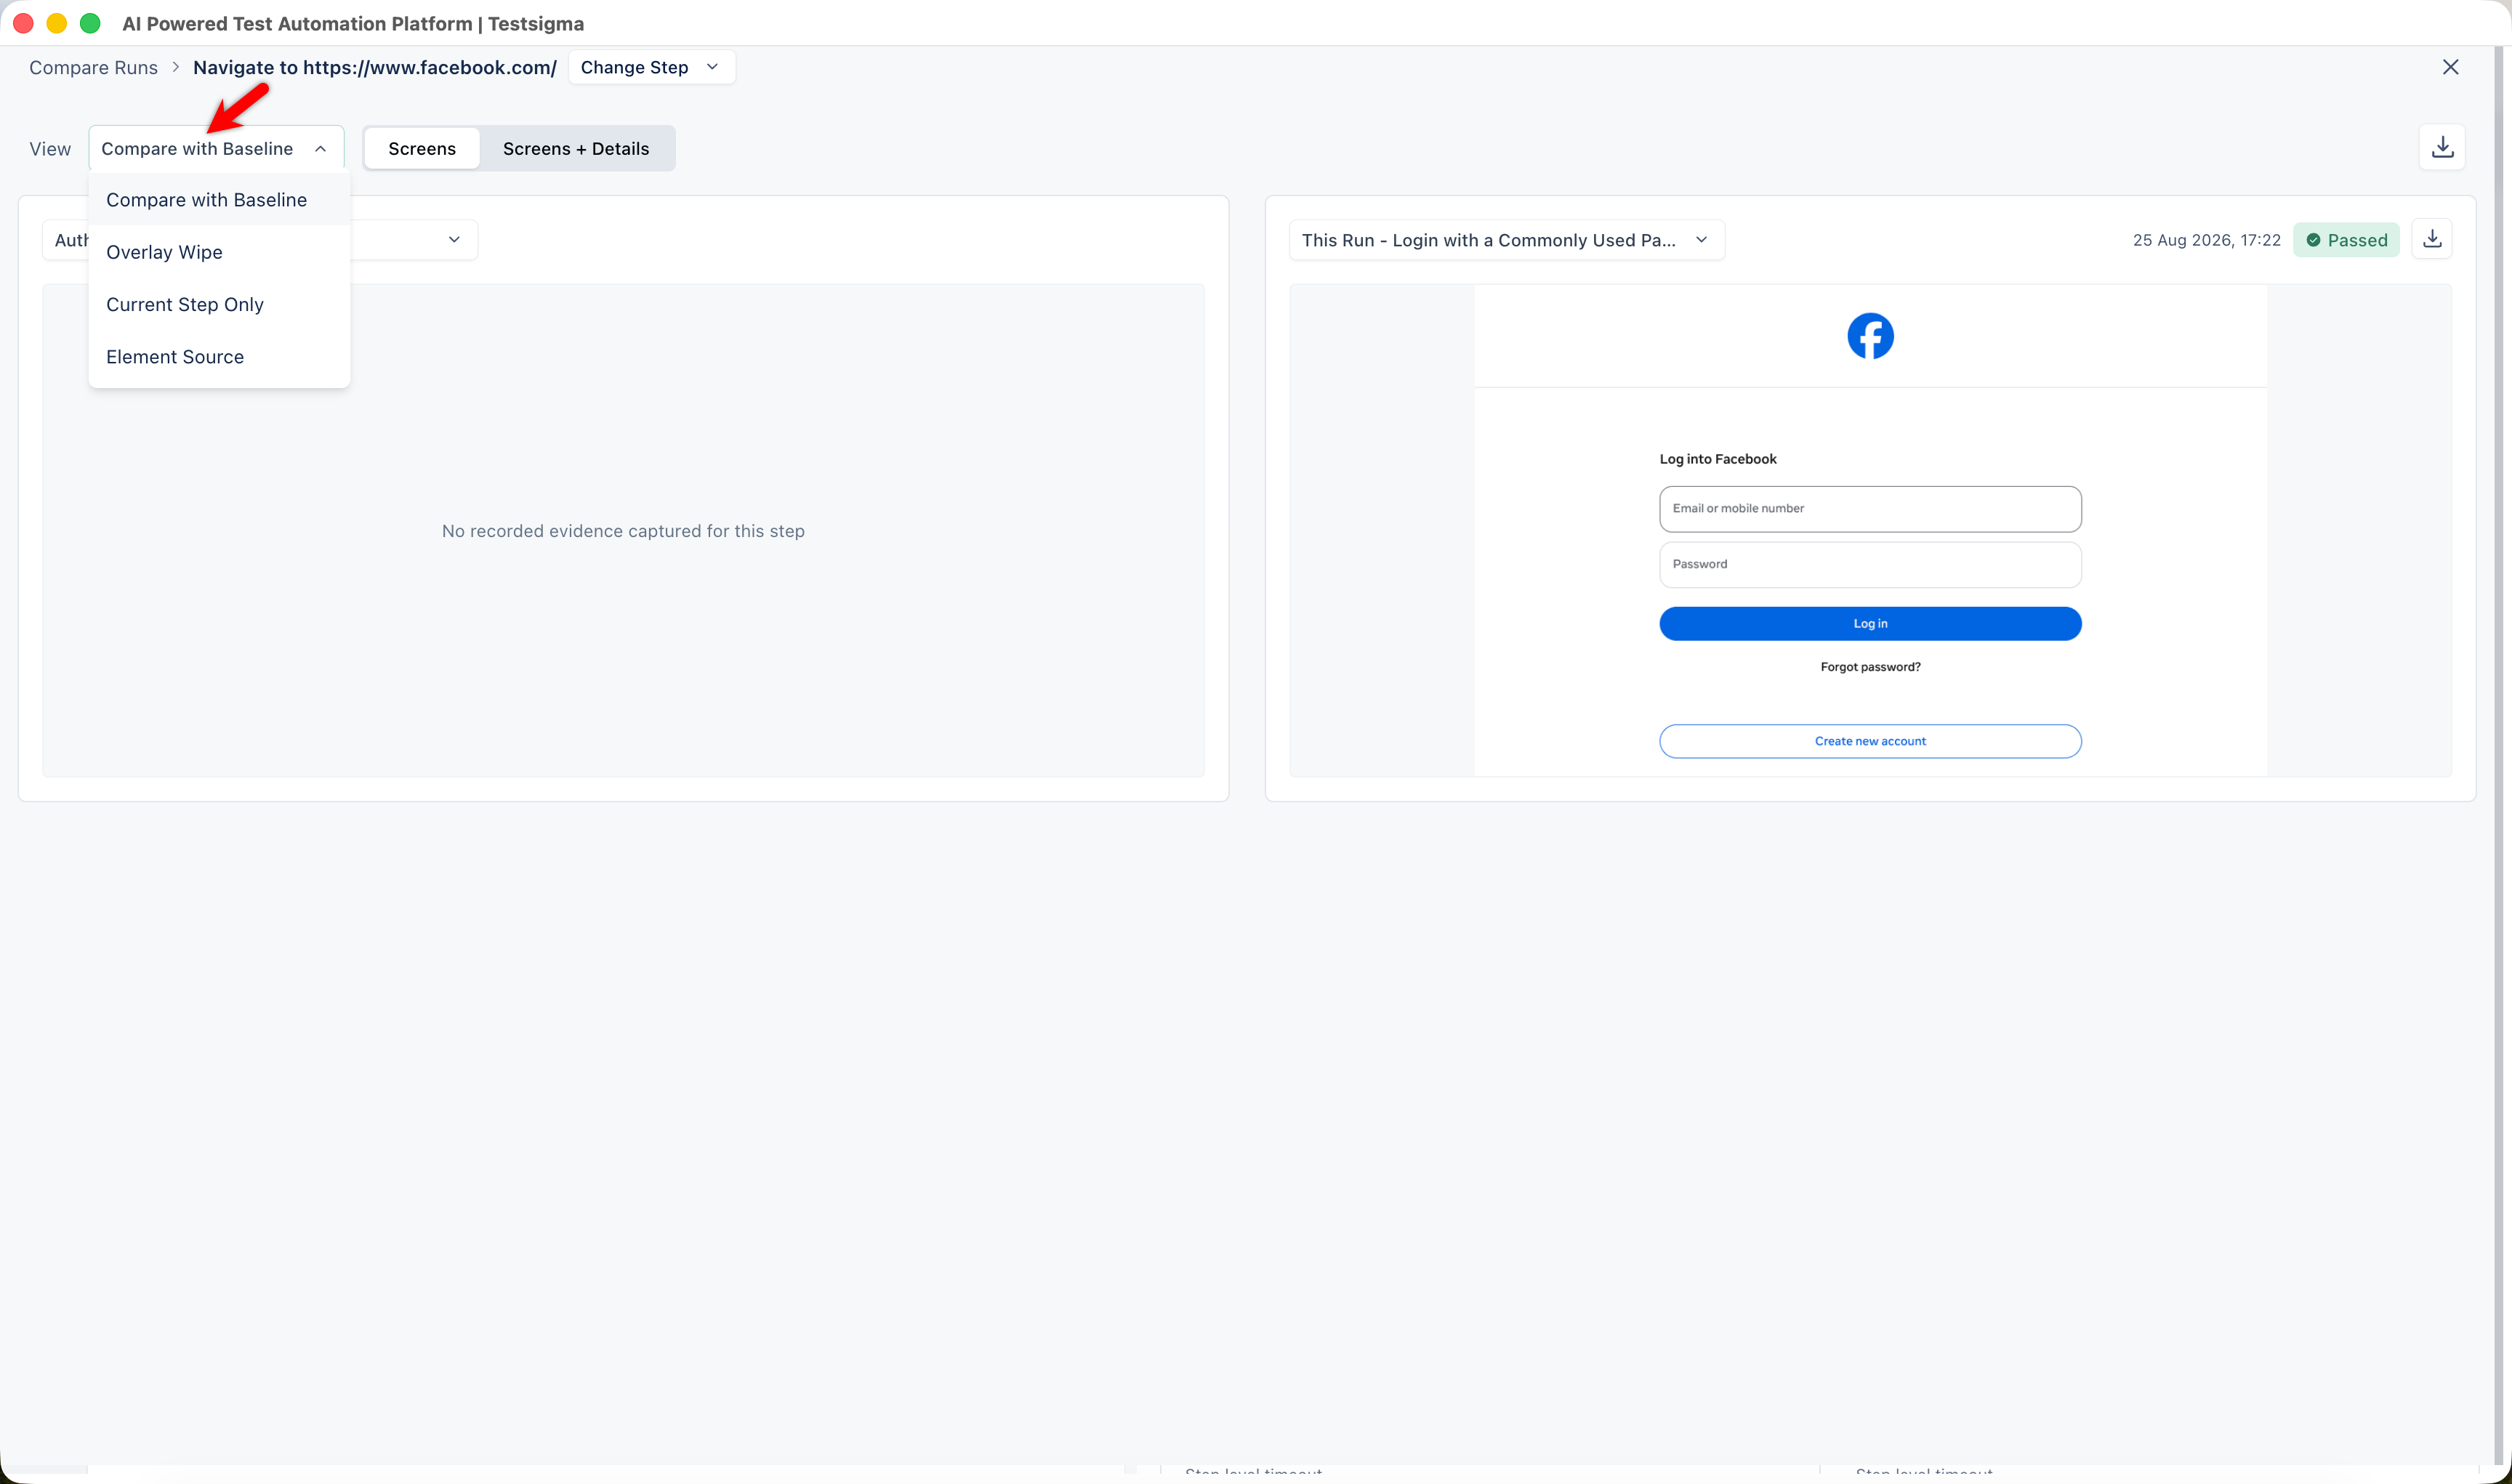
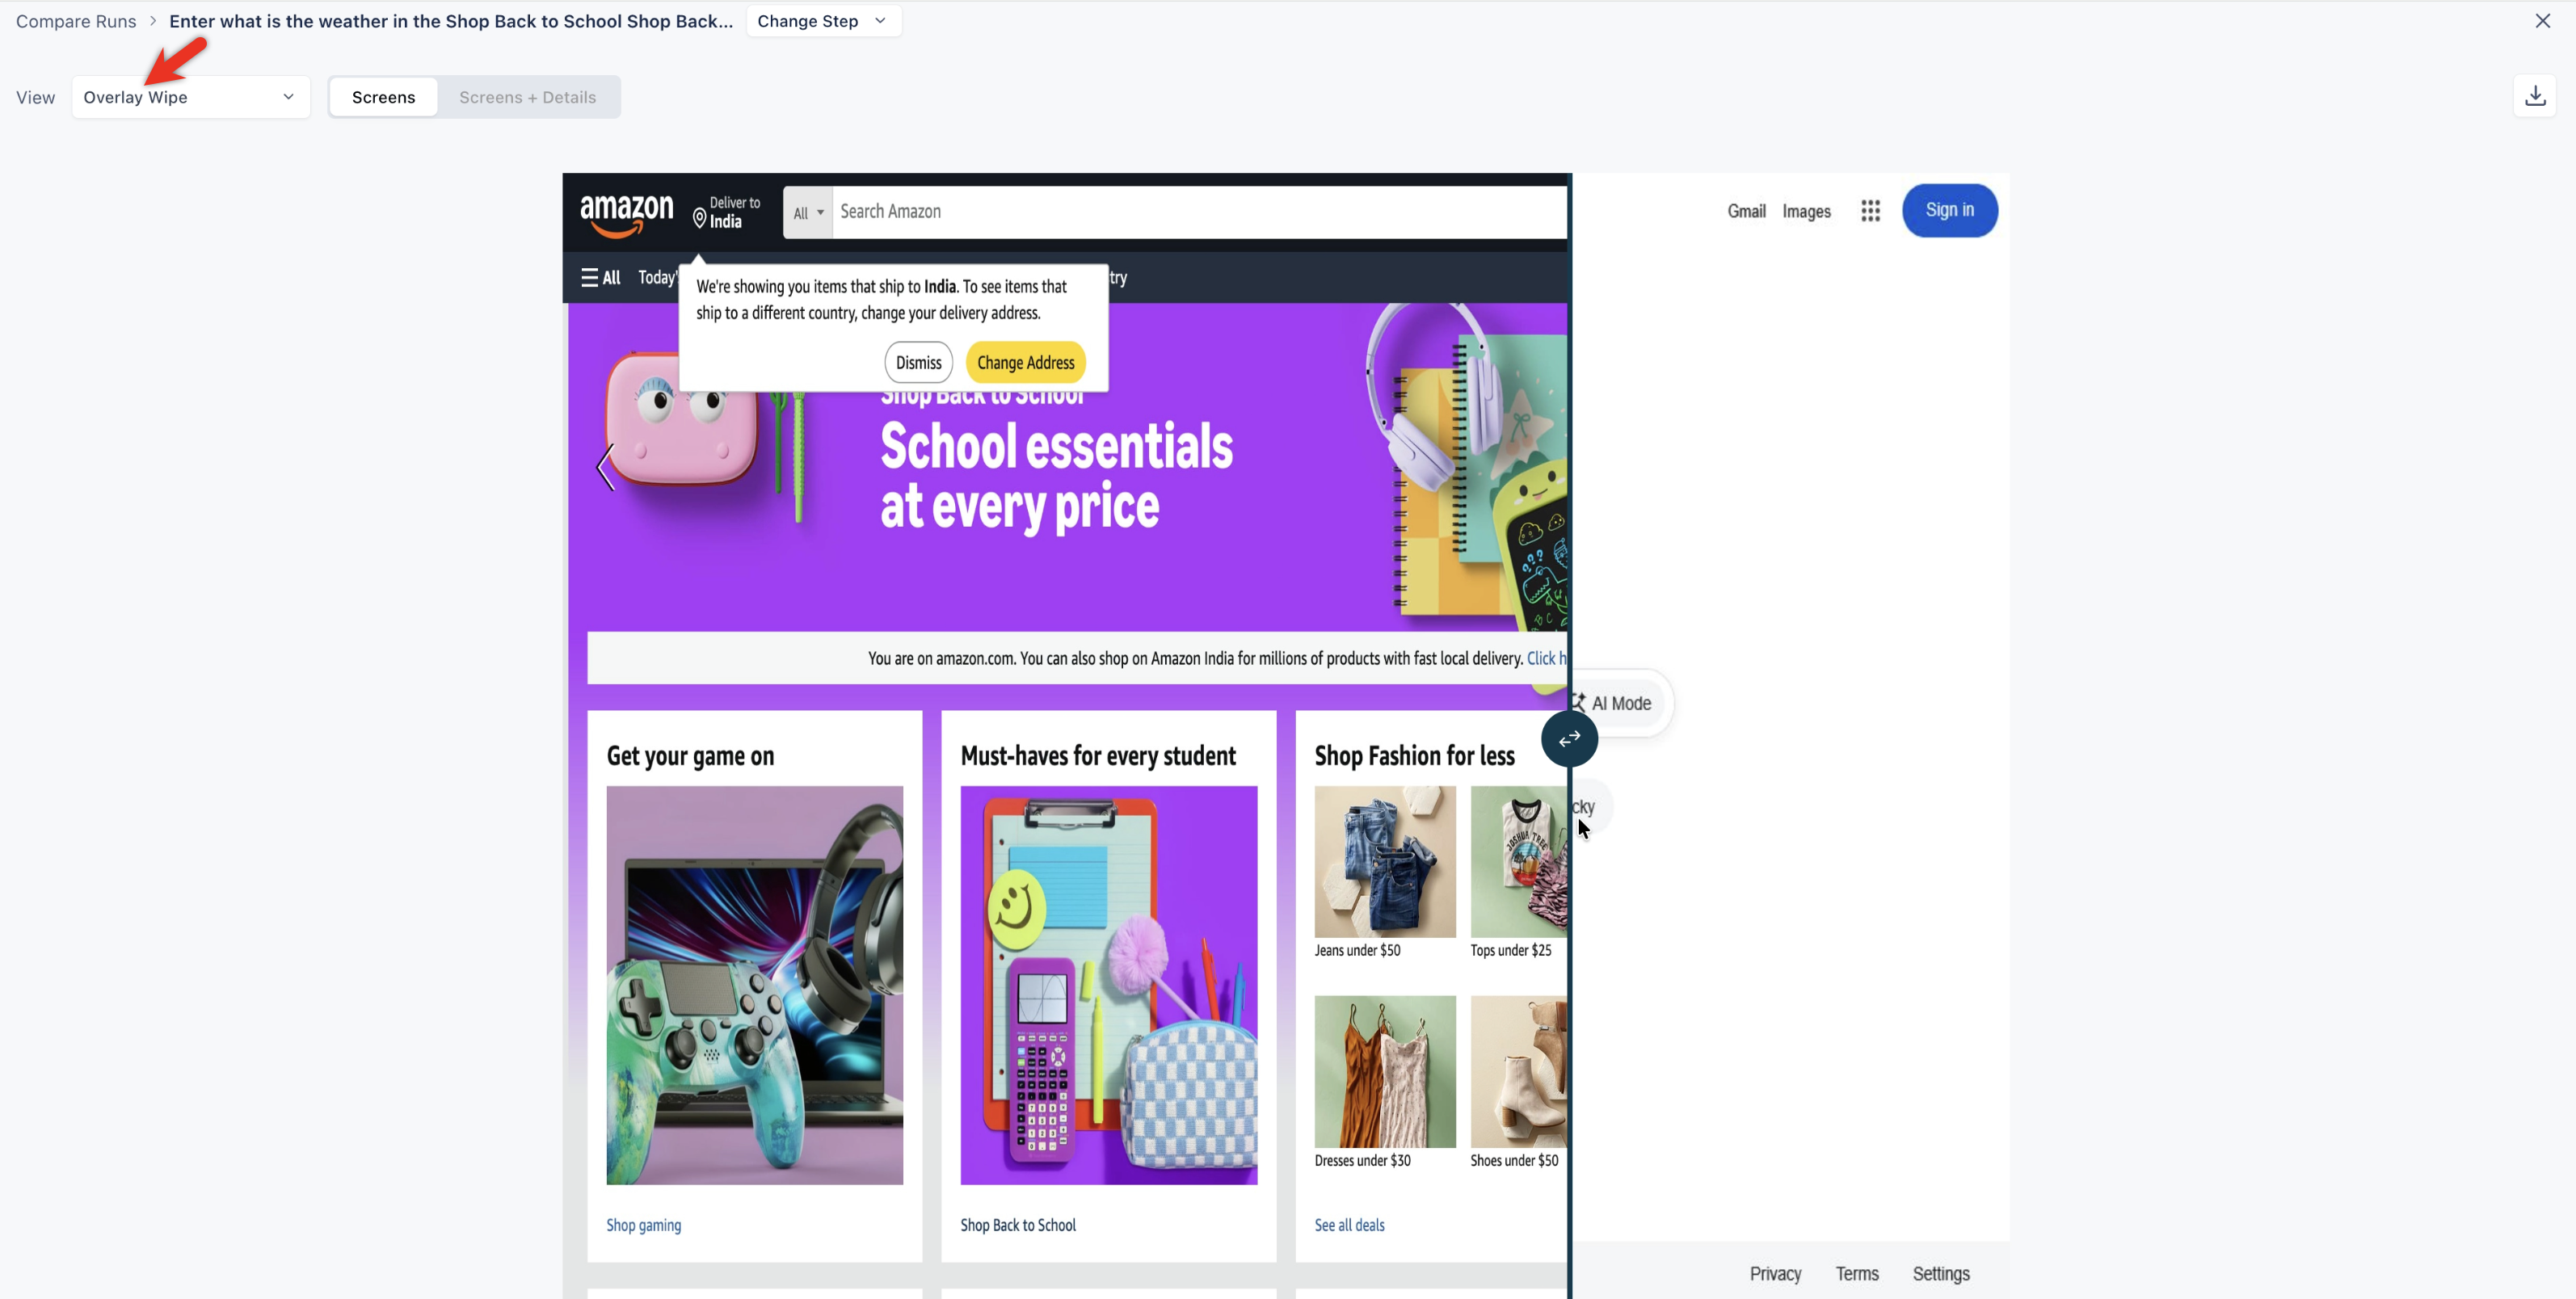
Mode What it shows Compare with Baseline The baseline run and the current run side by side Overlay Wipe Both screenshots in one frame, with a divider to wipe between them Current Step Only The current run's screenshot on its own Element Source A diff of the captured page source across the two runs, alongside the locator value for each In Overlay Wipe, the capture recorded at authoring time and the capture taken during execution load into a single frame separated by a vertical divider. Drag the handle on the divider to wipe between them.
-
Click Screens to compare screenshots only, or Screens + Details to show the step details beneath each screenshot.
Screens + Details lists the run type, start time, duration, step level timeout, plan level timeout, error code, error message, element name, and locator for each run. Where a value was not captured, the field shows a dash.
NOTE:Screens + Details is disabled in Overlay Wipe, because that mode renders a single combined frame rather than two panels.
-
To compare a different step, select a step from the Change Step list.
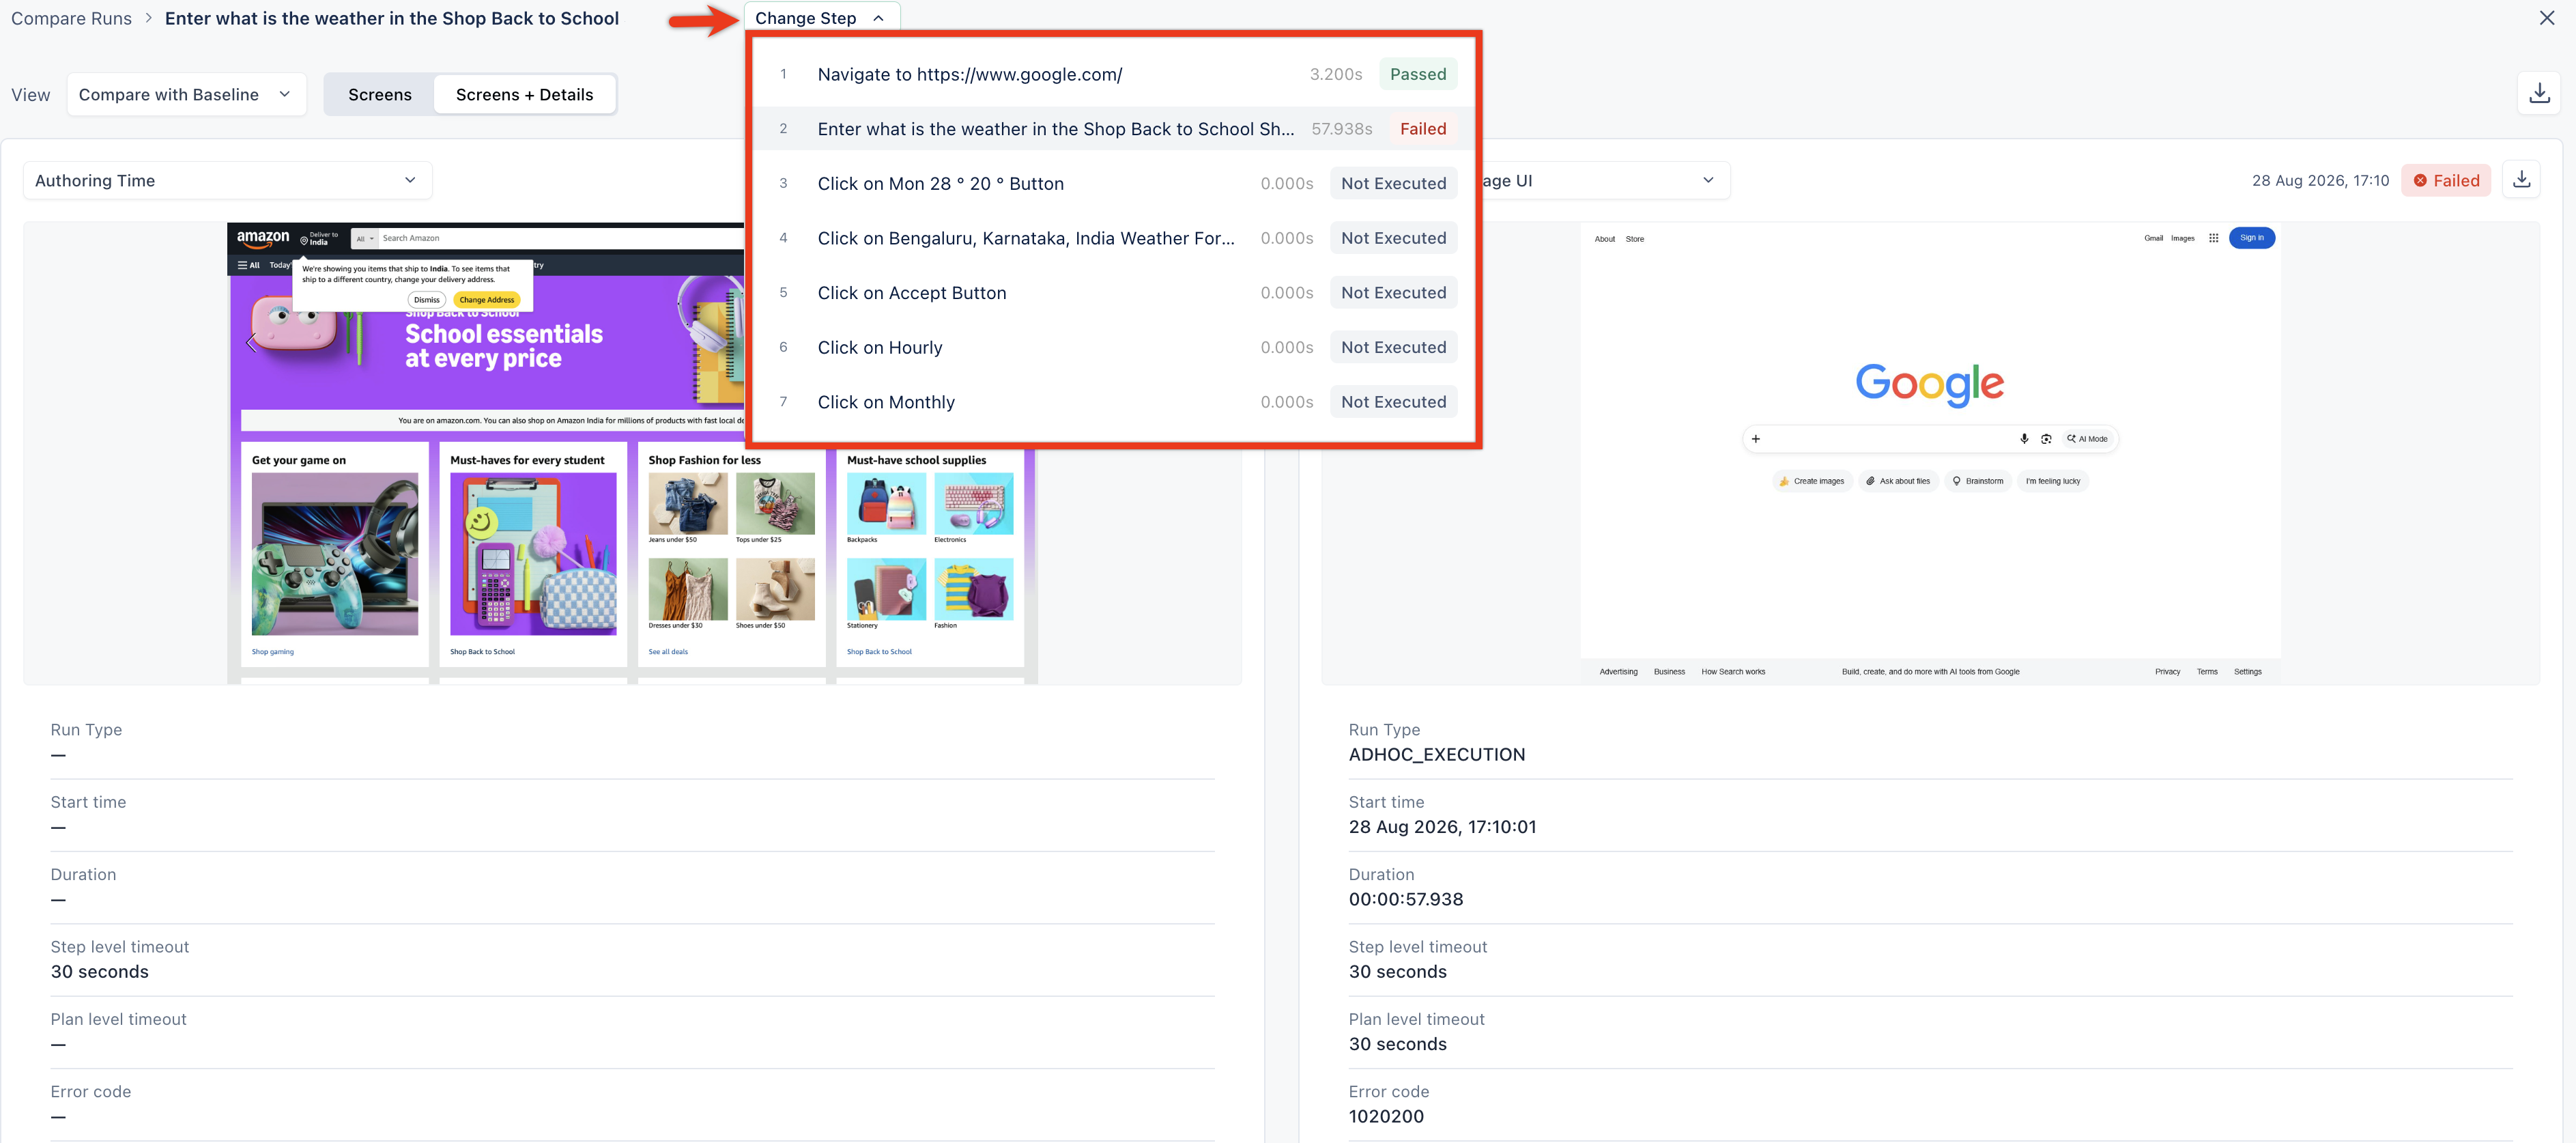
Each entry shows the step number, the step name, its duration, and its status, including Not Executed for steps the run never reached.
- Click the download icon on a panel to save that screenshot, or the download icon at the top right to save the full comparison.
When a step targets no element, the left panel reads "No recorded evidence captured for this step".
Overview of Tests in Run Results
- The Run Overview section of the Run Results page is dynamic and provides a summary of tests at all levels for the selected run.
- This section displays the Last Run, Test Plan Settings, and Accessibility Test Overview.
- Click View Runs to view all runs, More Settings to access additional settings, and View Report to check the Accessibility Testing Report.
Exporting the Test Reports
- Click the Export icon and select the download format from the dropdown menu.
-
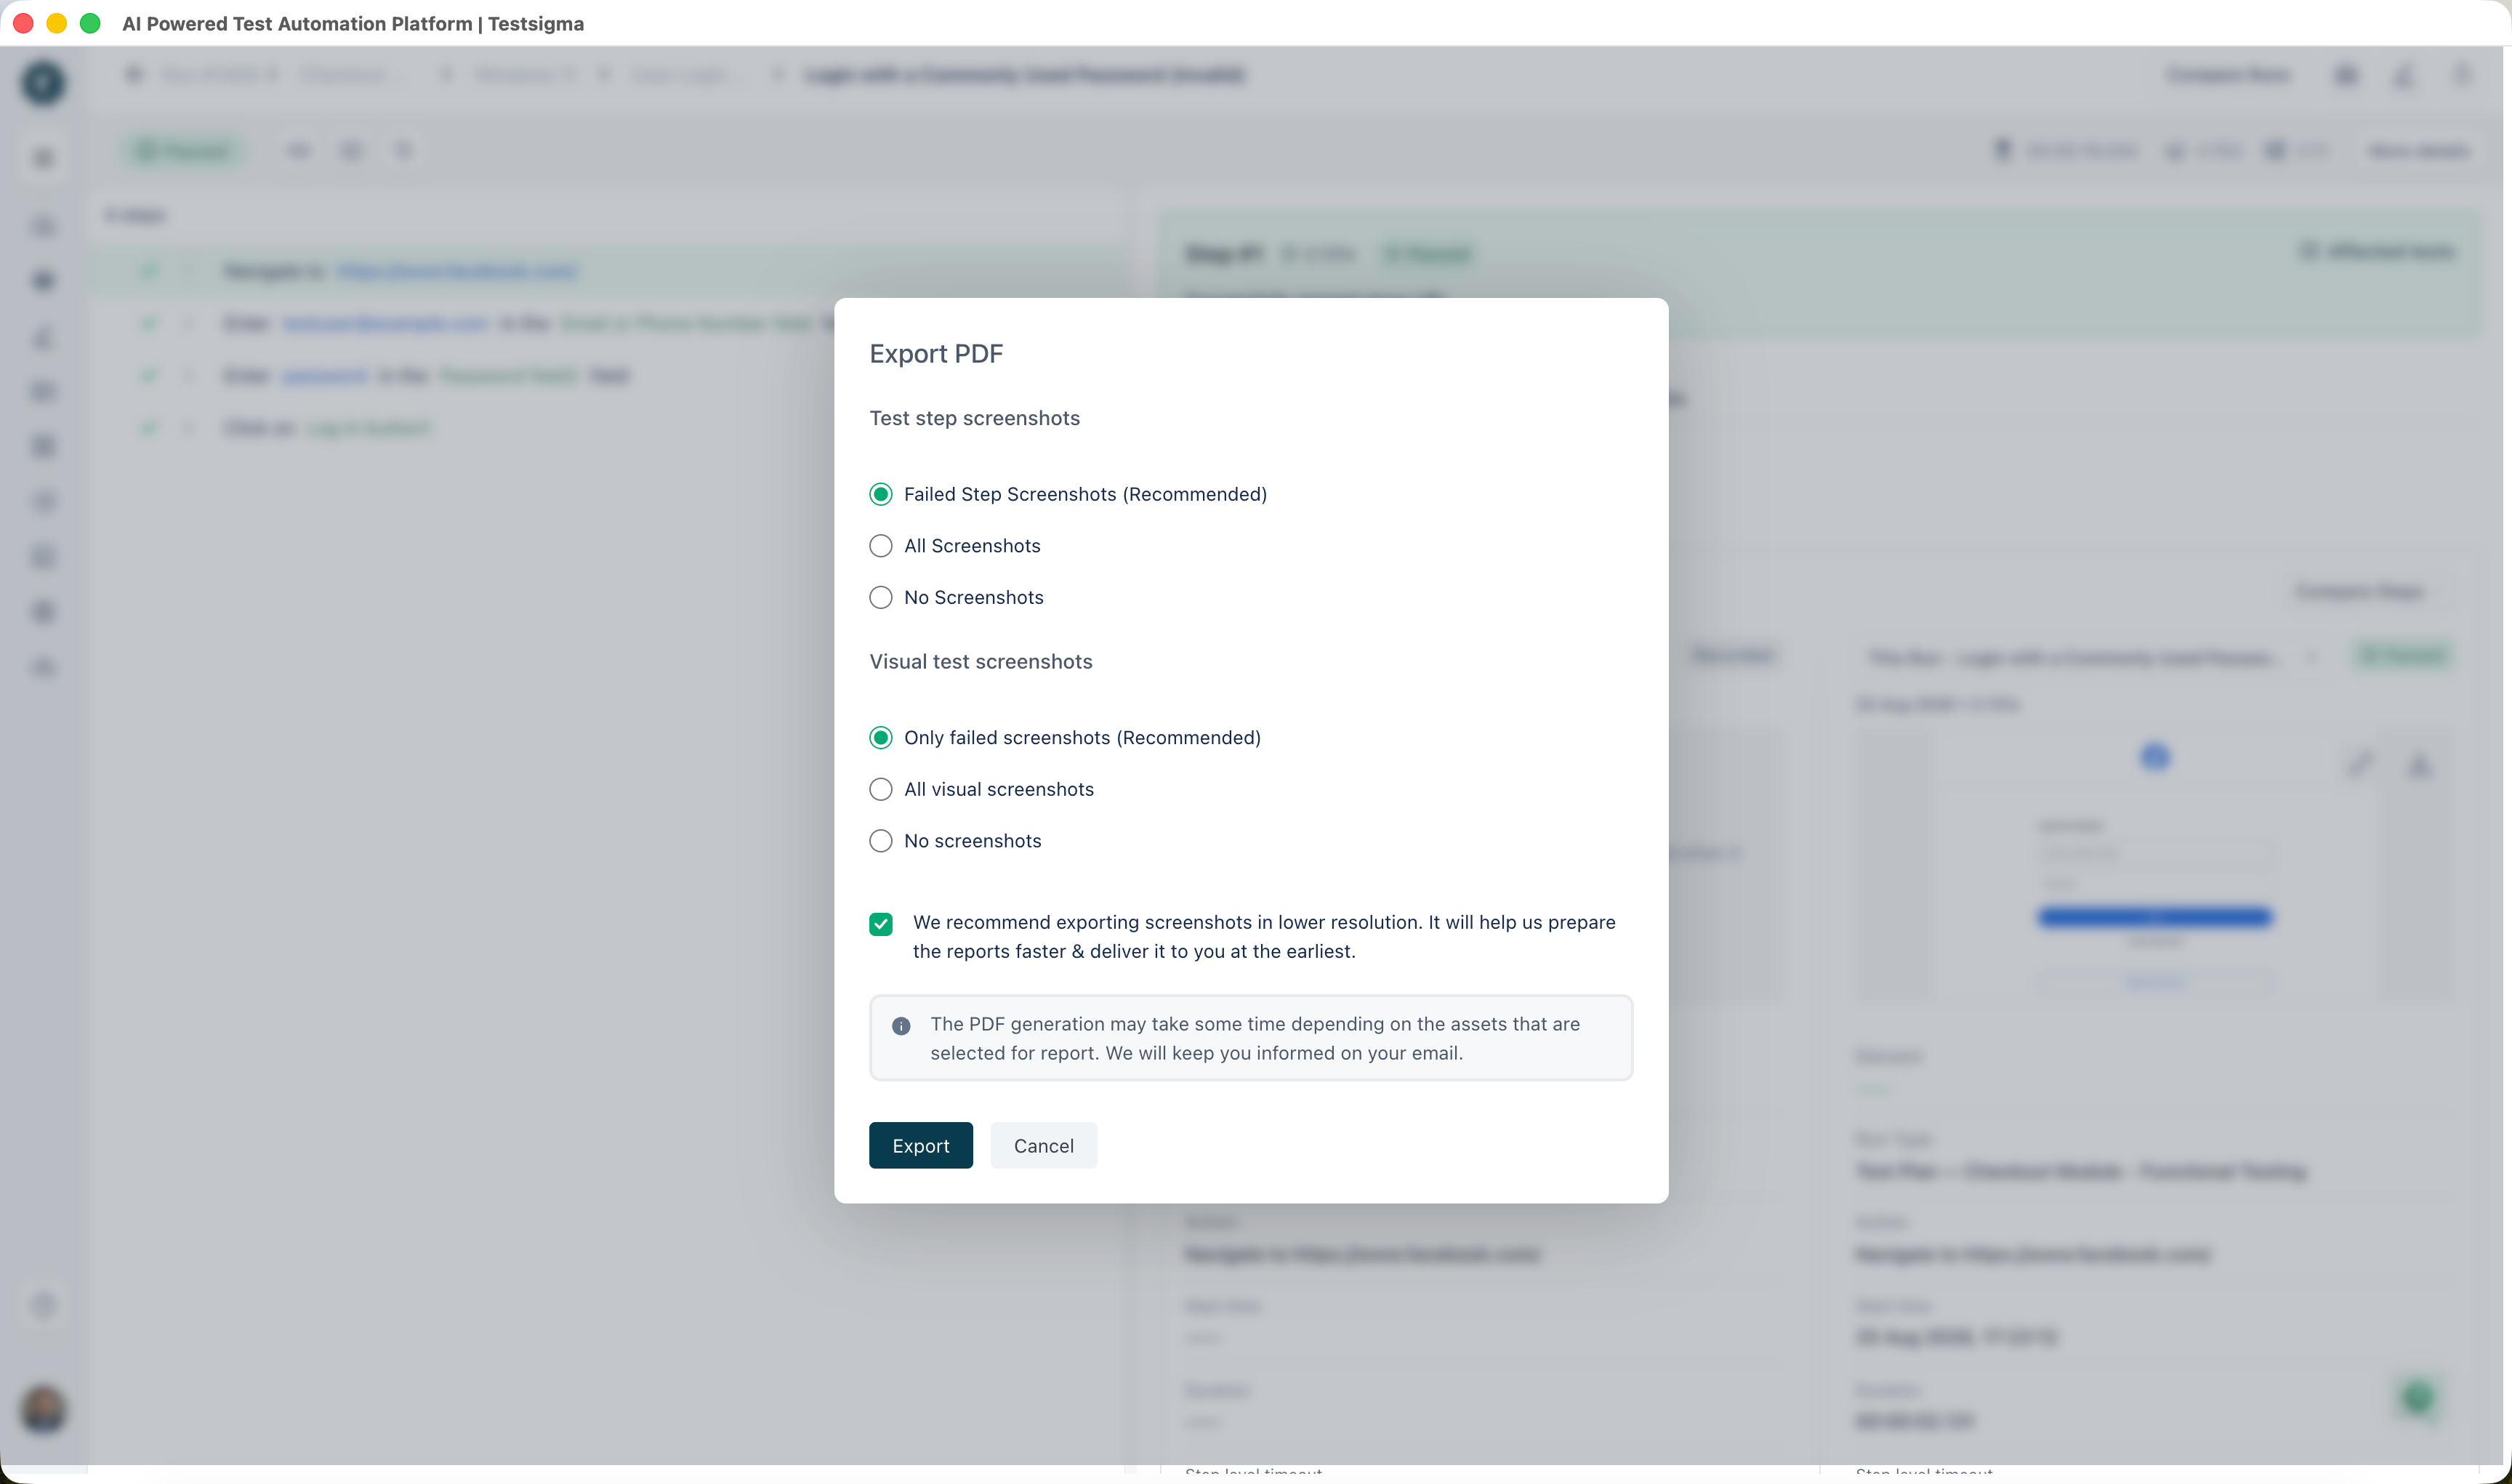
For PDF format, the Export PDF dialog appears. Select the appropriate options and click Export.
- For JUnit format, the report is downloaded instantly as an XML file.
- For XLSX format, a download link to the report is sent to your email.
Available Shortcuts in Run Results
For Mac:
- Option + C: View results at the test case level
- Option + S: View results at the test suite level
- Option + M: View results at the test machine level
- Option + H: Open/close run history
- Option + F: Open filters
- Option + O: Open/close run overview
For Windows:
- Alt + C: View results at the test case level
- Alt + S: View results at the test suite level
- Alt + M: View results at the test machine level
- Alt + H: Open/close run history
- Alt + F: Open filters
- Alt + O: Open/close run overview
How Run Results Handle Renamed and Deleted Items
The Run Results page shows the values as they were when the run executed. Renaming or deleting a test plan, test suite, test case, environment, test machine, or test data profile doesn't change what an earlier run displays.
Runs that executed before this release fall back to the current name of each item, and show a hyphen (-) where the item has since been deleted.

Want to contribute or report missing content?