- desired capabilities
 Most Common Desired Capabilities
- Browser Console Debug Logs
- Geolocation Emulation
- Bypass Unsafe Download Prompt
- Geolocation for Chrome & Firefox
- Custom User Profile in Chrome
- Emulate Mobile Devices (Chrome)
- Add Chrome Extension
- Network Throttling
- Network Logs
- Biometric Authentication
- Enable App Resigning in iOS
- Enable Capturing Screenshots (Android & iOS)
- Configure Android WebViews
- Incognito/Private mode
- Set Google Play Store Credentials
- Basic Authentication [Safari]
Network Logs
Testsigma allows you to capture and analyse network traffic during test execution with its network log feature. Enabling the network log provides valuable insights into the interactions between your application and the server, helping you debug issues related to network requests and responses.
This documentation will guide you on how to enable the network log in Test Case and Test Plan, access, view the status, and download network logs in the ad-hoc run page and the run test case page.
Prerequisites
Before you begin, ensure that you have referred to:
By default, Network Log is enabled for Web and Mobile Web applications, but for Android and iOS applications, you need to enable it manually.
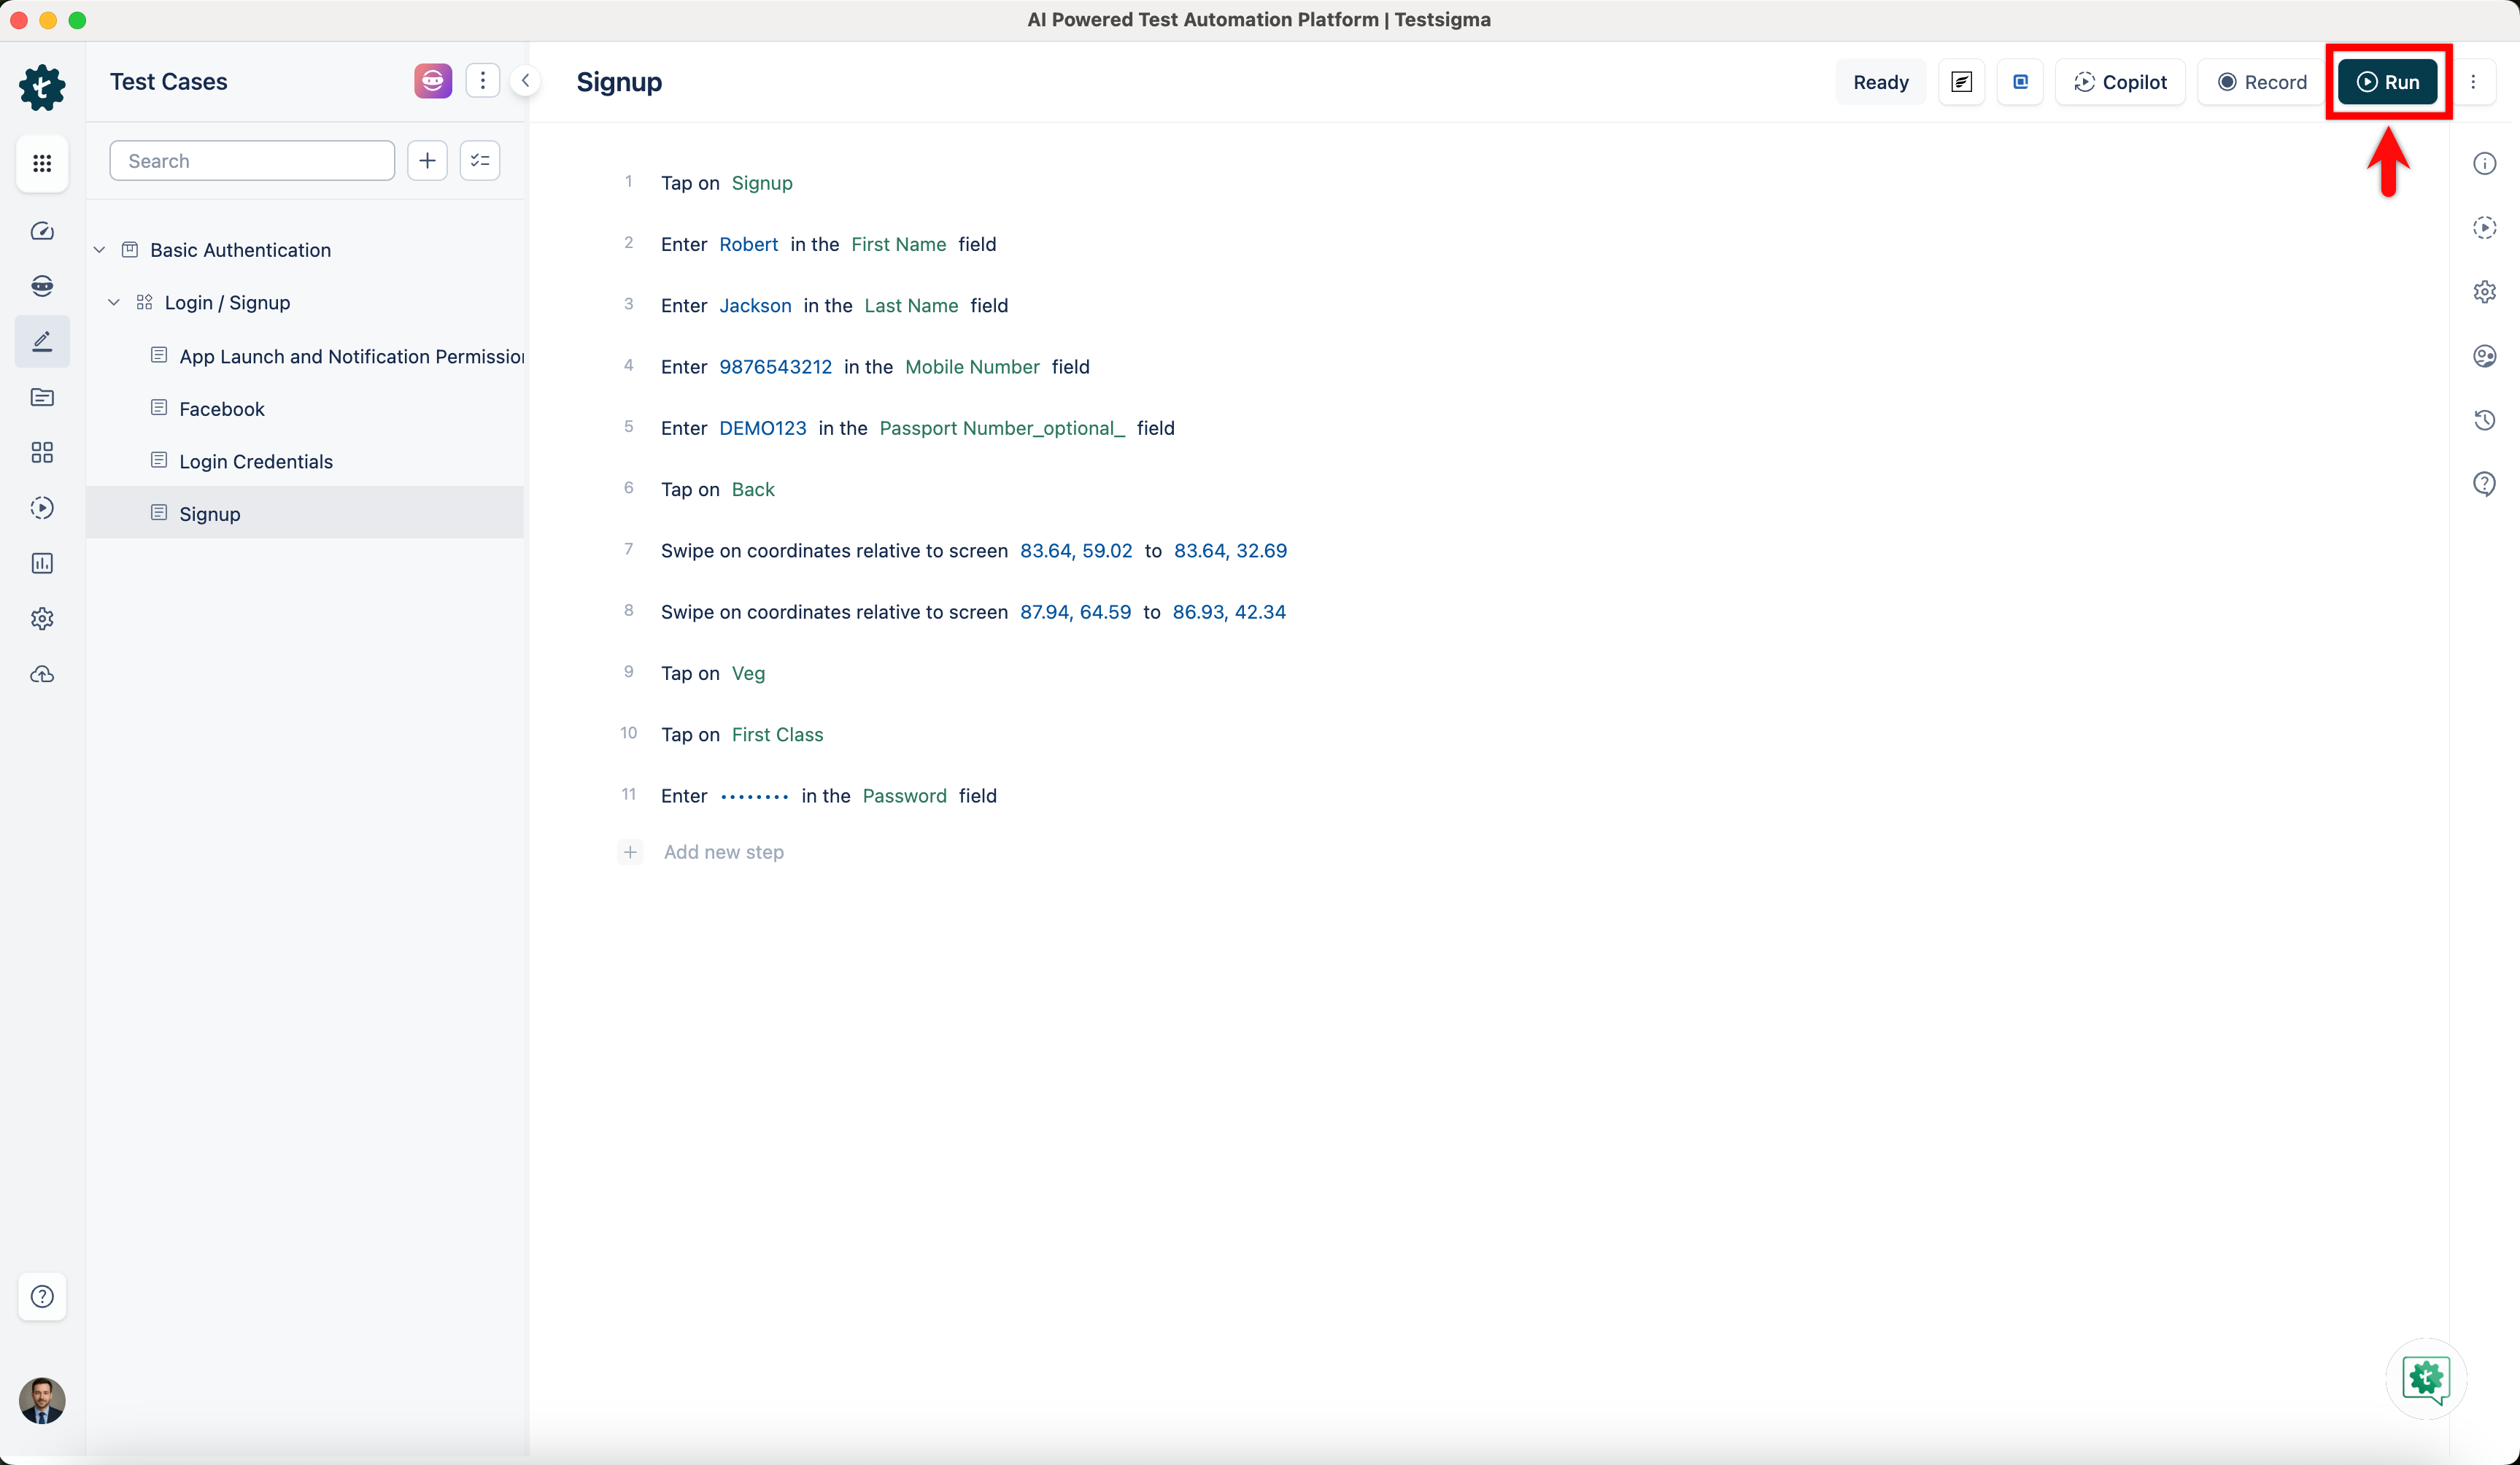
Enable Network Logs in Test Case
- Click Run at the top-right corner of the Test Case details page.
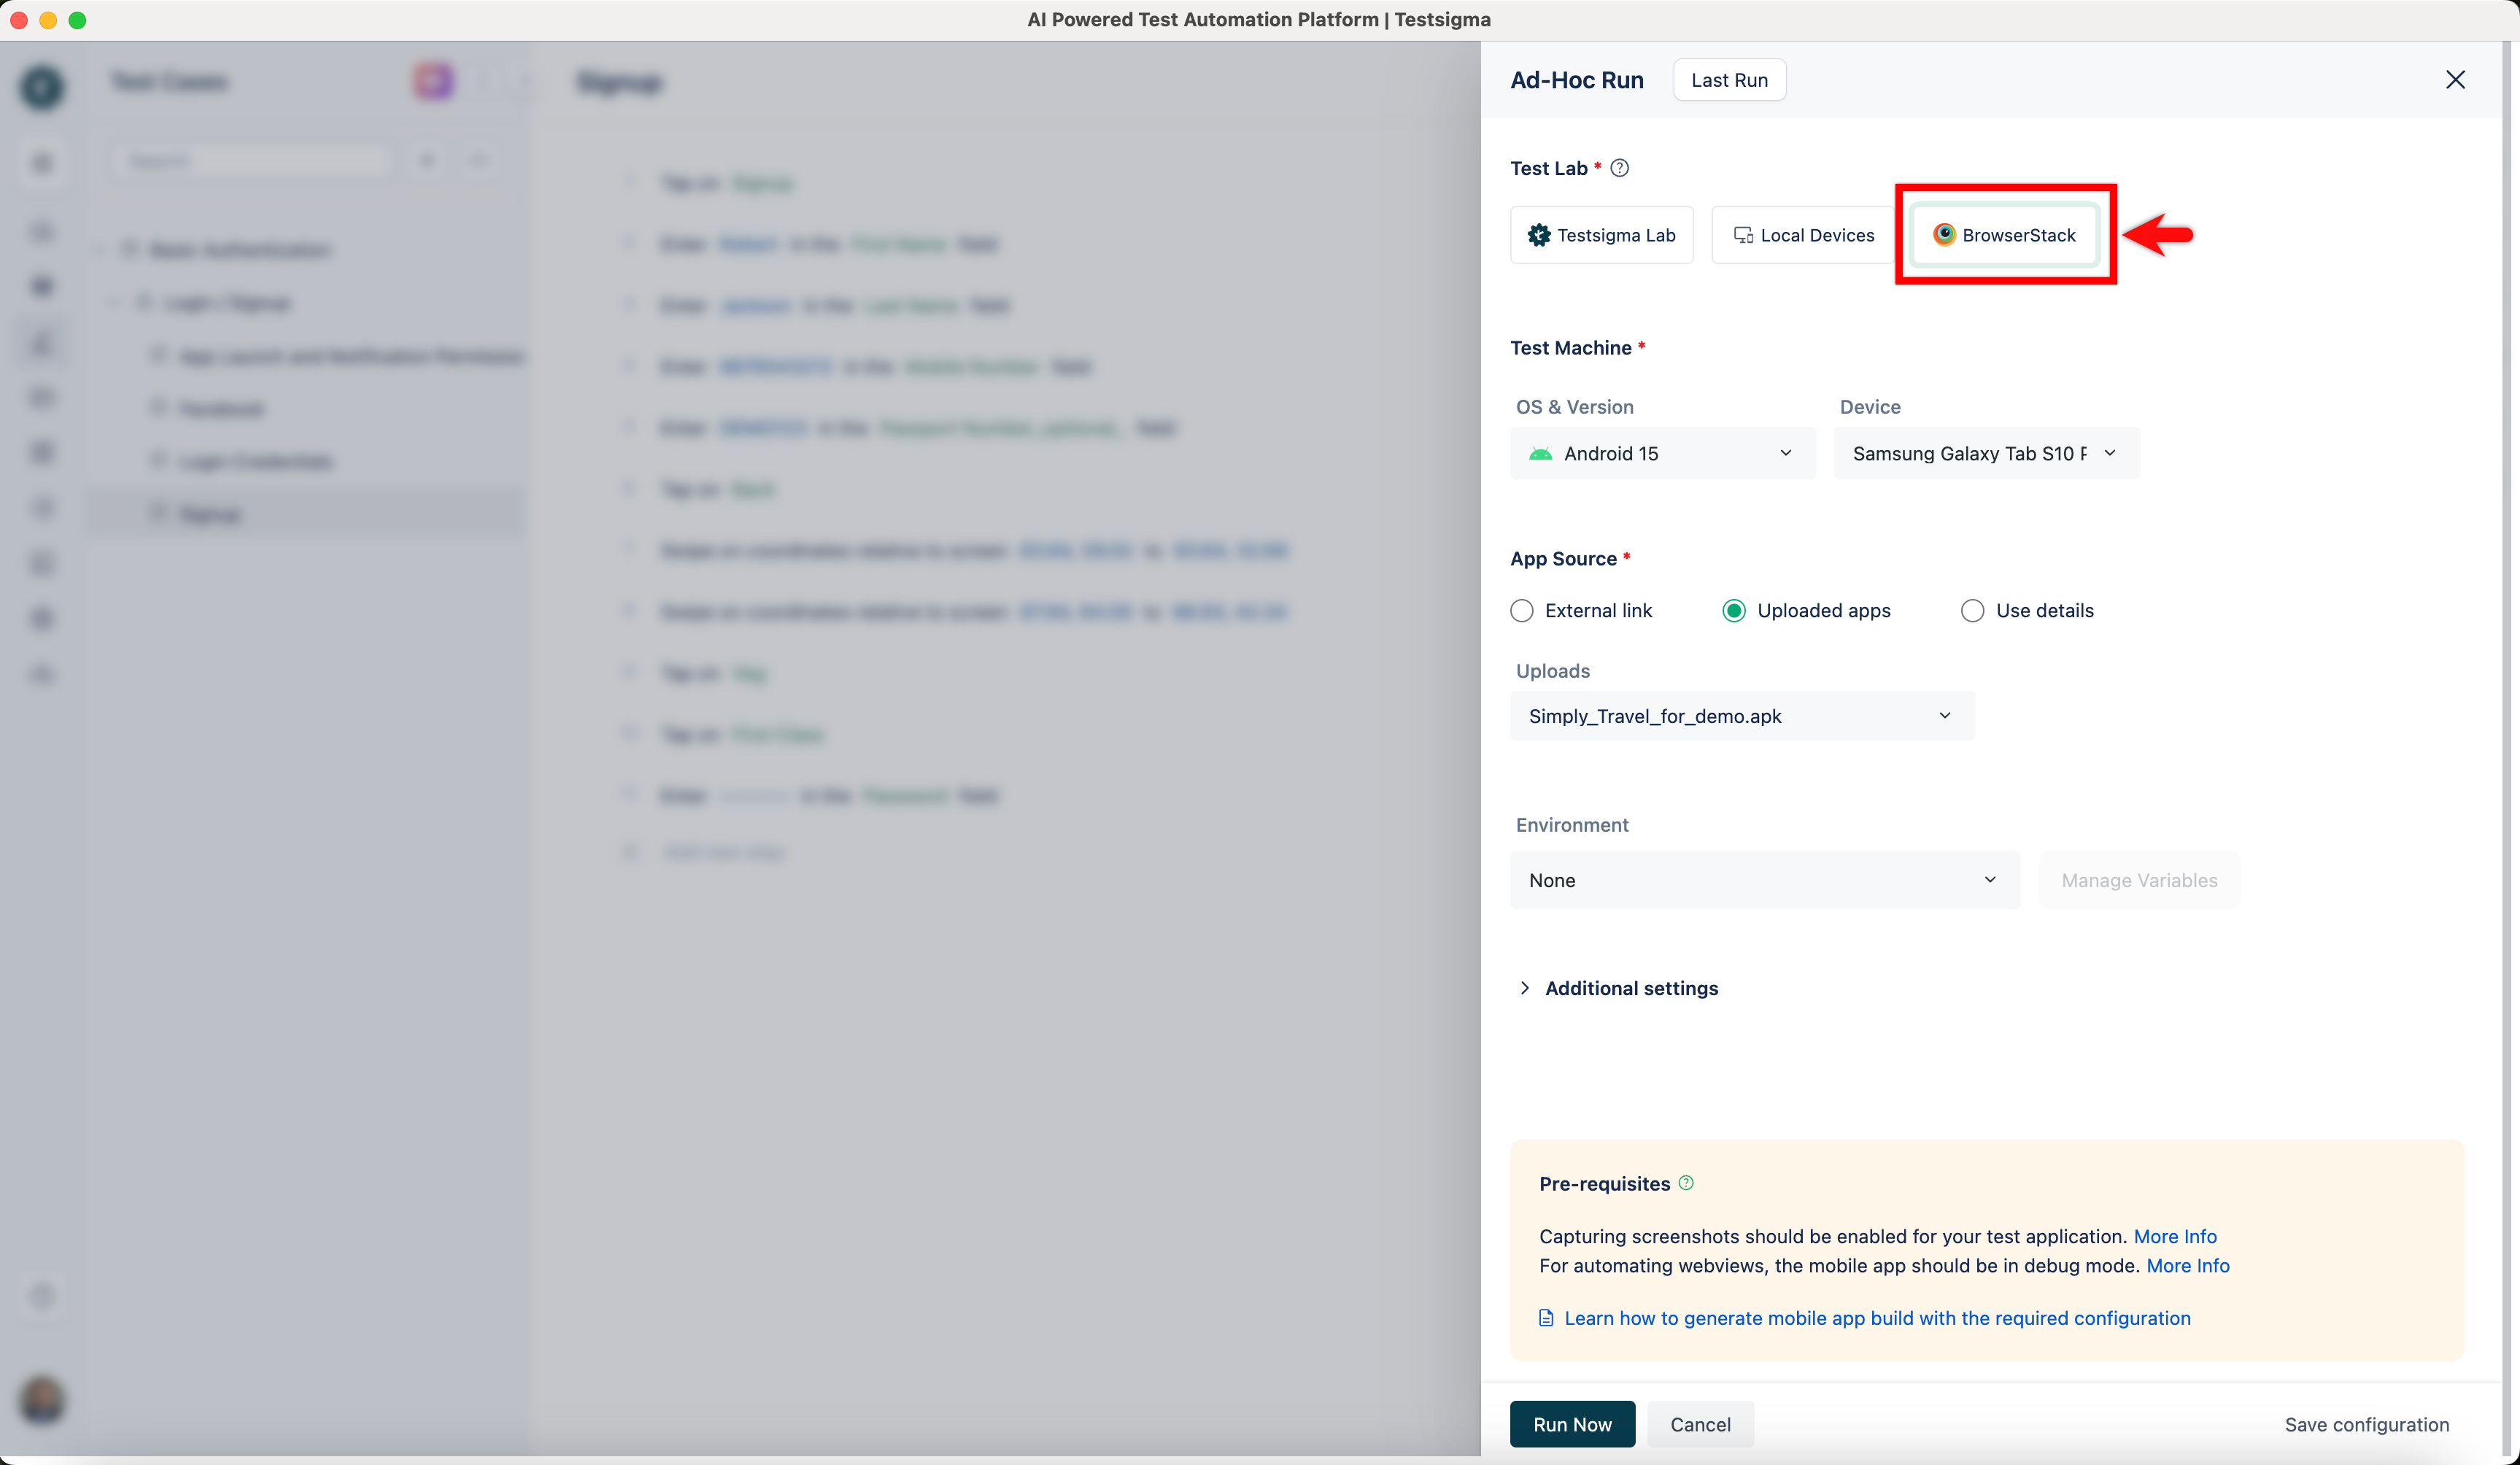
- In the Ad-hoc Run overlay, select BrowserStack as Test Lab.
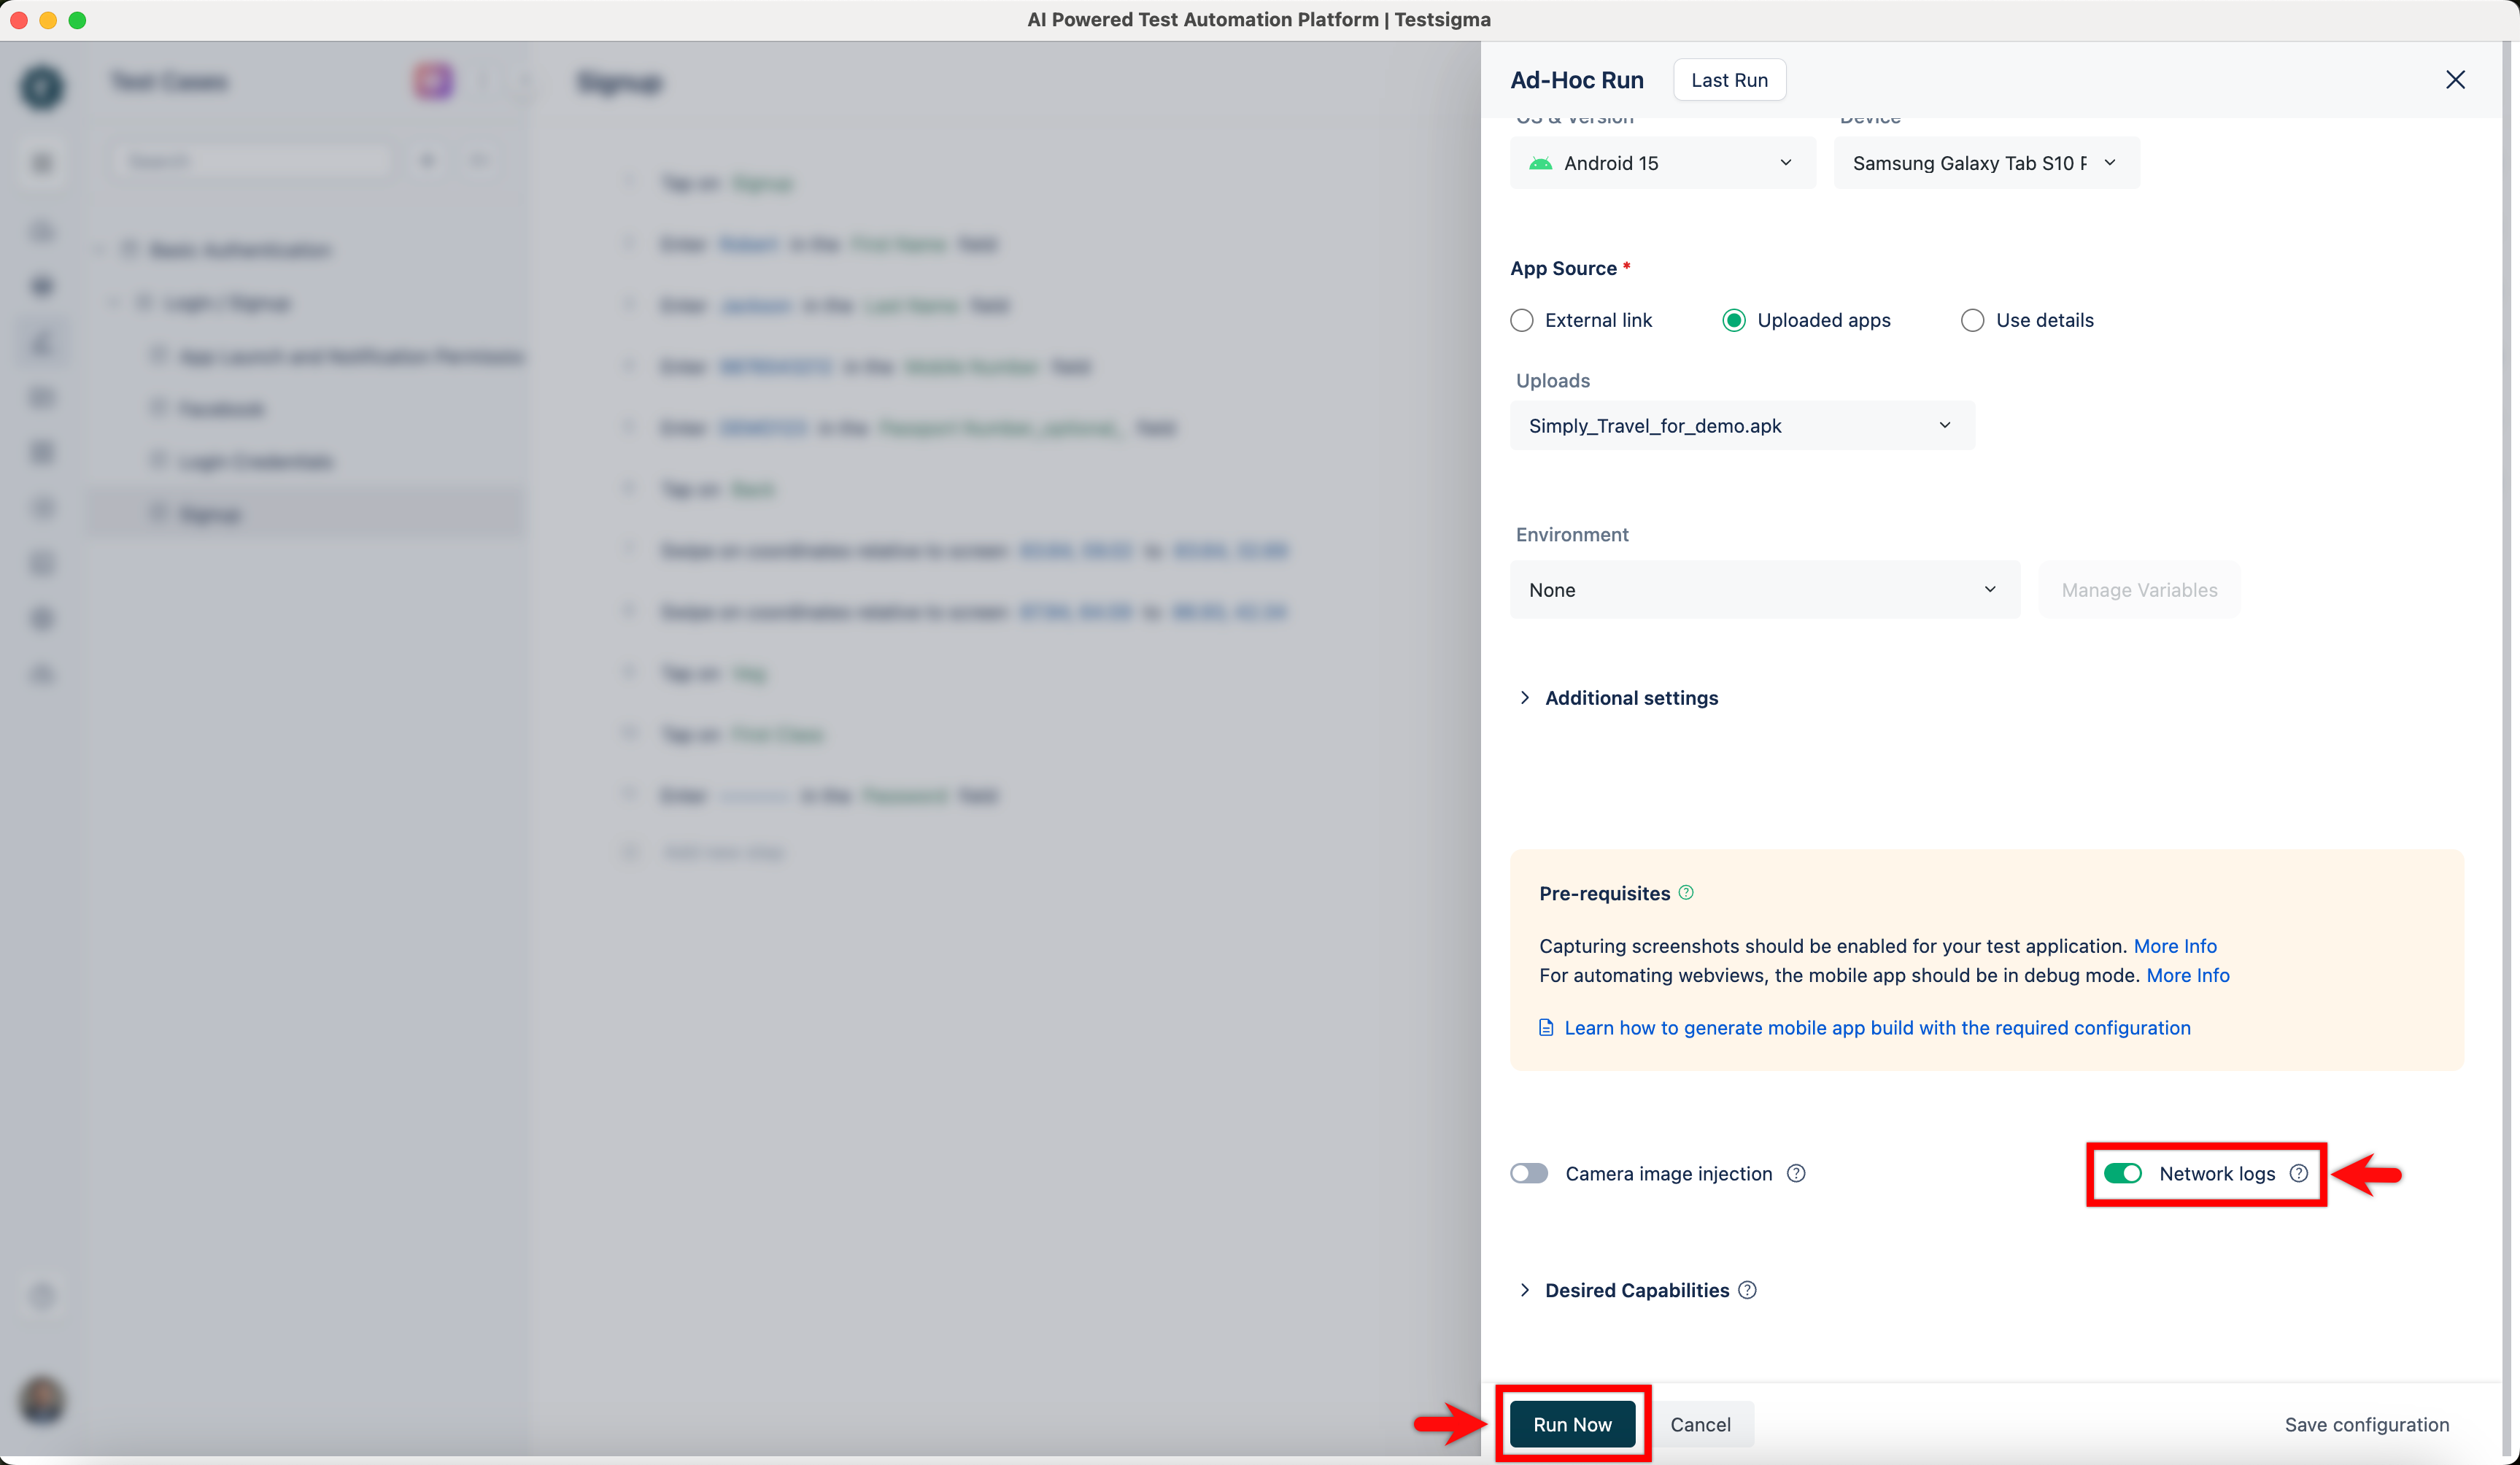
- Enable the Network Log toggle, and click Run Now to start test execution.
Enable Network Logs in Test Plan
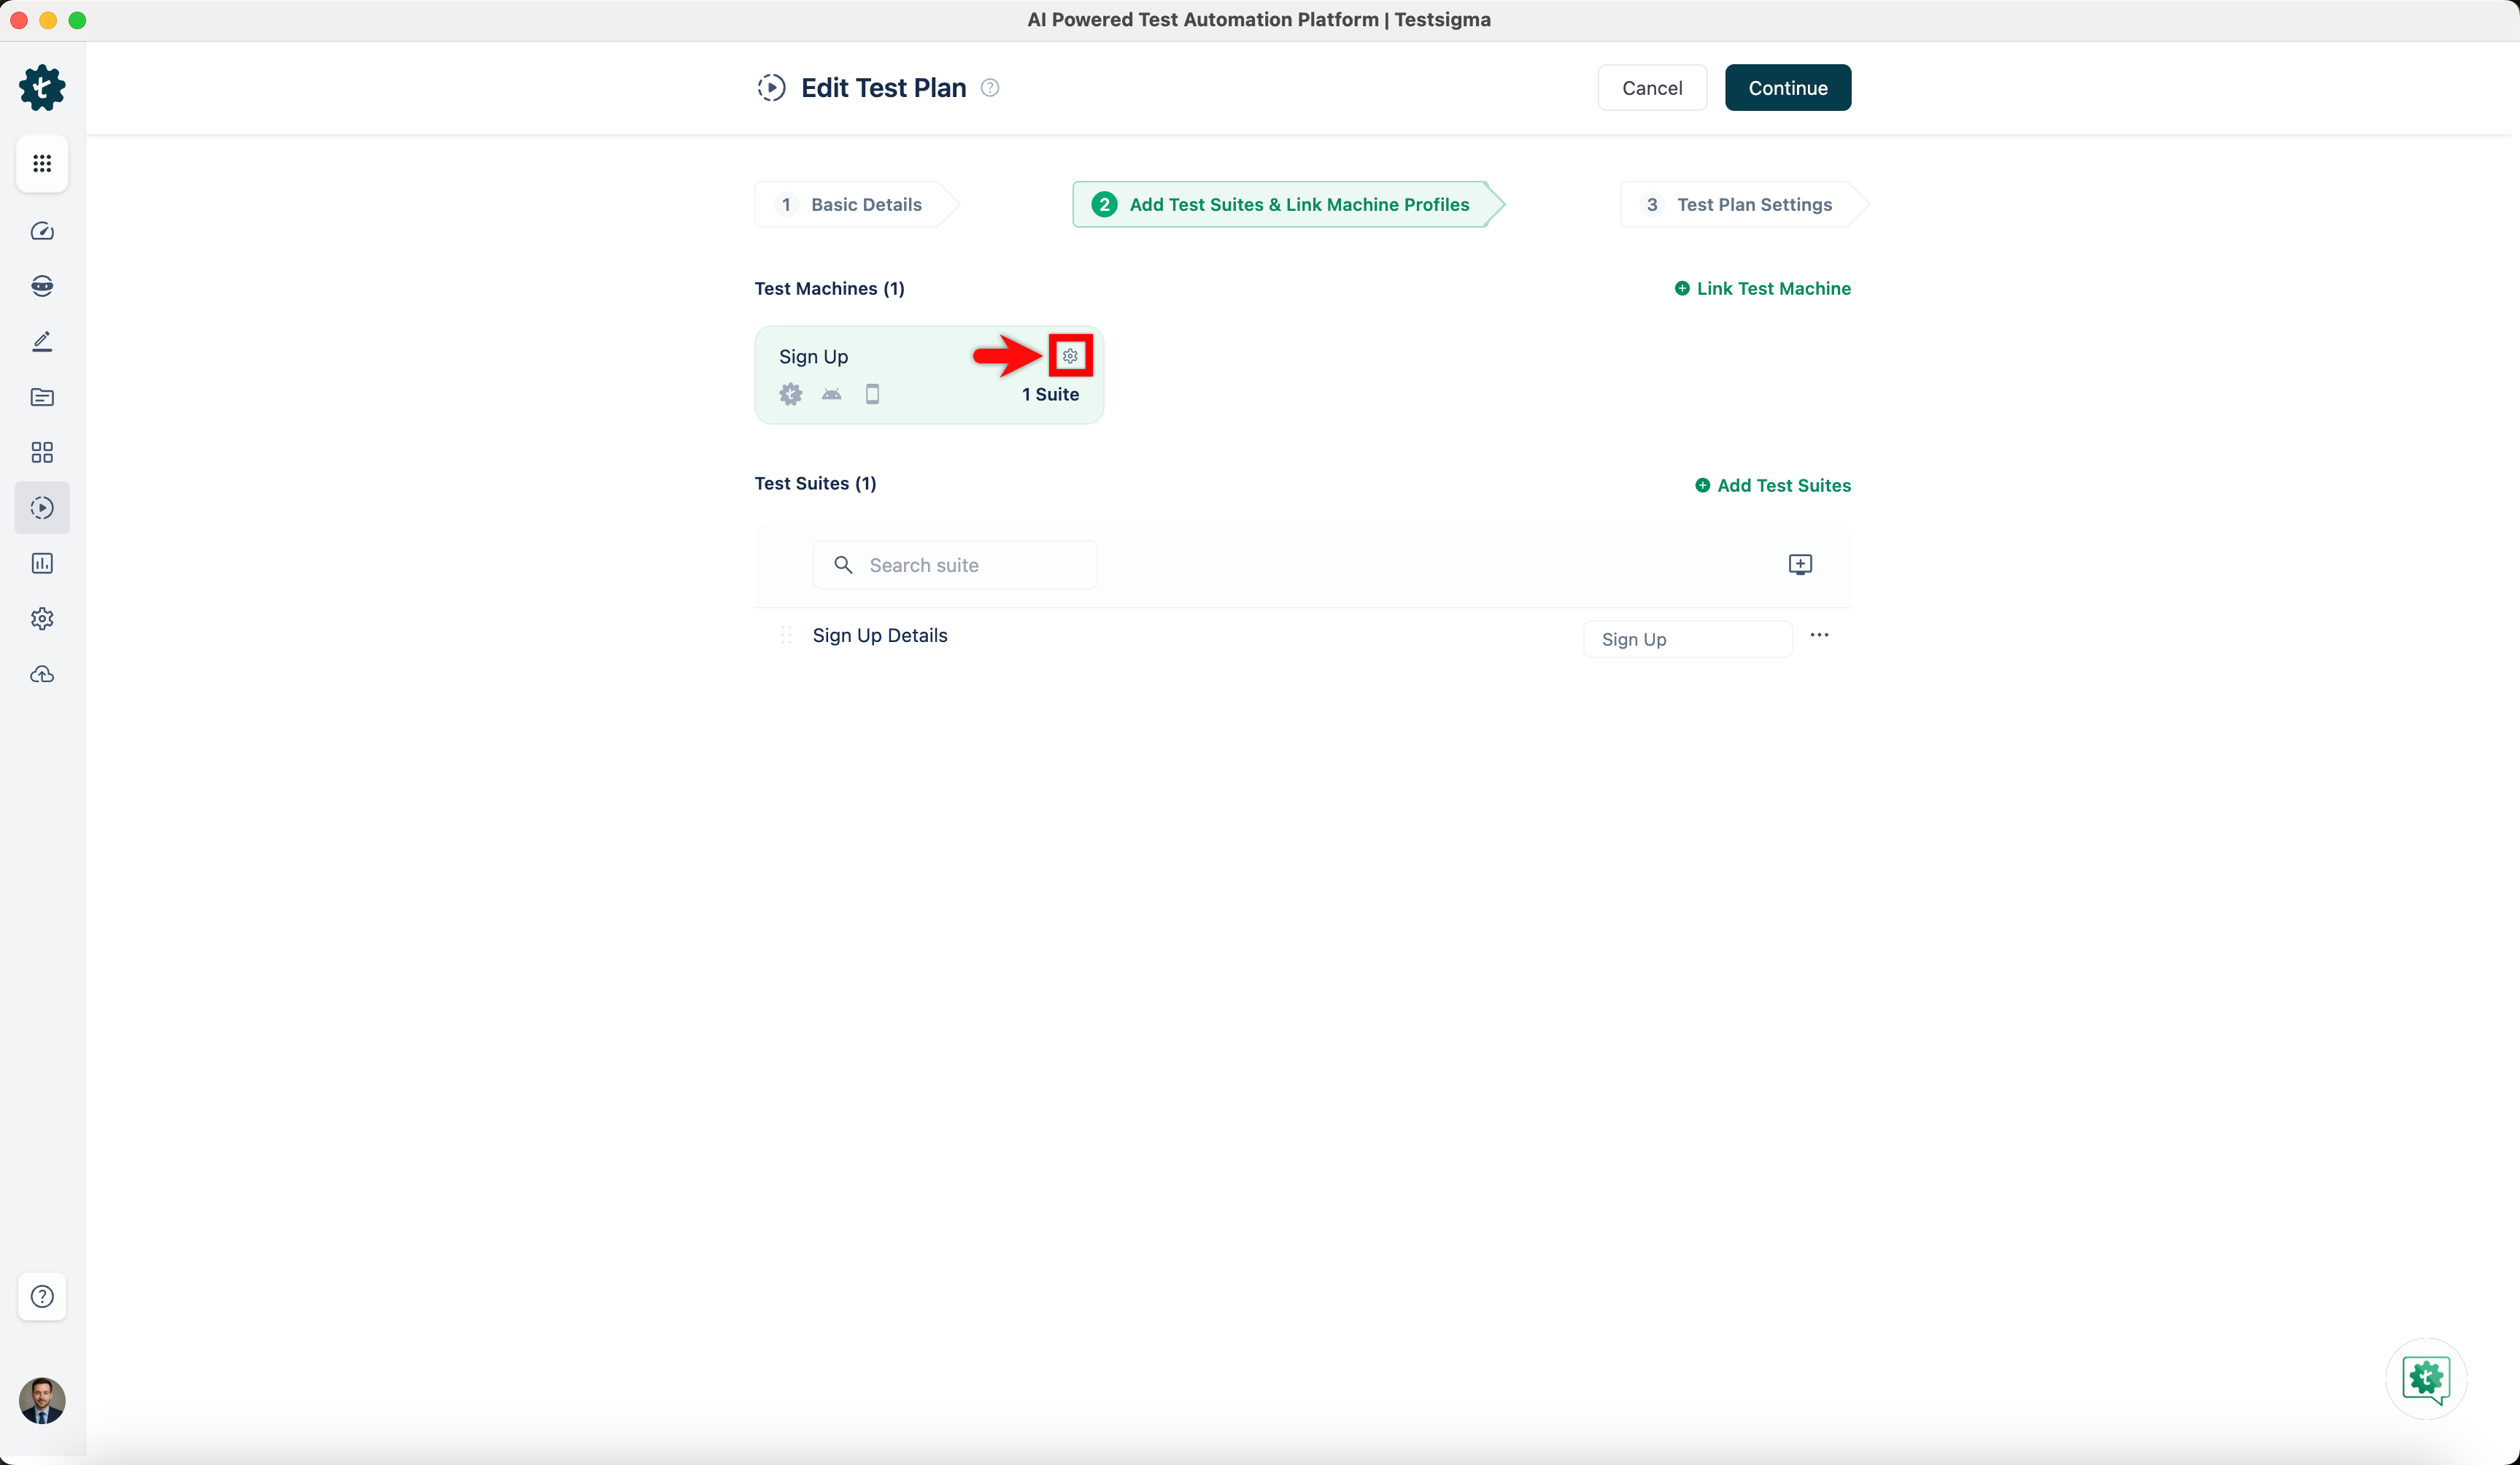
- Navigate to the Add Test Suites & Link Machine Profiles tab on the Create or Edit Test Plan page.
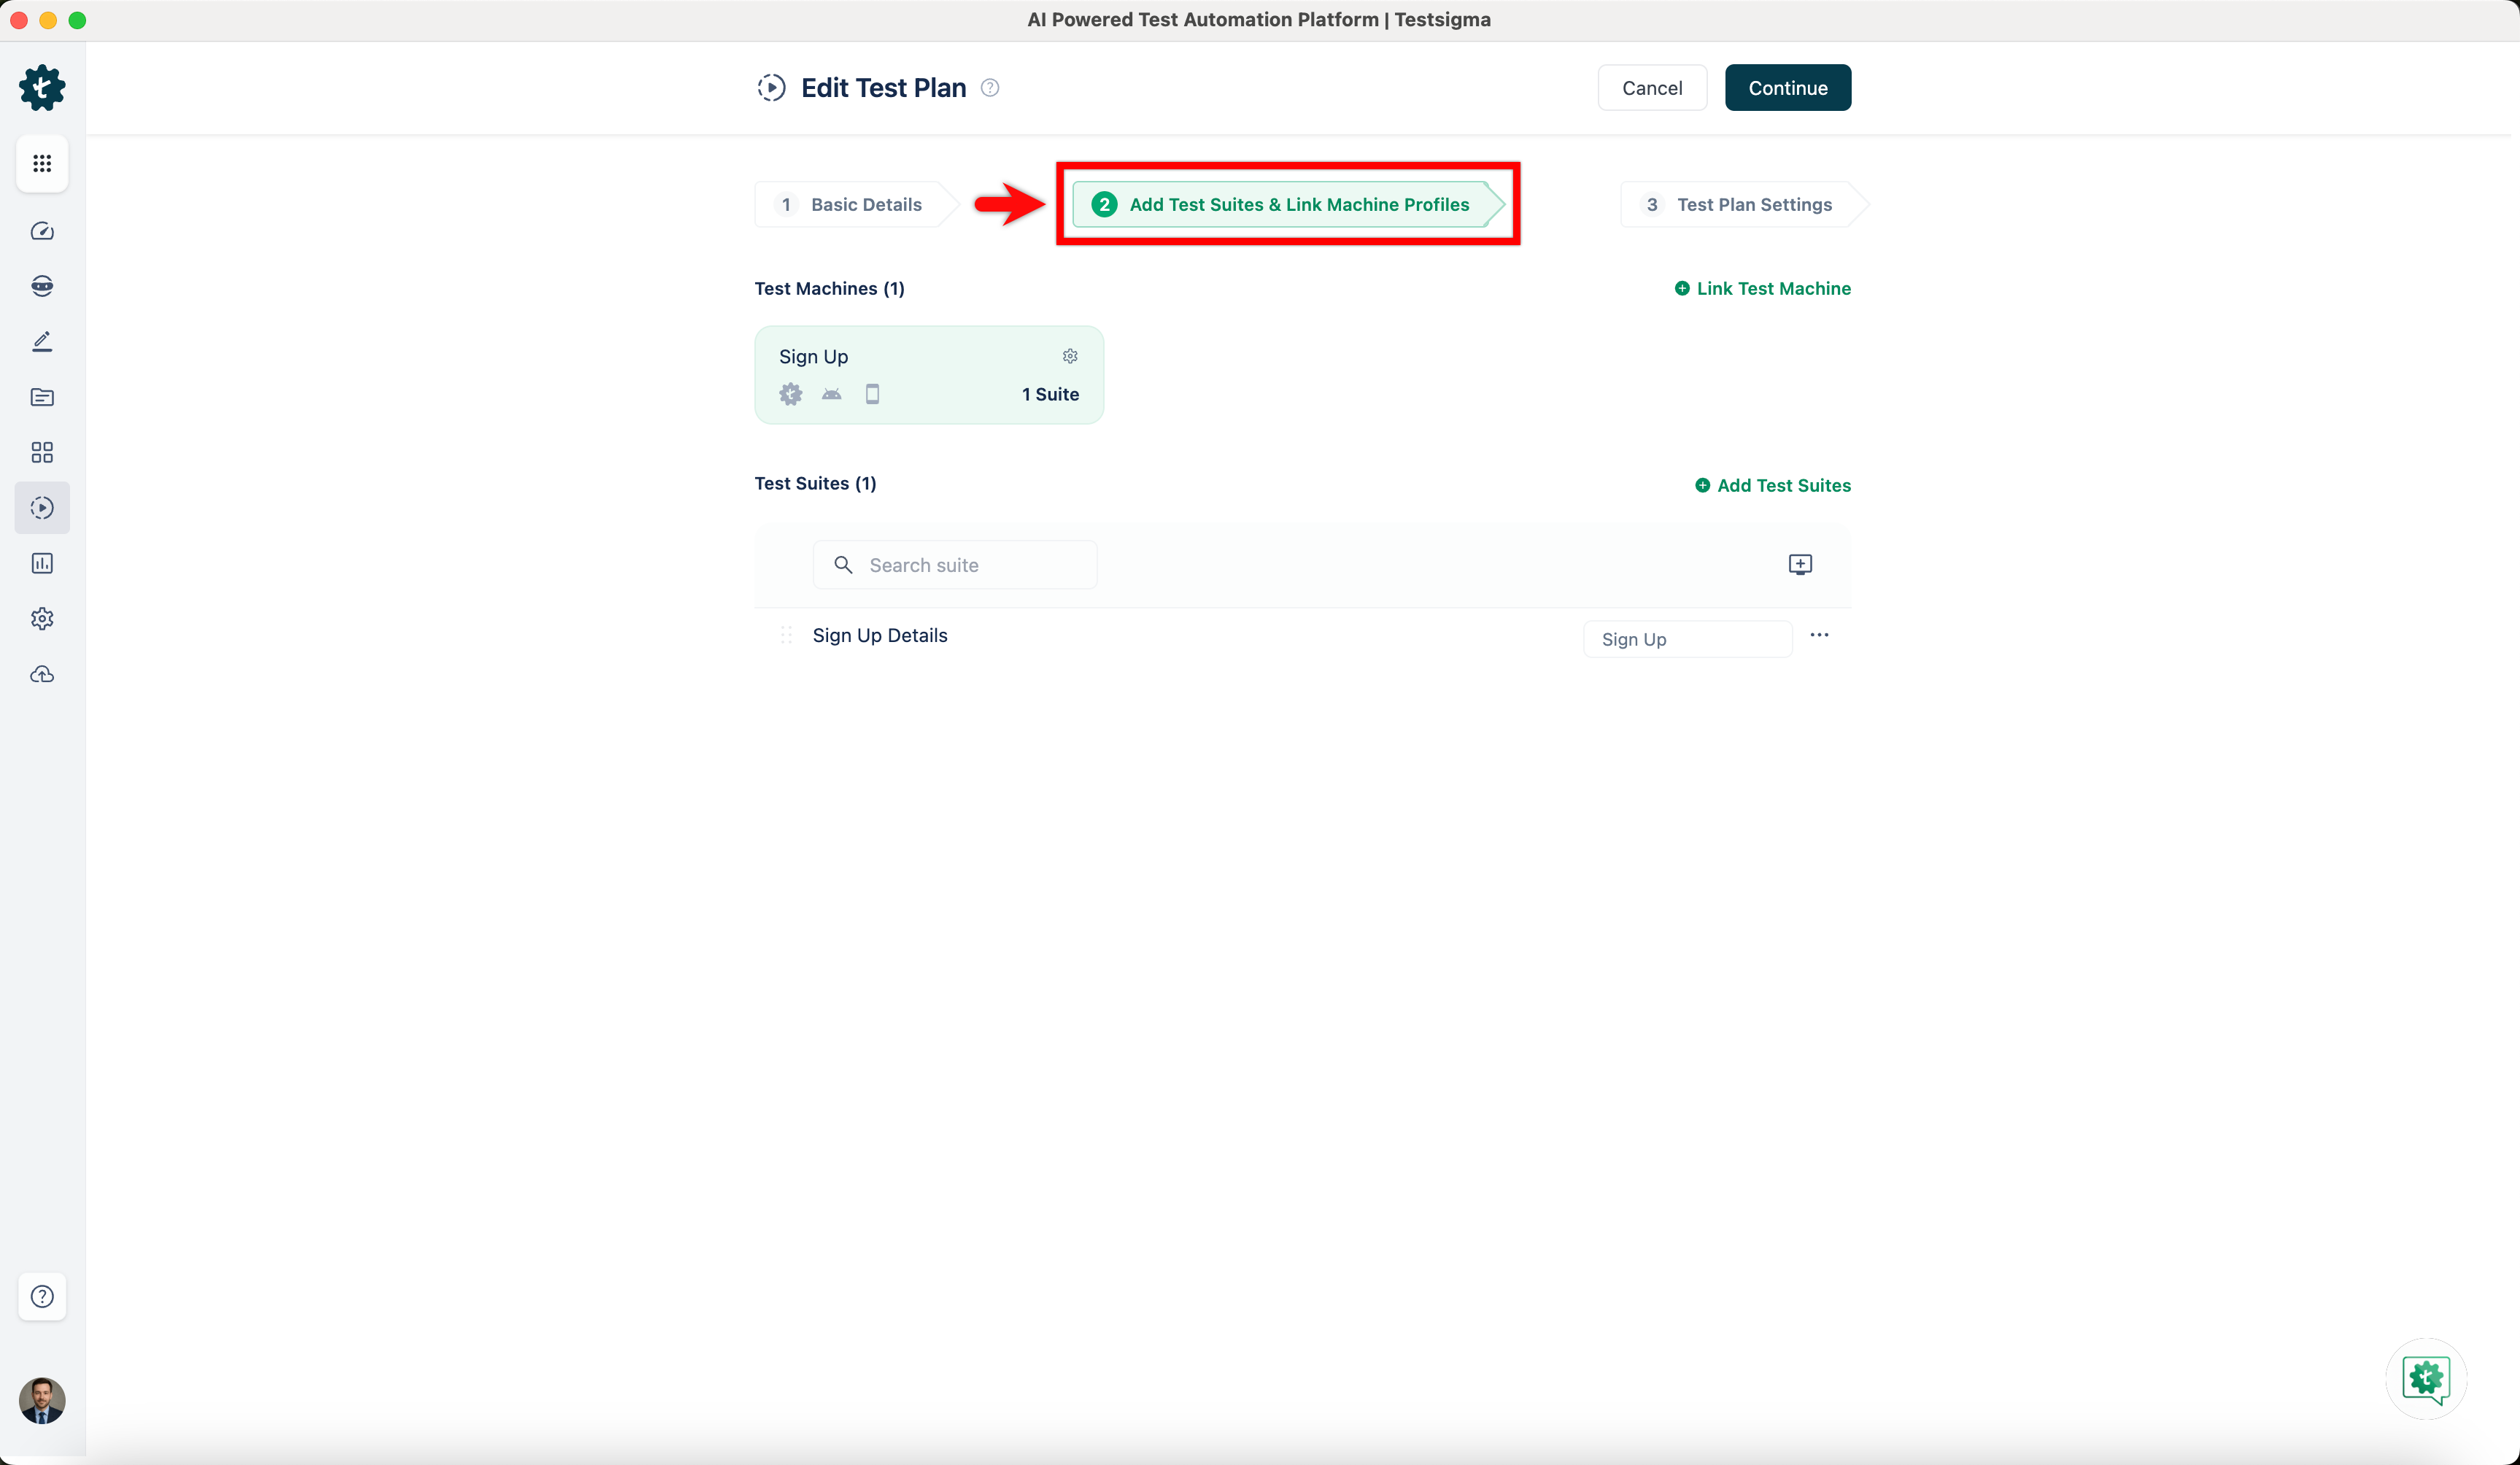
- Click the Test Machine Settings icon, and the Add or Edit test machine/device profile overlay will appear.
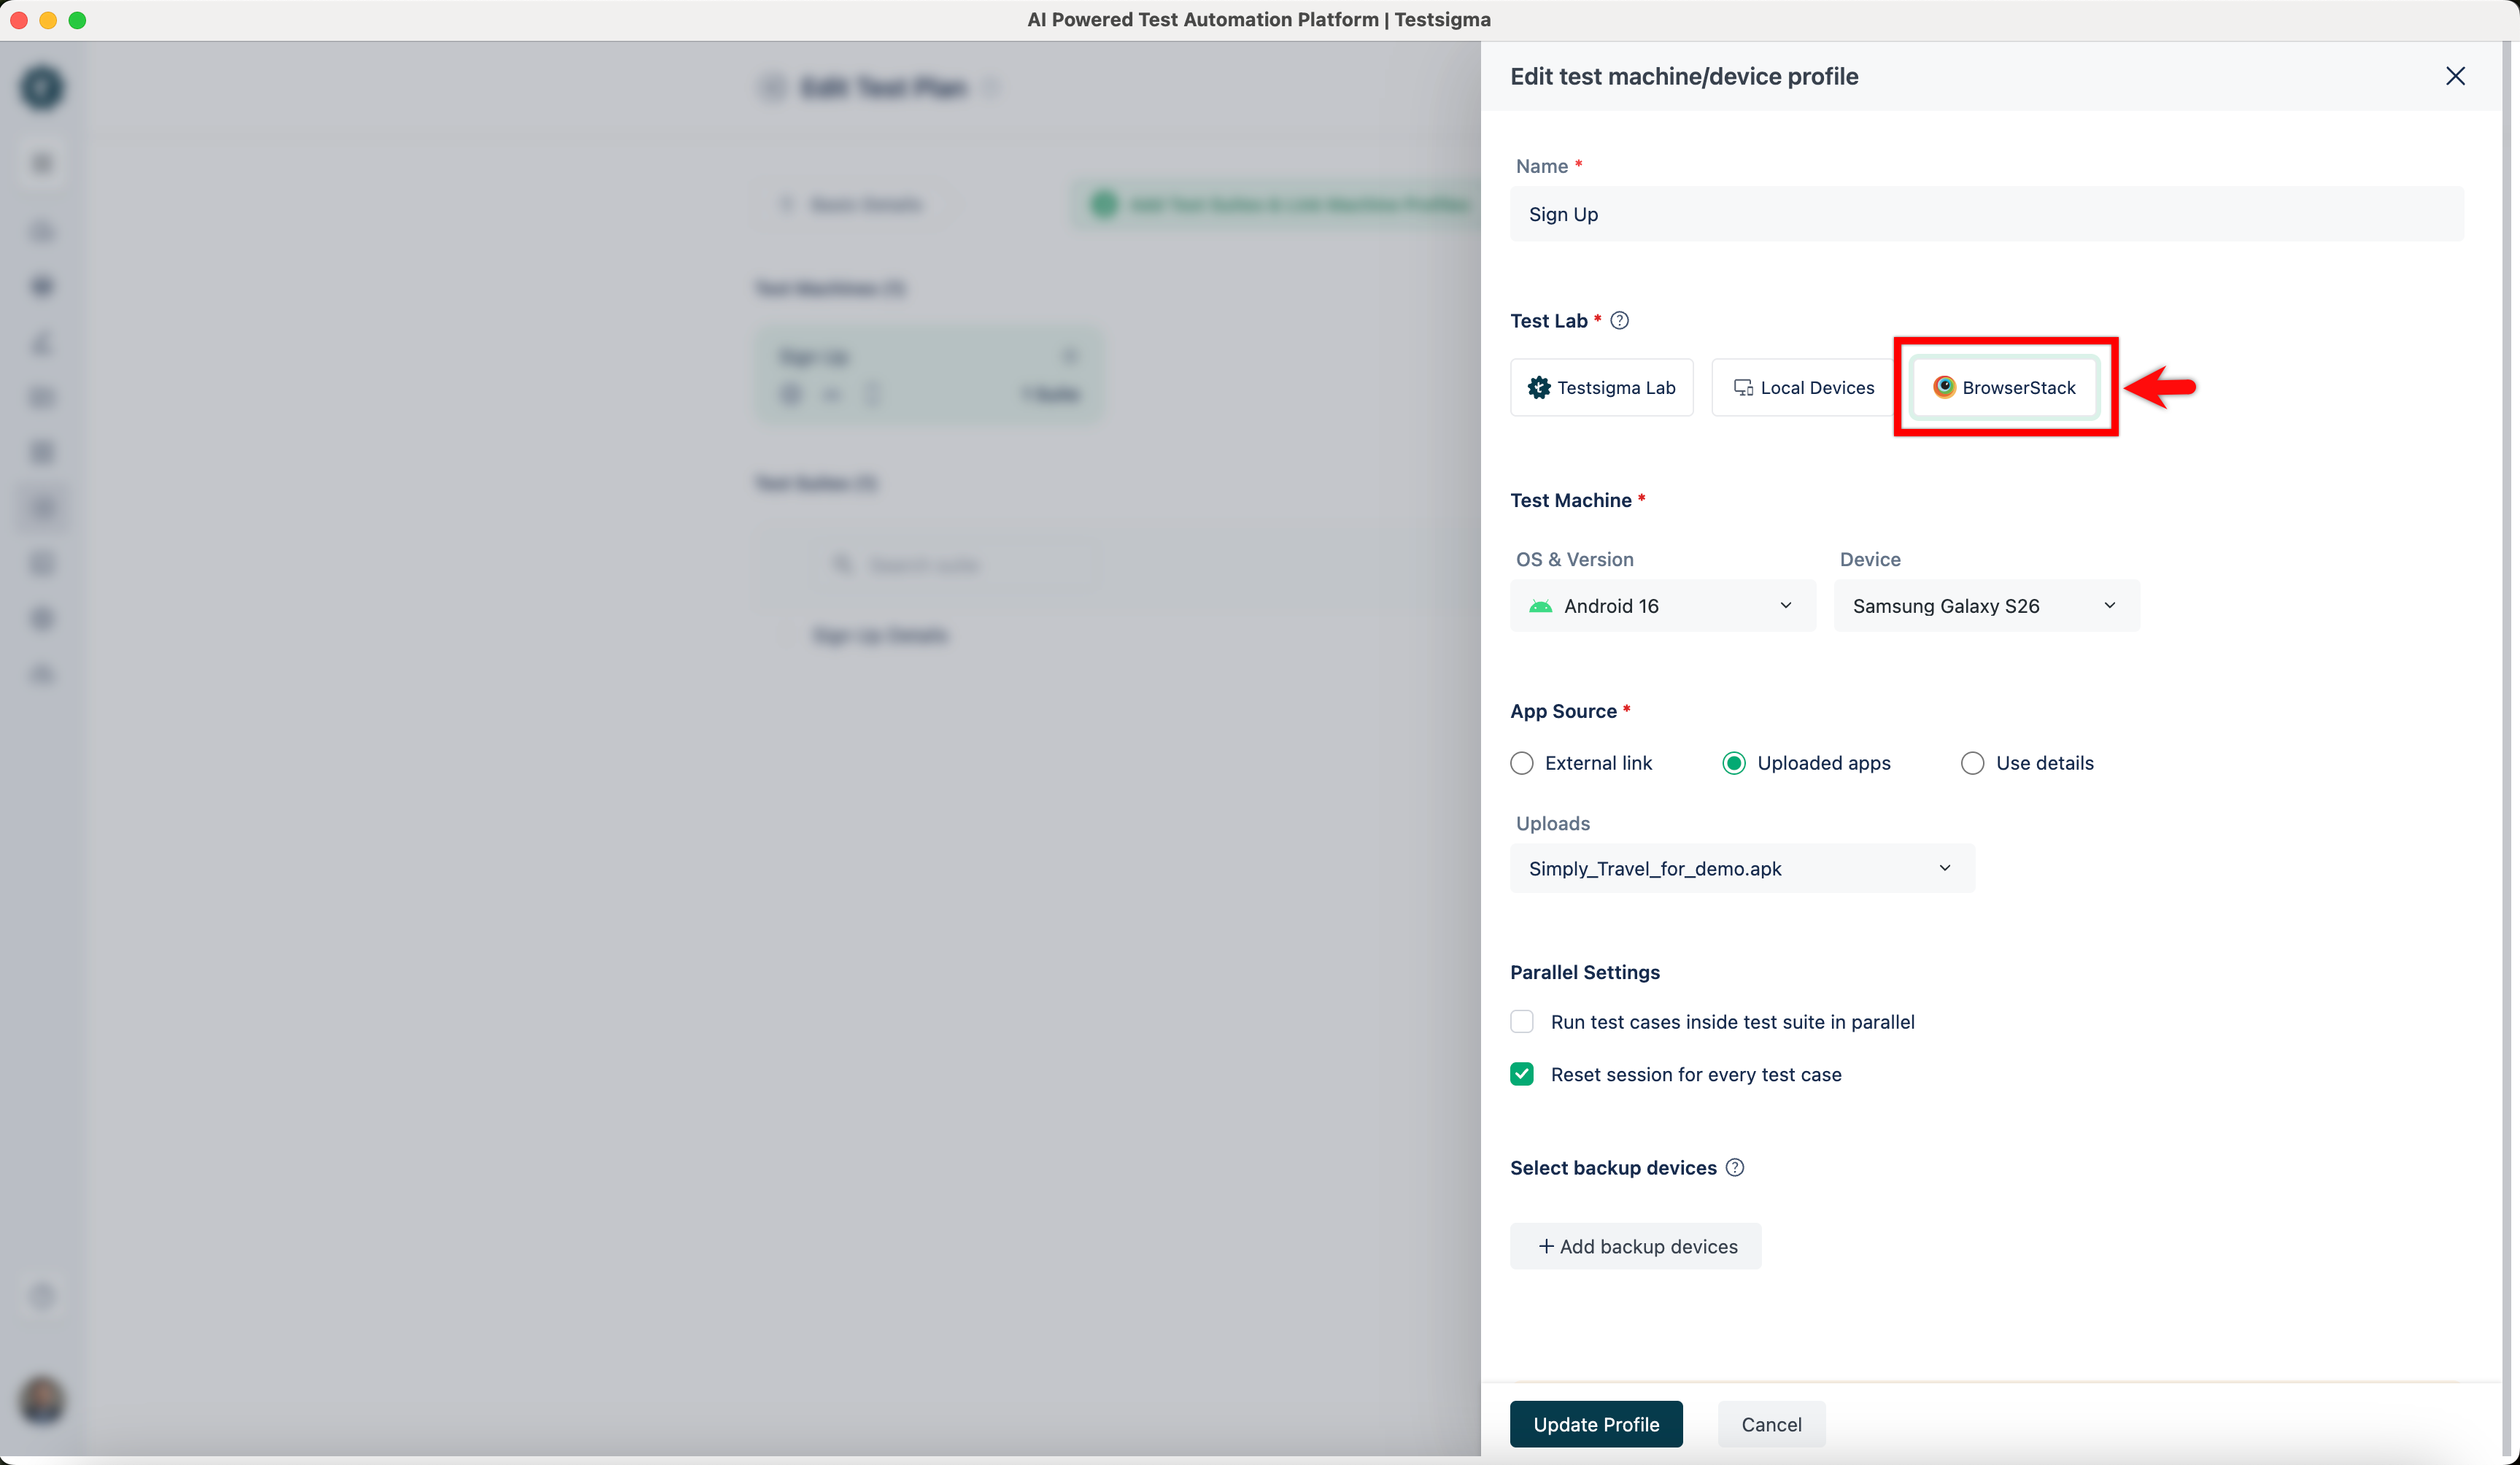
- In the Add or Edit test machine/device profile overlay, select BrowserStack as Test Lab.
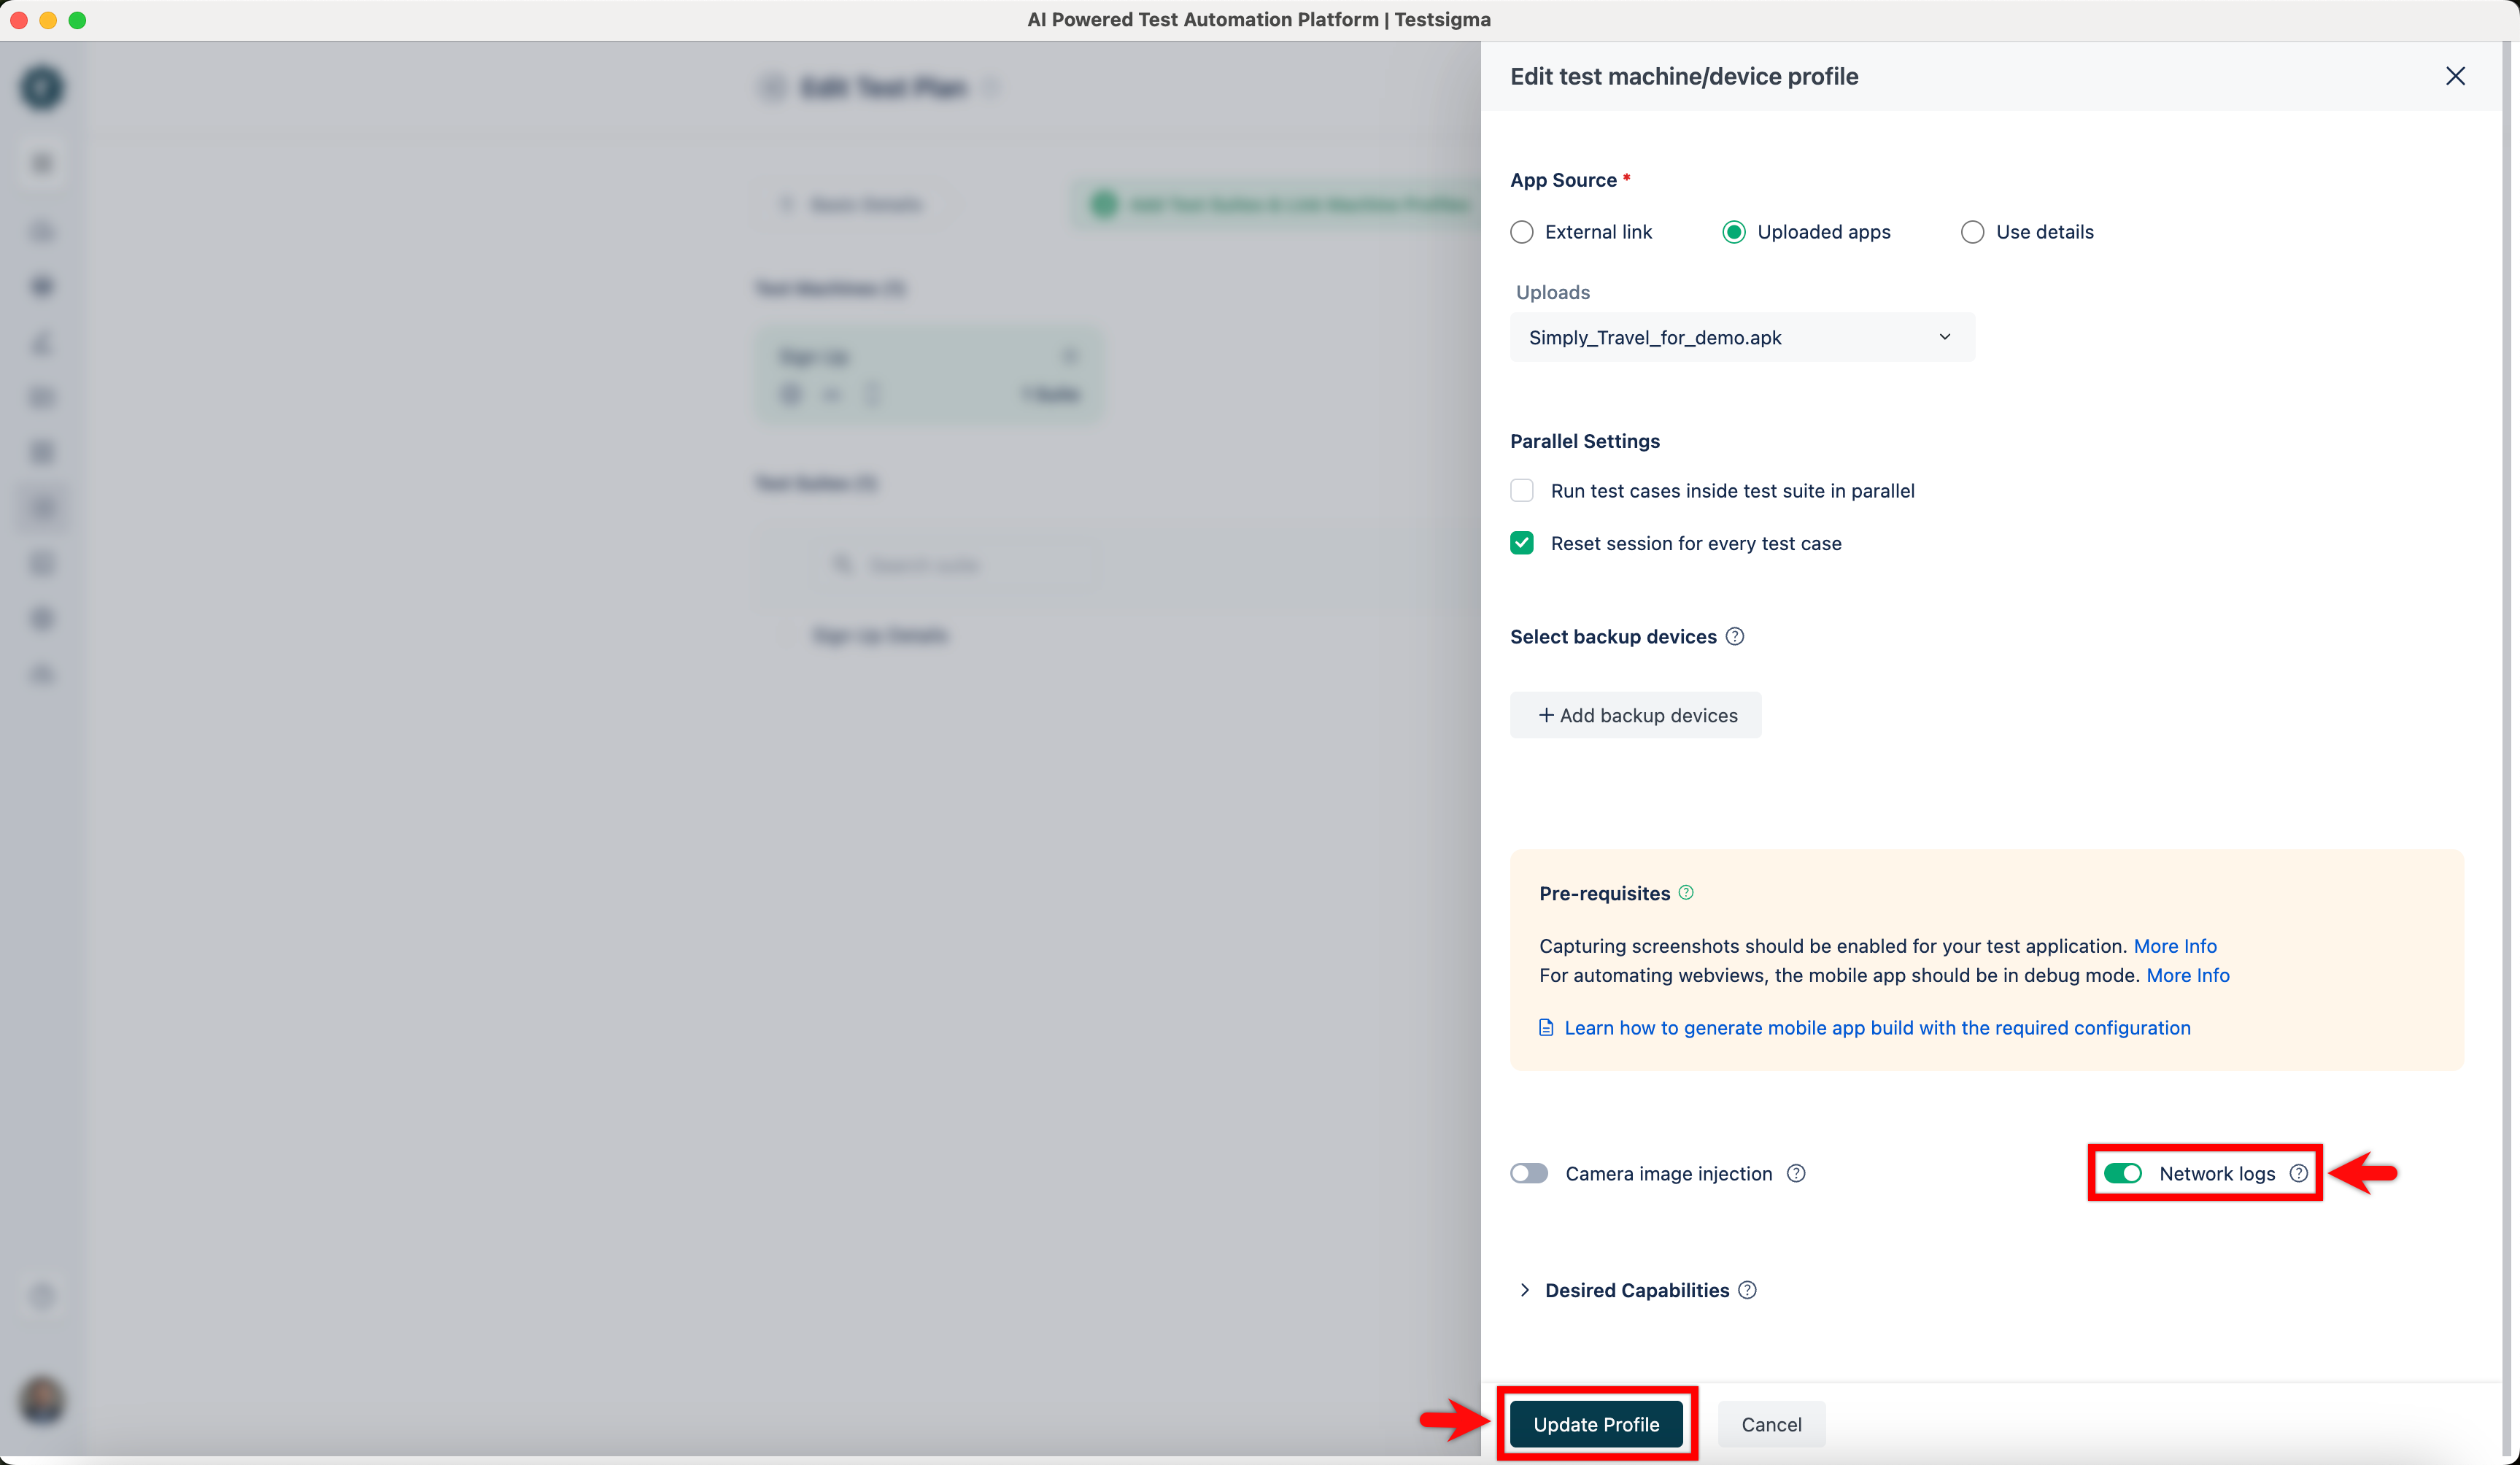
- Enable the Network Log toggle, and click Create/Update Profile.
Network Log Management
After completing the test execution on the Run Test Case Page, you should follow these steps to access and analyse the captured network logs:
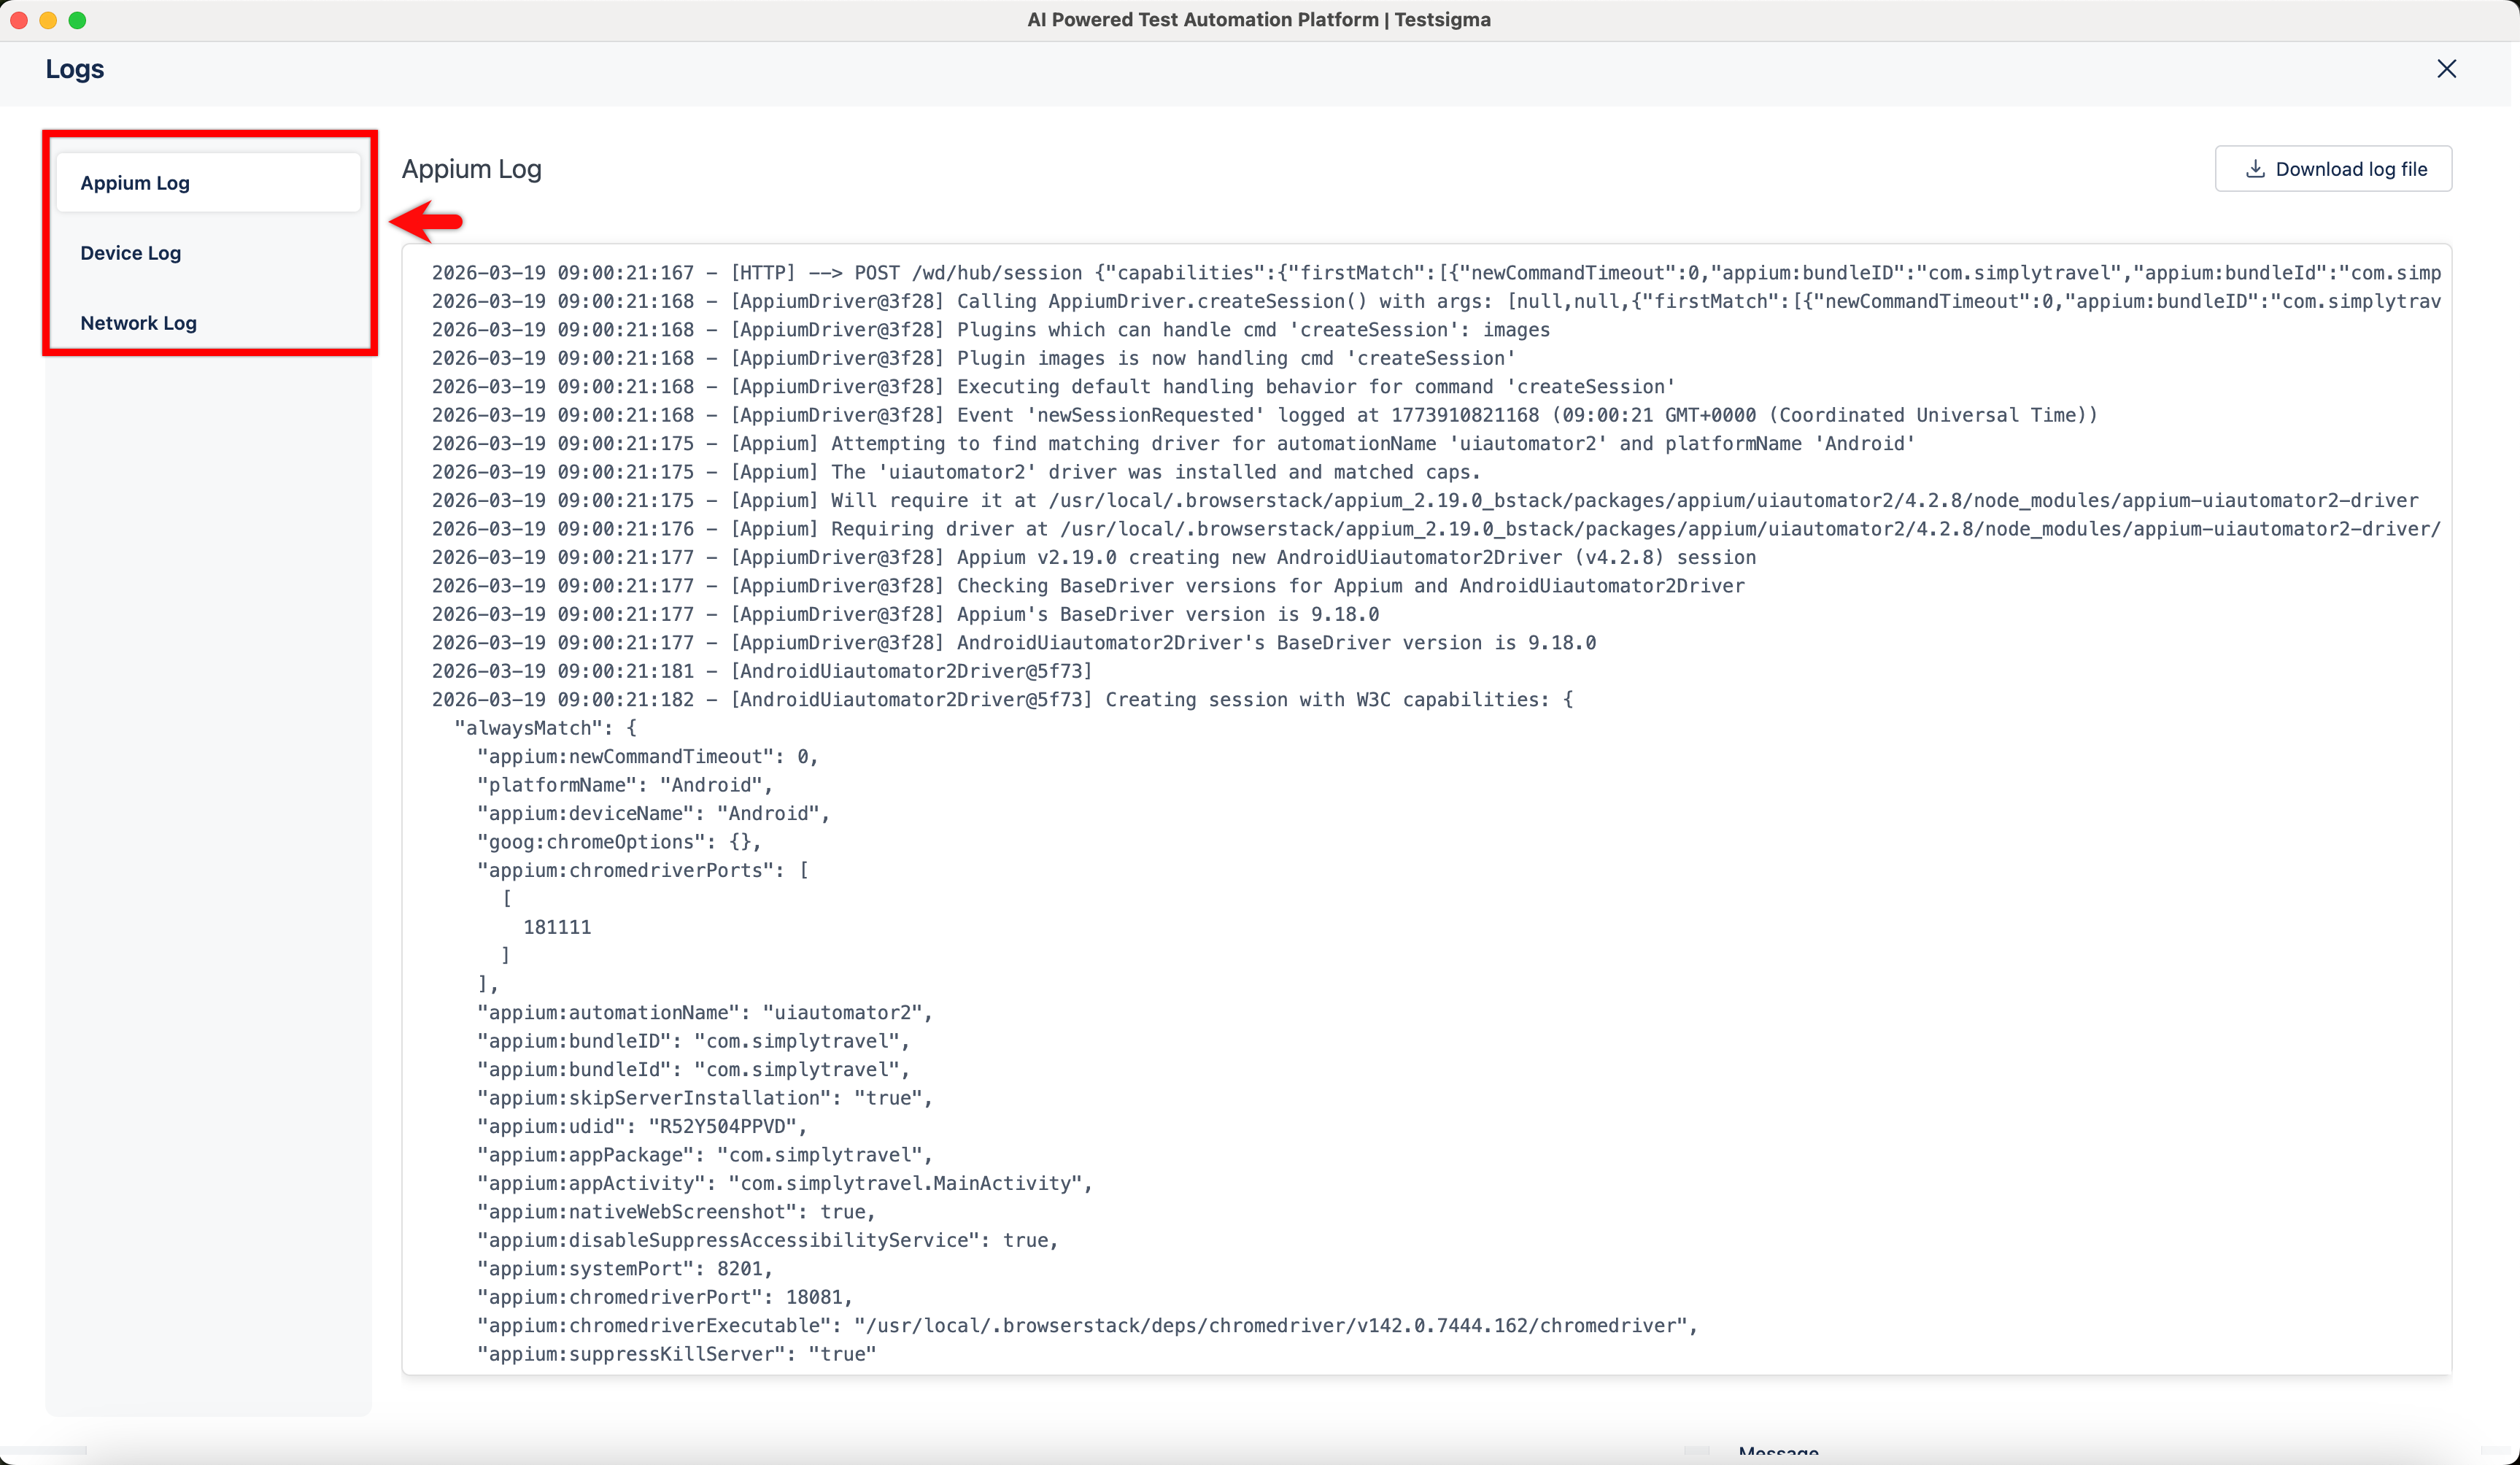
- Click the Show Logs button in the Run Results page. This opens the Logs page.
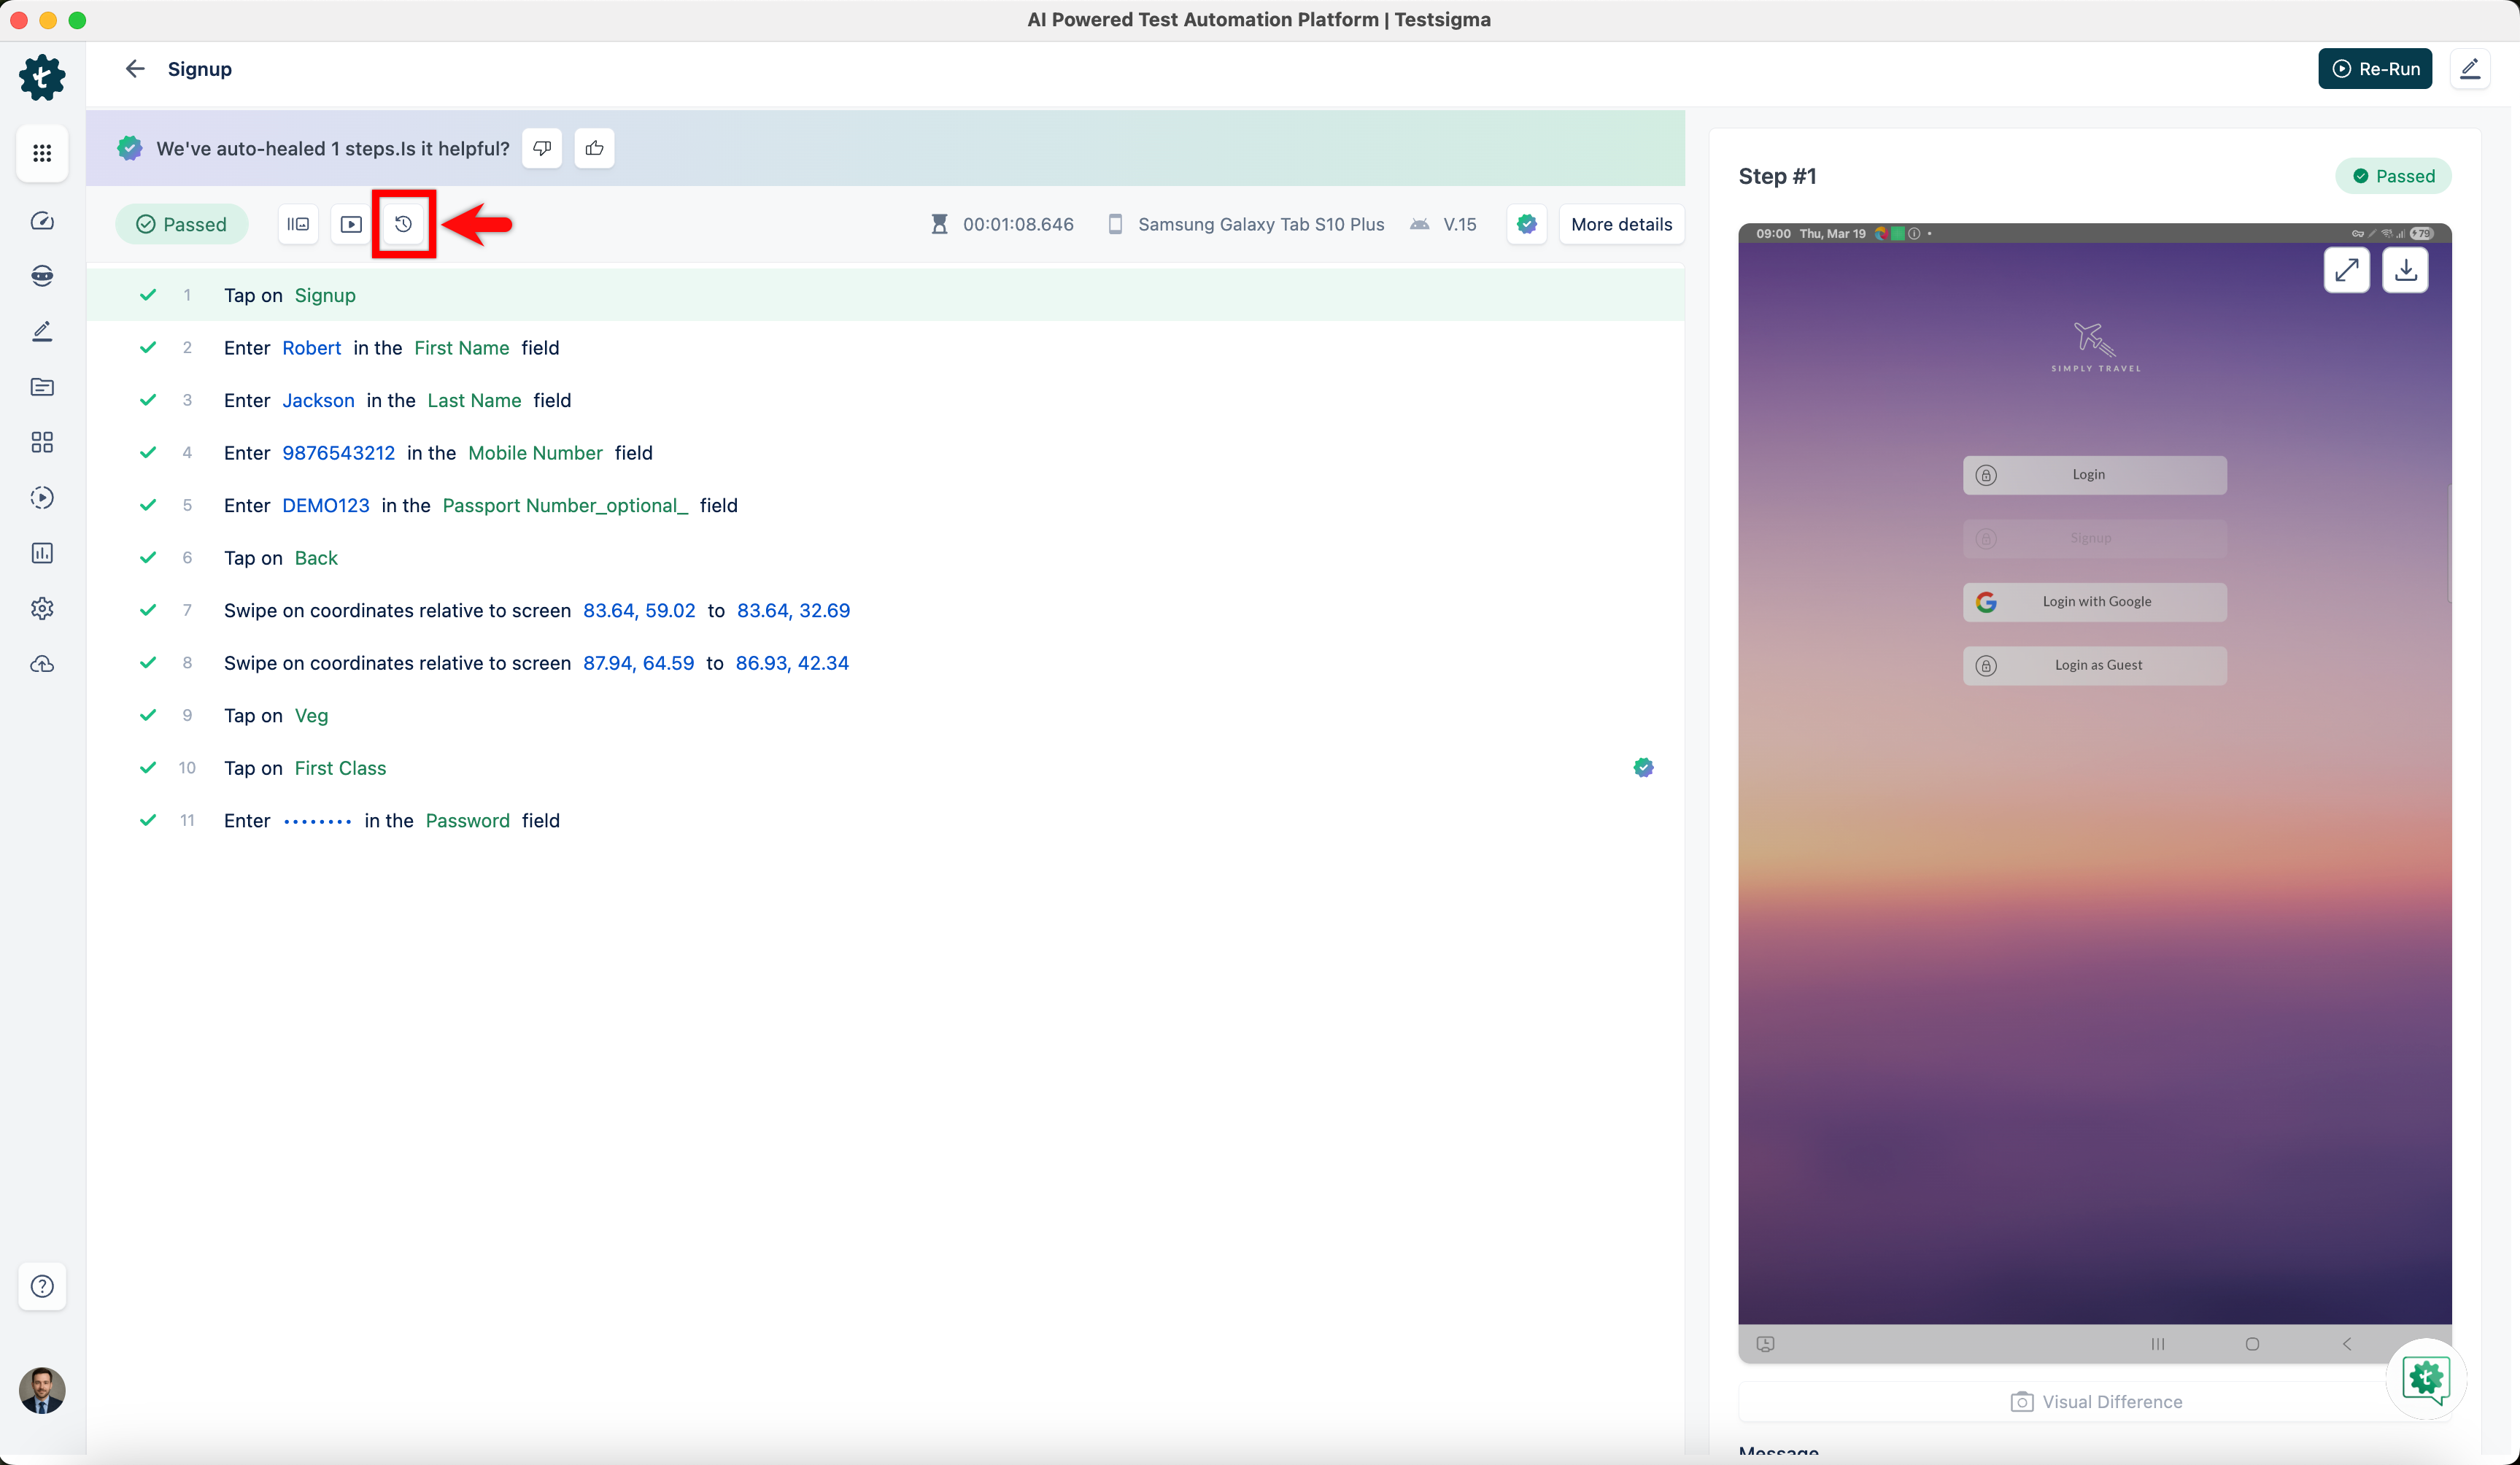
- The Logs page provides a centralized view where you can access Appium, Device, and Network logs helping you monitor different parts of test execution in one place.
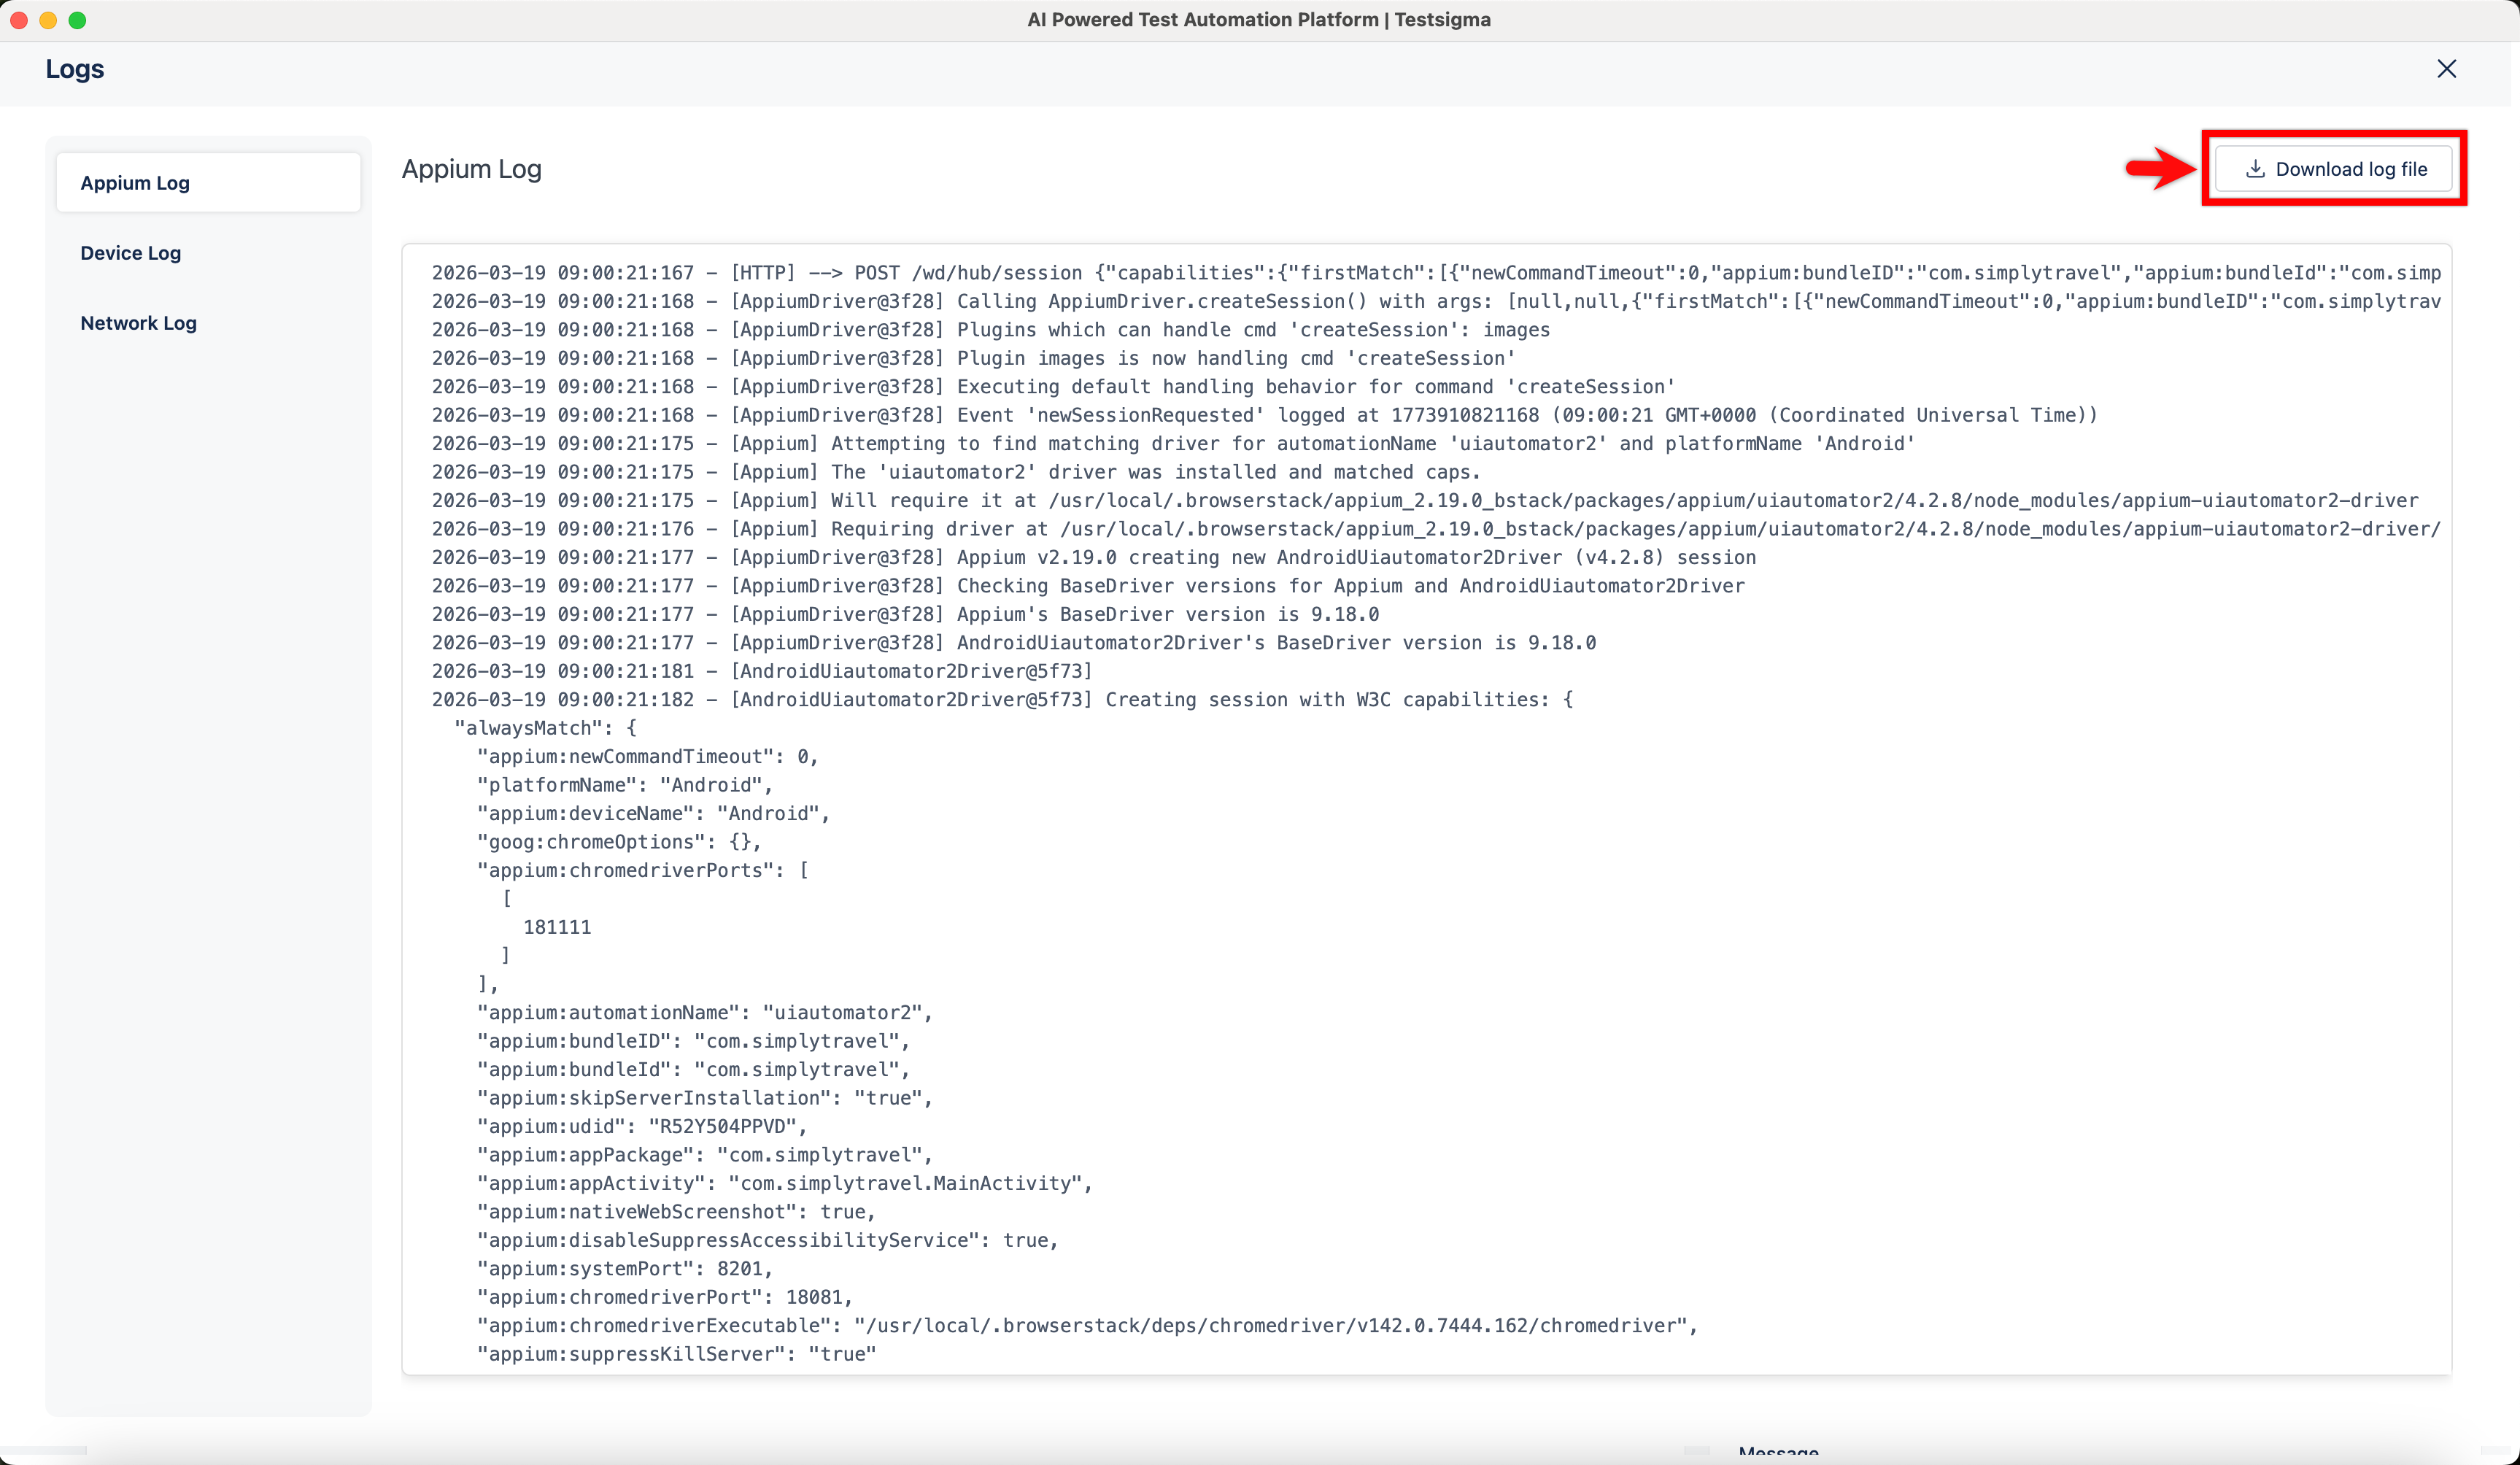
- Click Download log file at the top-right corner of the Logs screen to retrieve the network log file in HAR format. You can then analyse the network logs offline.
Want to contribute or report missing content?