- desired capabilities
 Most Common Desired Capabilities
- Browser Console Debug Logs
- Geolocation Emulation
- Bypass Unsafe Download Prompt
- Geolocation for Chrome & Firefox
- Custom User Profile in Chrome
- Emulate Mobile Devices (Chrome)
- Add Chrome Extension
- Network Throttling
- Network Logs
- Biometric Authentication
- Enable App Resigning in iOS
- Enable Capturing Screenshots (Android & iOS)
- Configure Android WebViews
- Incognito/Private mode
- Set Google Play Store Credentials
- Basic Authentication [Safari]
Enable Browser Console Debug Logs
Browser Console Debug logs can help you more effectively identify and troubleshoot issues in your web application tests. In Testsigma, enabling Browser Console - Extended Debugging can help you capture and view these logs during test execution. This documentation will guide you on how to use Browser Console Debug Logs in Testsigma.
Prerequisites
Before you begin, ensure that you have referred to:
Desired Capabilities for Console Logs
Pass the desired capabilities below for their respective test lab types.
| Test Lab Type | Capability - Key | Data Type | Value |
|---|---|---|---|
| extendedDebugging | Boolean | True | |
| BrowserStack Lab | browserstack.console | String | warnings |
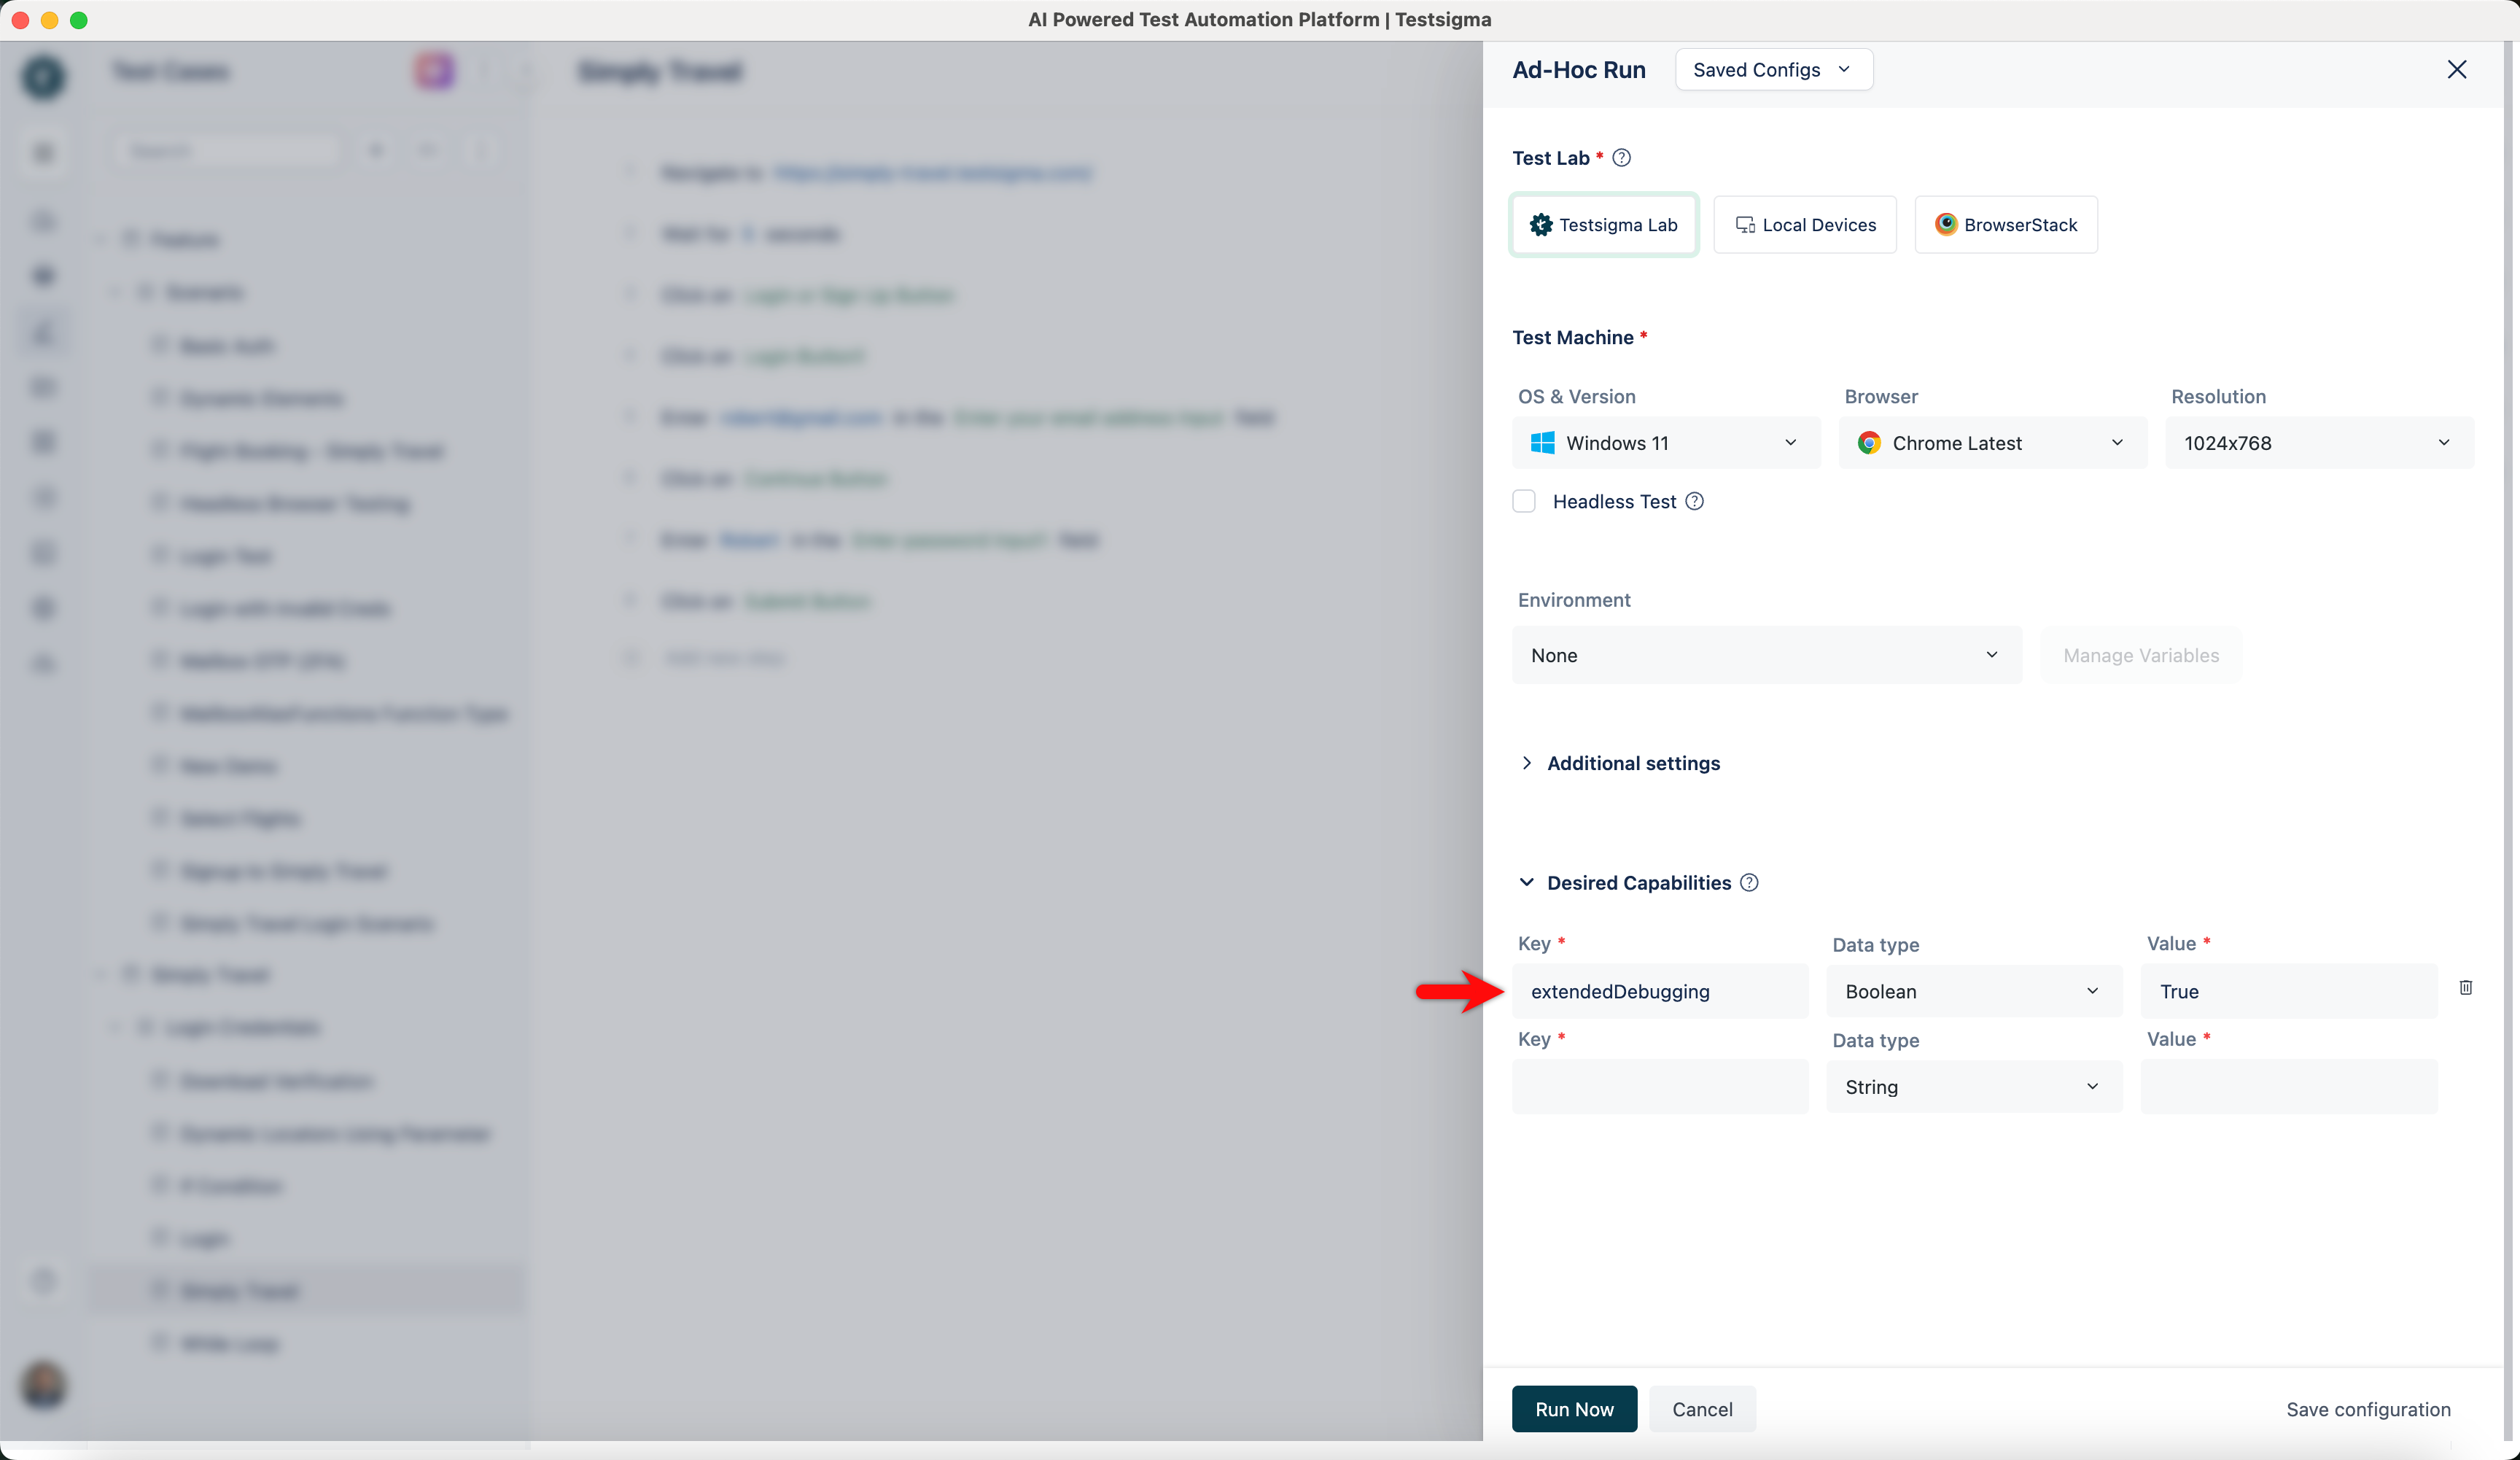
Enable Console Log in Ad-hoc Runs
To enable Browser Console - Extended Debugging for a specific test case in Testsigma, follow these steps:
- Create a Test Case with the required test steps, then click Run in the top-right corner of the screen.
- Select the Test Lab and Test Machines, then click Desired Capabilities (Optional).
- Enter the Desired Capabilities Key, Data Type, and Value for the selected Test Lab Type, then click Run Now.
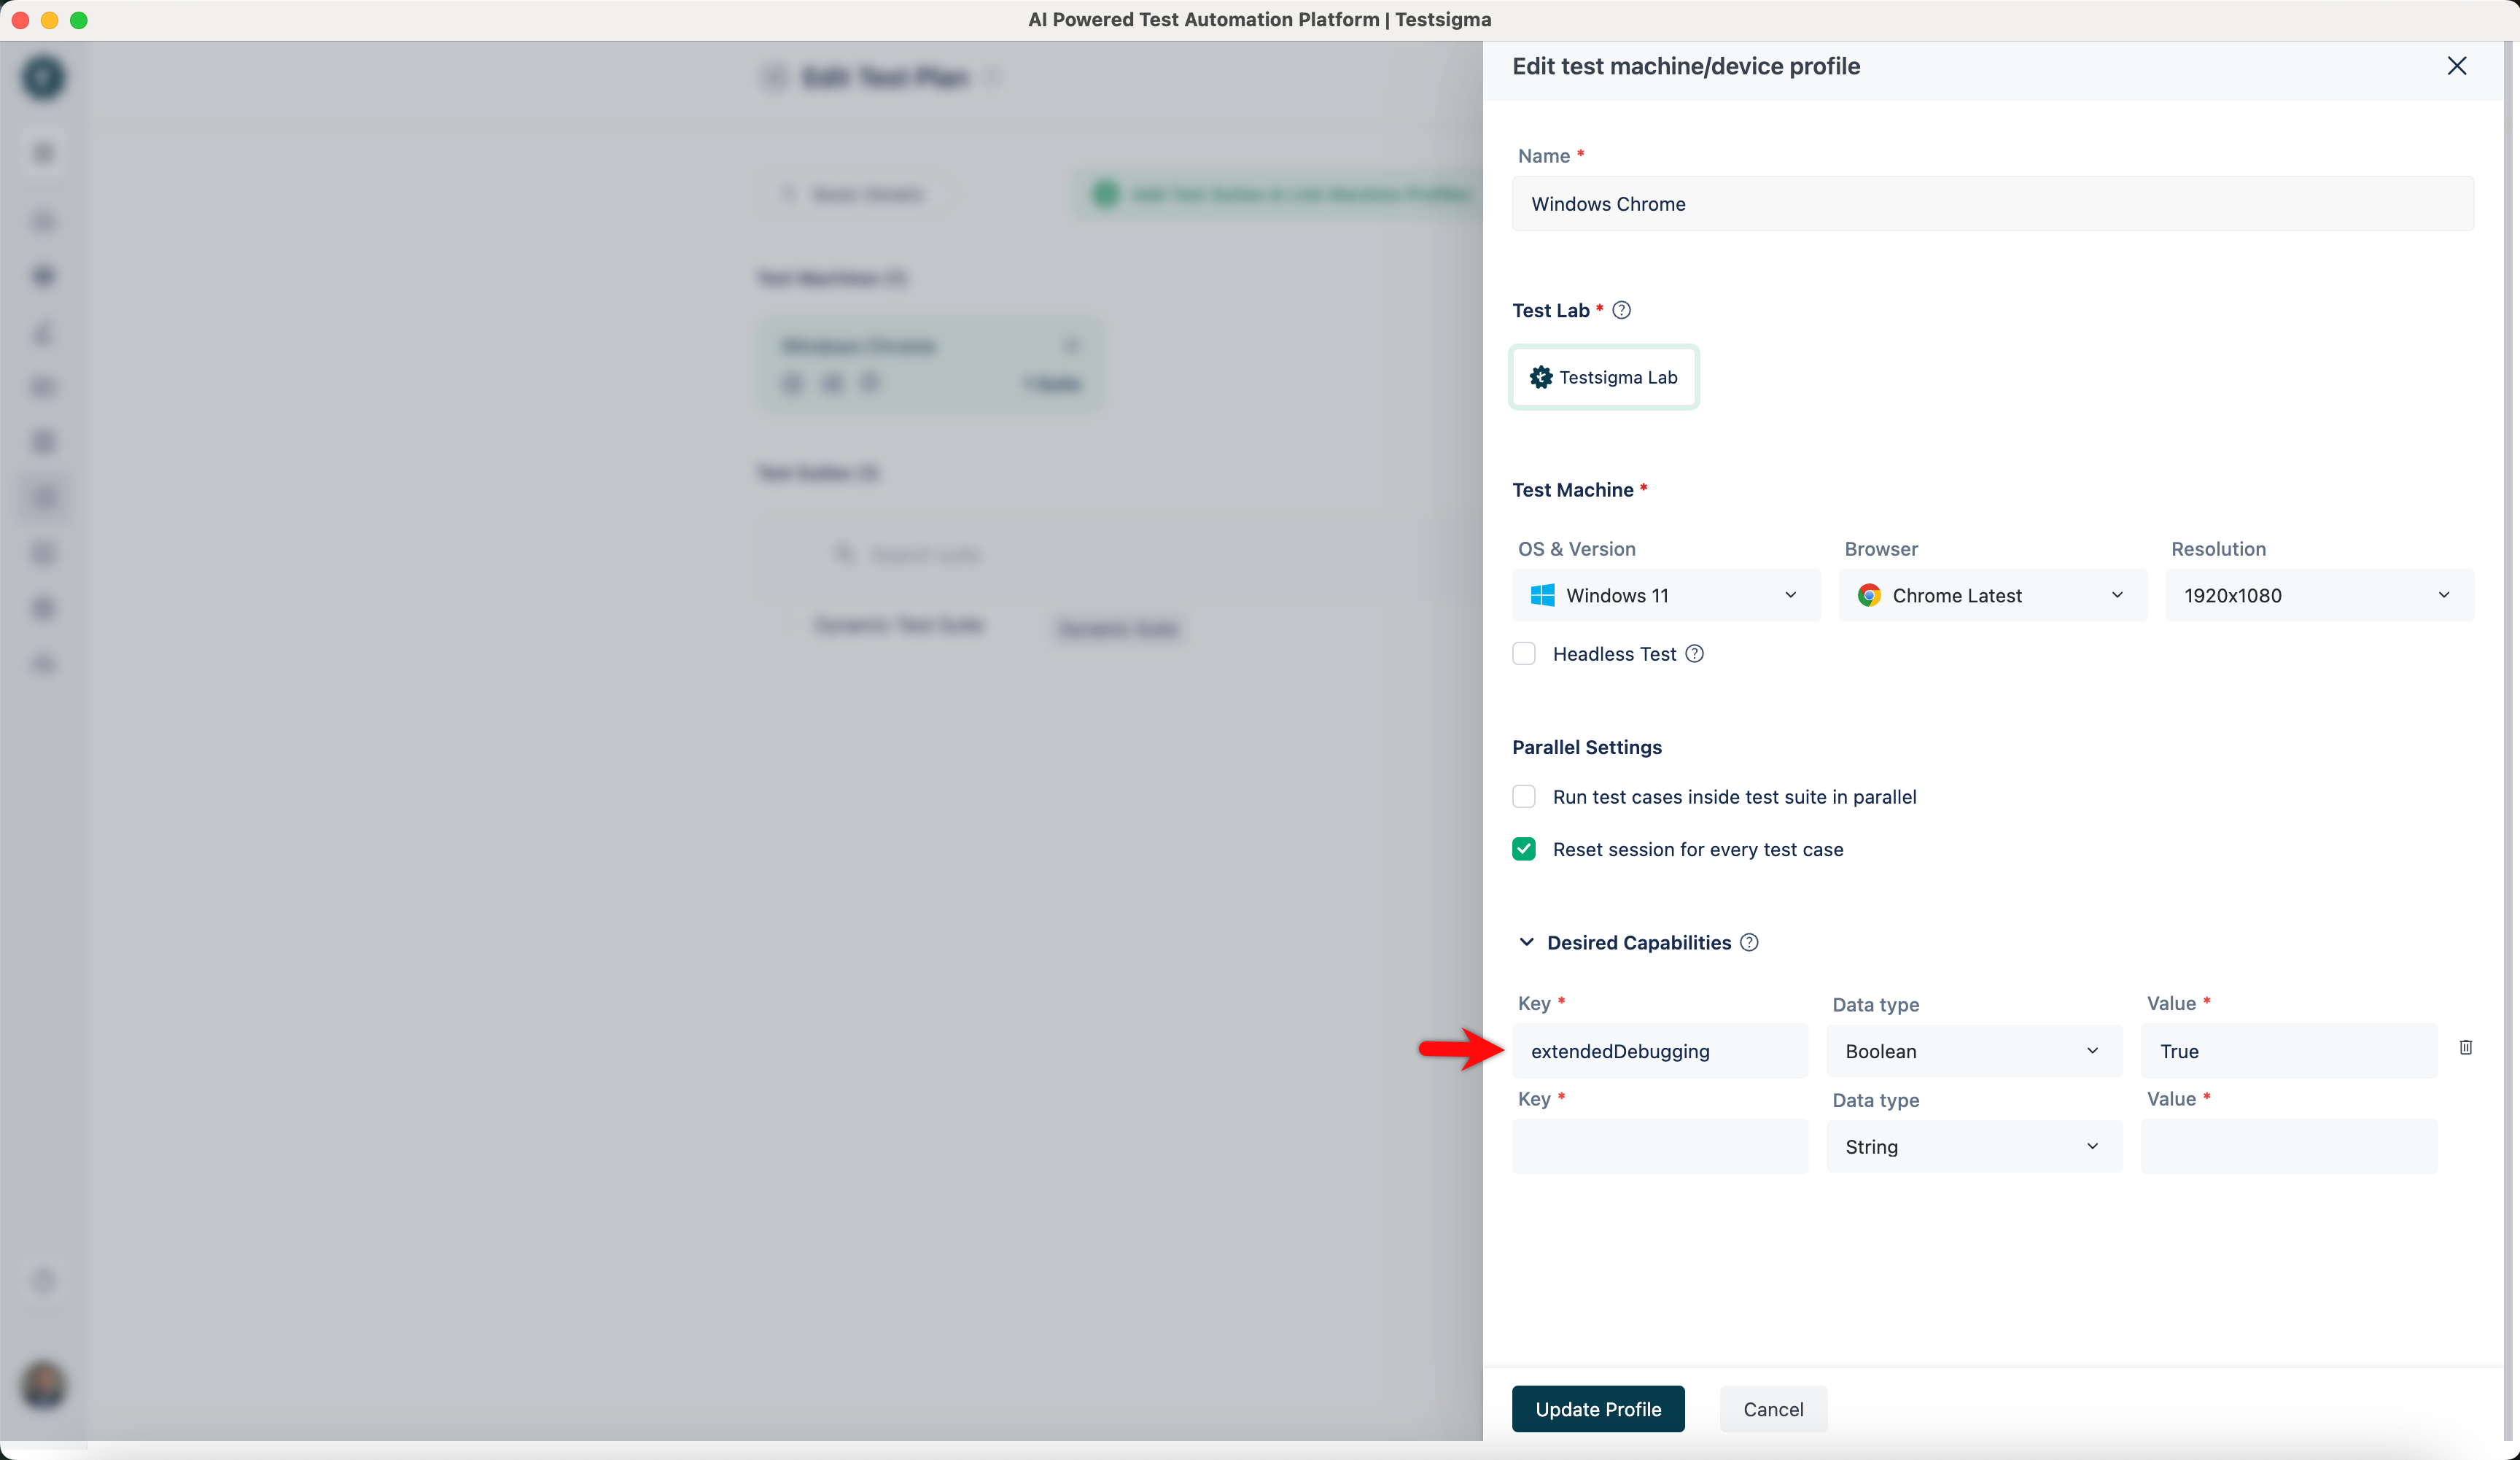
Enable Console Log in Test Plan
Follow these steps to enable Browser Console - Extended Debugging for a specific Test Plan in Testsigma:
- Navigate to the Add Test Suites & Link Machine Profiles tab on the Create/Edit Test Plan screen.
- Click Test Machine Settings for the desired test machine. The Edit Test Machine/Device Profile overlay screen will appear.
- Select the Test Lab and Test Machines, then click Desired Capabilities (Optional).
- Enter the Desired Capabilities Key, Data Type, and Value for the selected Test Lab Type, then click Update Profile.
View Console Logs on Result Page
After enabling Browser Console - Extended Debugging and running a test case or test plan, follow these steps to check the captured Browser Console Debug Logs:
- On the test execution results page, click Show Logs and navigate to the Console Logs section under the Logs tab.
- To analyze the Browser Console logs offline, click Download Log File in the top-right corner of the screen.
Want to contribute or report missing content?