

Results
Run Results reports what happened in a run, at test suite, test case, and machine level. Drill into a step to read its analysis, check its logs, and compare it against an earlier run.
Prerequisites
- A test plan has to have completed one run.
Find a run
Section titled “Find a run”The Run Results page lists every run. Search by name, or click Sort by to order the list by Title, Created Date, Updated Date, or Last Run, ascending or descending. Show Filters filters by Created By, Last Run Date, Created Date, Updated Date, and Labels.
Pick a level
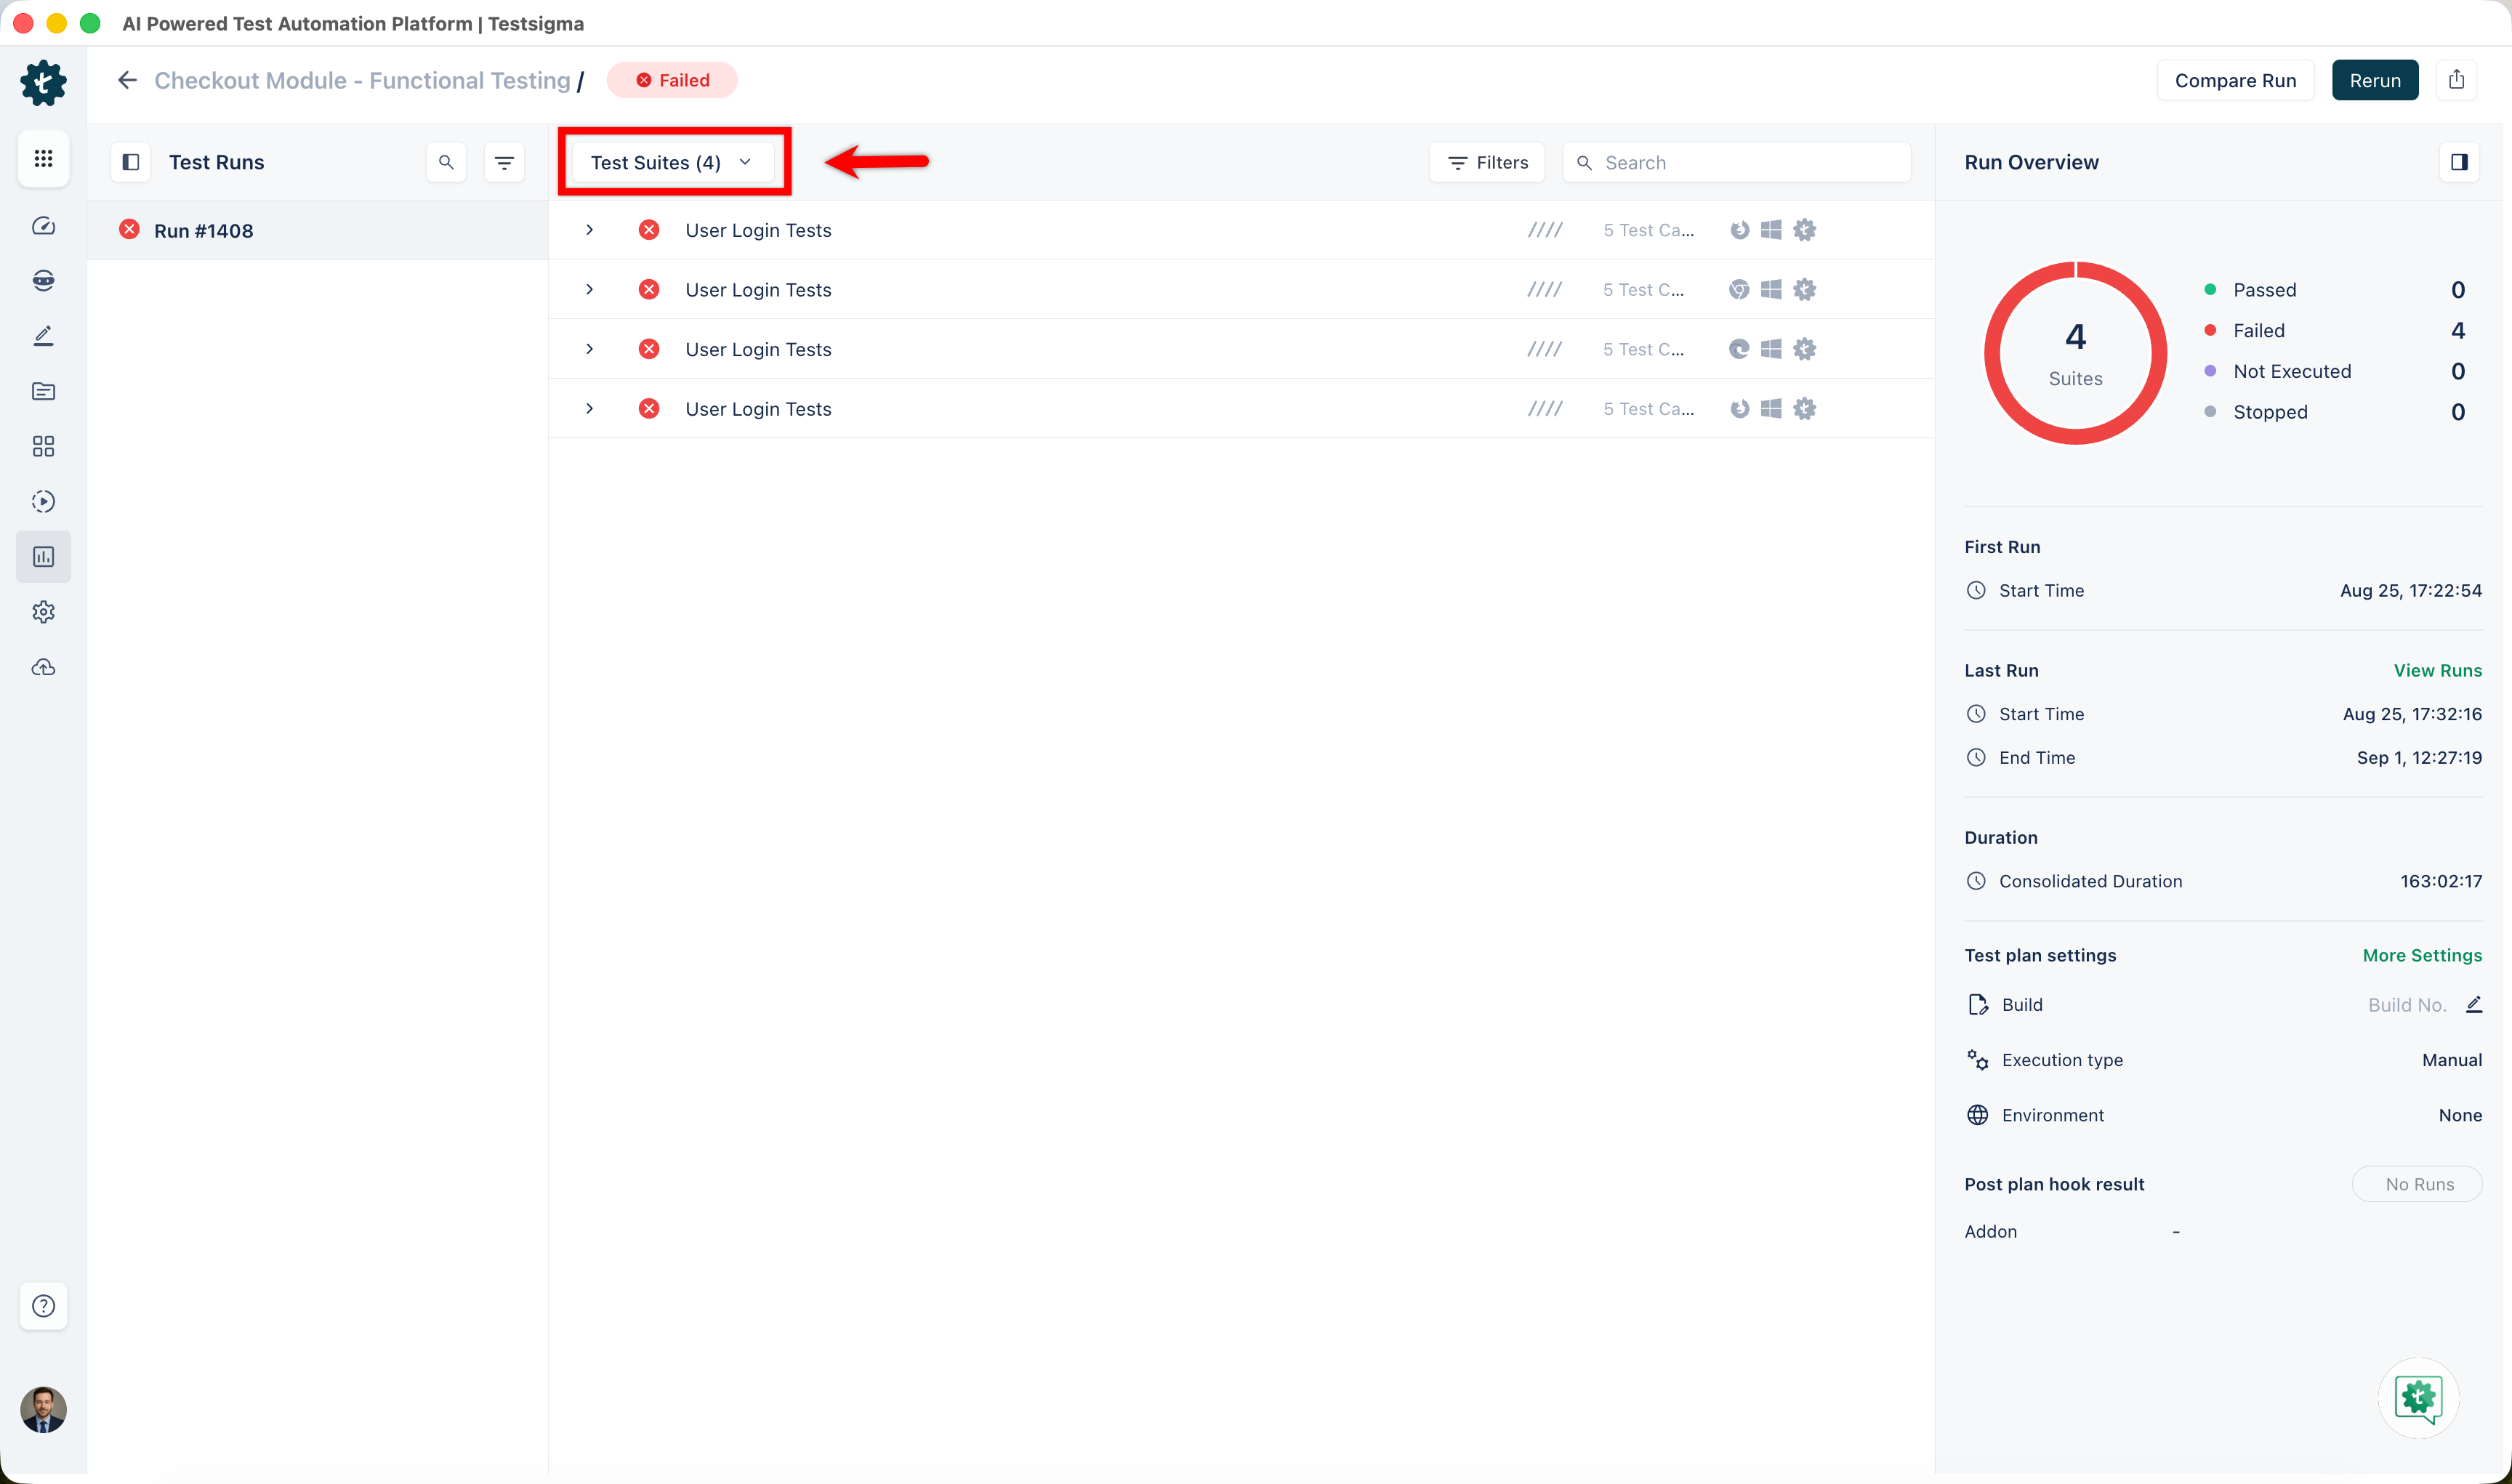
Section titled “Pick a level”Results open at test suite level. The dropdown switches between Test Suites, Test Cases, and Test Machines.
- Test Suites: expand a suite to see the test case results inside it. The parallel indicators on each row show how many suites run in parallel, and how many test cases run in parallel within each suite
- Test Cases: every test case from every suite, in one list. Hover over a failed one for a brief reason
- Test Machines: every machine in the plan. Click one to see the suites it contains
Filter within a run
Section titled “Filter within a run”Filters apply in 3 places on an open run.
- The Test Runs panel takes its own filters, through the Filters icon on the panel
- The test list takes filters at whichever level the dropdown is set to, through the Filters icon
- The donut chart in Run Overview filters by status when you click a segment, on top of any filter already applied
Read a test case result
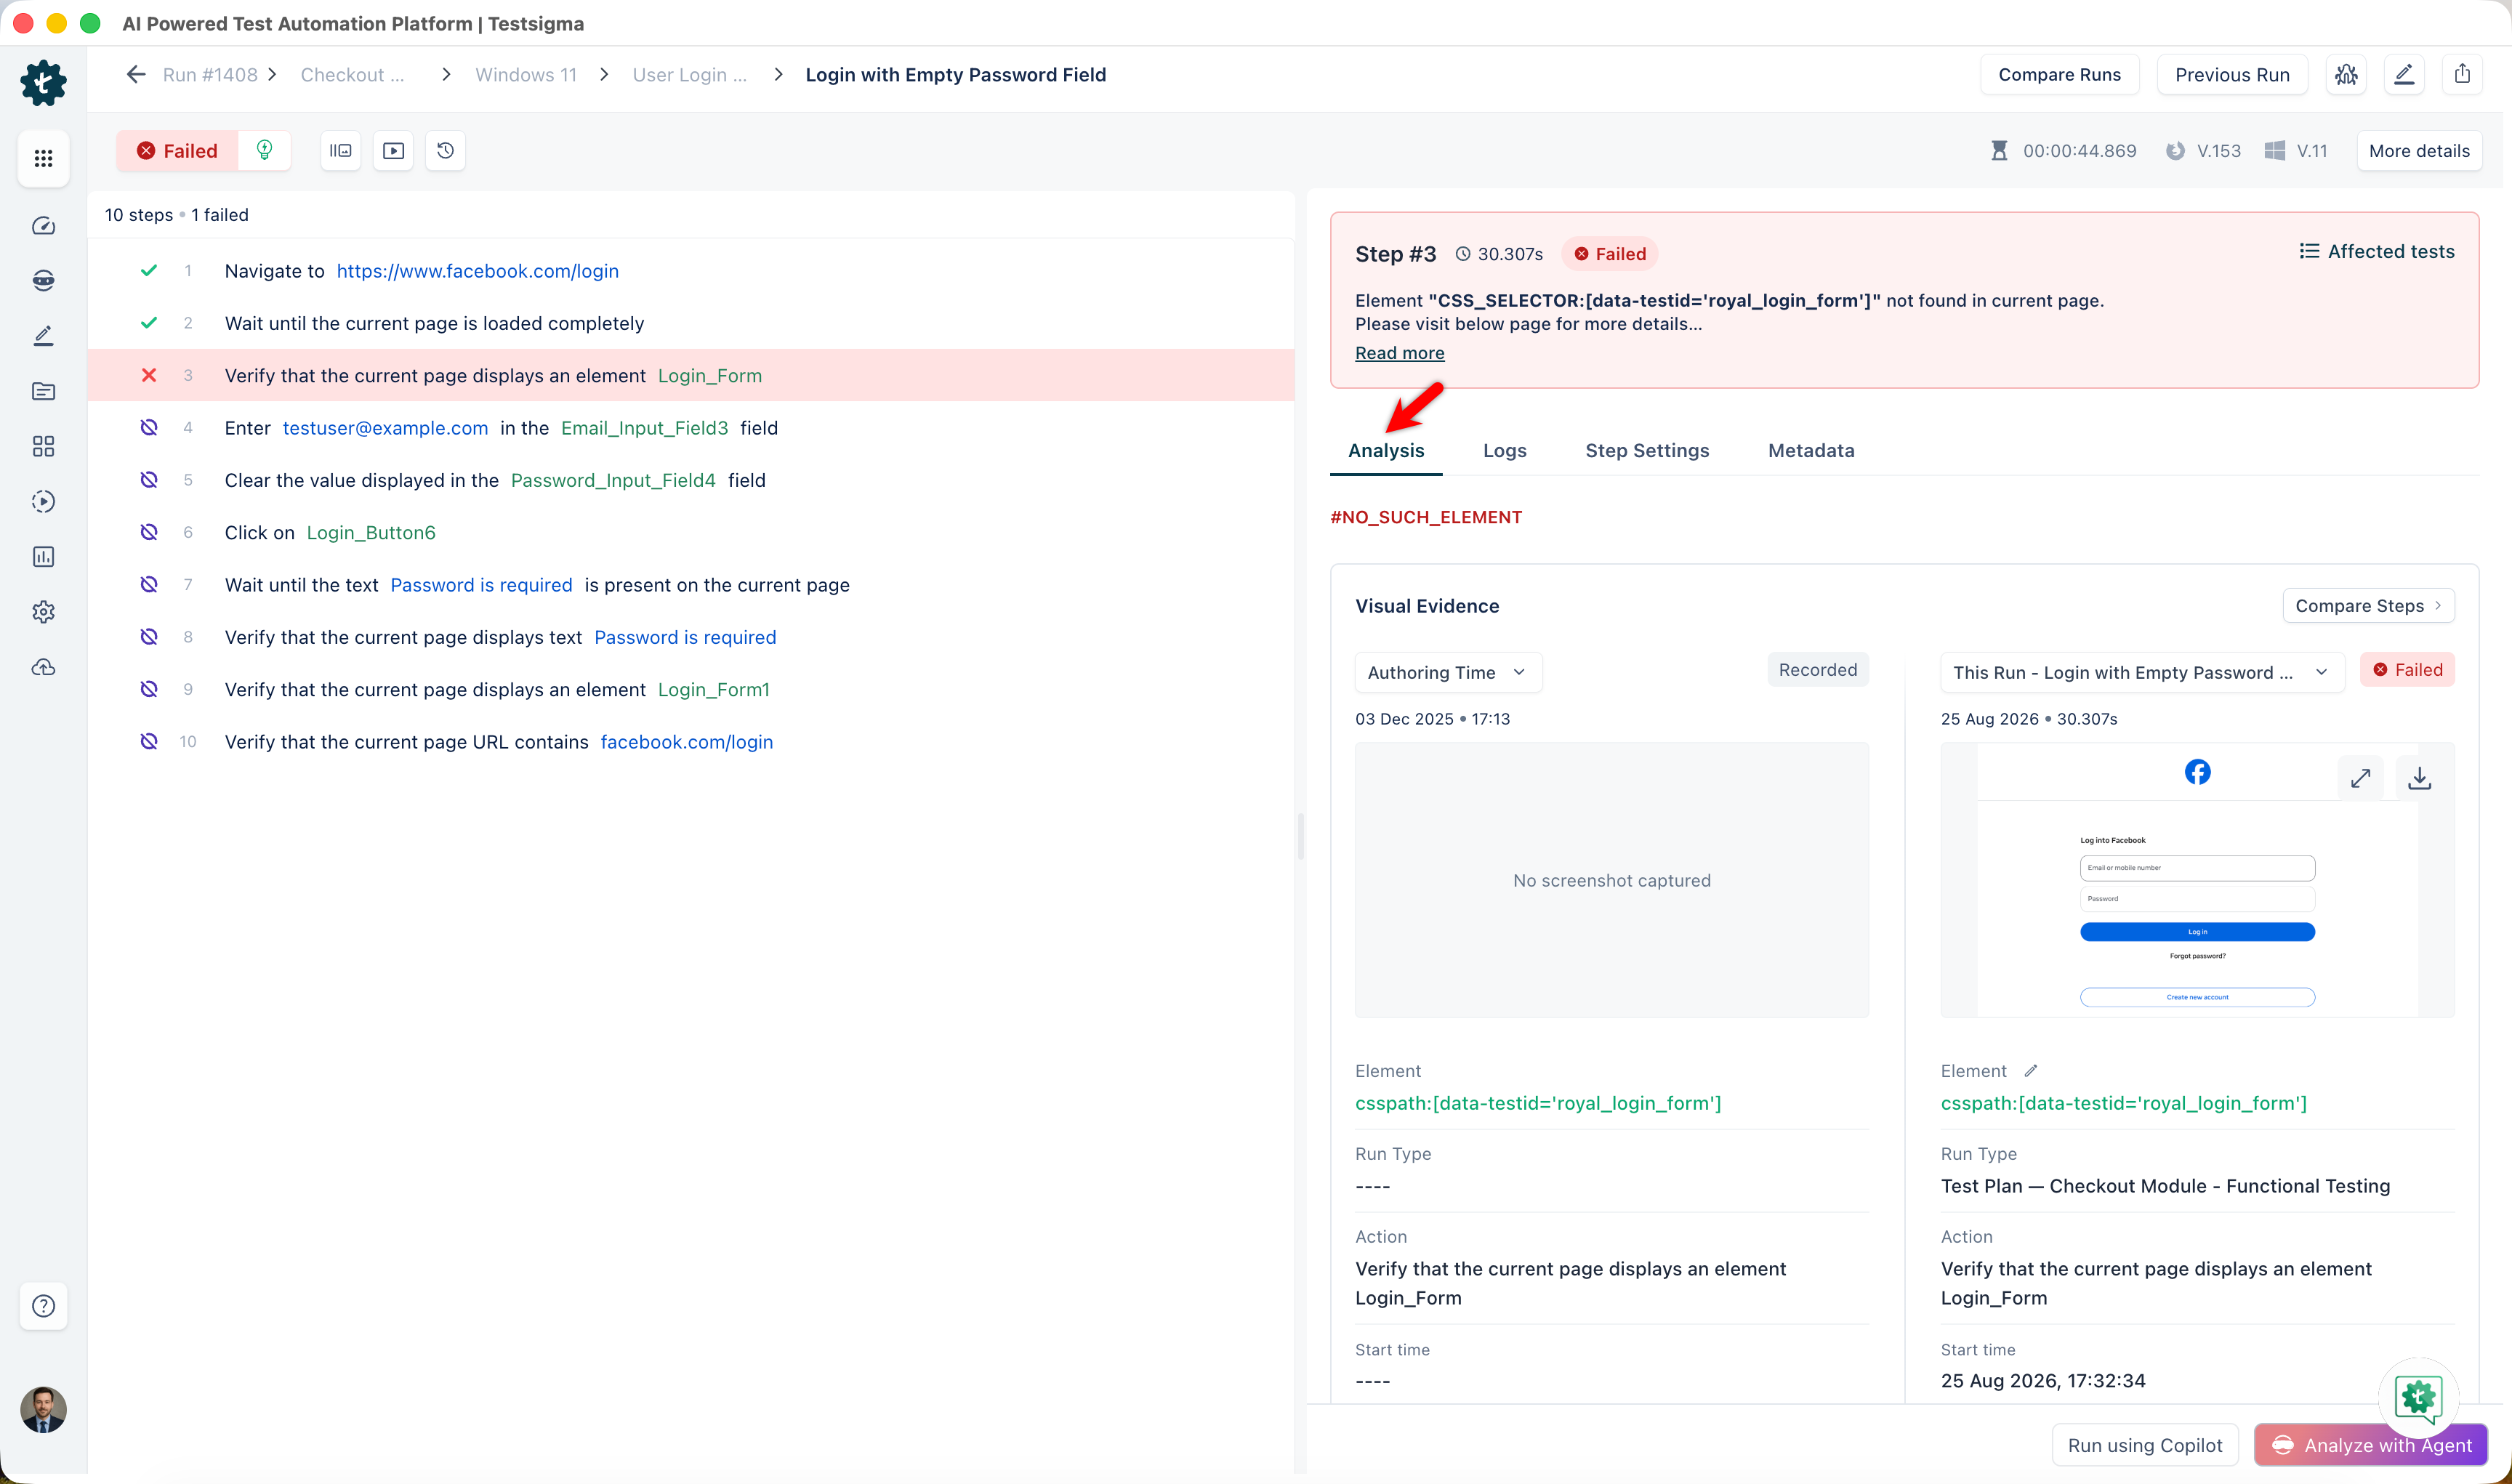
Section titled “Read a test case result”Click a test case to open it. The step list sits on the left, headed by the step count and the number of failed steps. Select a step to open its details on the right, and drag the divider to resize either pane.
The step header shows the step number, duration, status, and result message. A failed step shows the error message with a Read more link.
Two more controls sit alongside it:
- Affected tests opens Affected Instances, with counts across Test Cases, Step Groups, Test Suites, and Test Plans. This is what the element in this step is used by
- More details opens Test Case Overview, with the step breakdown across Passed, Failed, Not Executed, and Stopped, plus the run message and Machine Details
The step details tabs
Section titled “The step details tabs”Each step presents its details across 5 tabs.
| Tab | What it contains |
|---|---|
| Analysis | The step result summary, the Root cause block on a failed step, and the Visual Evidence section comparing the authoring screenshot against this run |
| Locators | The locators used for the step |
| Logs | Selenium, console, and network logs, for the step or the whole run |
| Step Settings | Maximum wait time, prerequisite, whether the step result is ignored, and whether visual testing is enabled |
| Metadata | Test data and its type, with the step ID and action |
Below the 2 panels, the Analysis tab lists the element, element name, run type, action, start time, duration, step level timeout, plan level timeout, error code, error message, test data type, and test data for each side of the comparison. Page source at the bottom holds the captured HTML for each side, as a downloadable file.
On a failed step, the tab opens with the error code, such as #NO_SUCH_ELEMENT.
See Debug for reading the logs and investigating a failure. For a root cause explanation and suggested fixes, click Analyze with Agent in the action bar. See AI agents.
Compare two runs
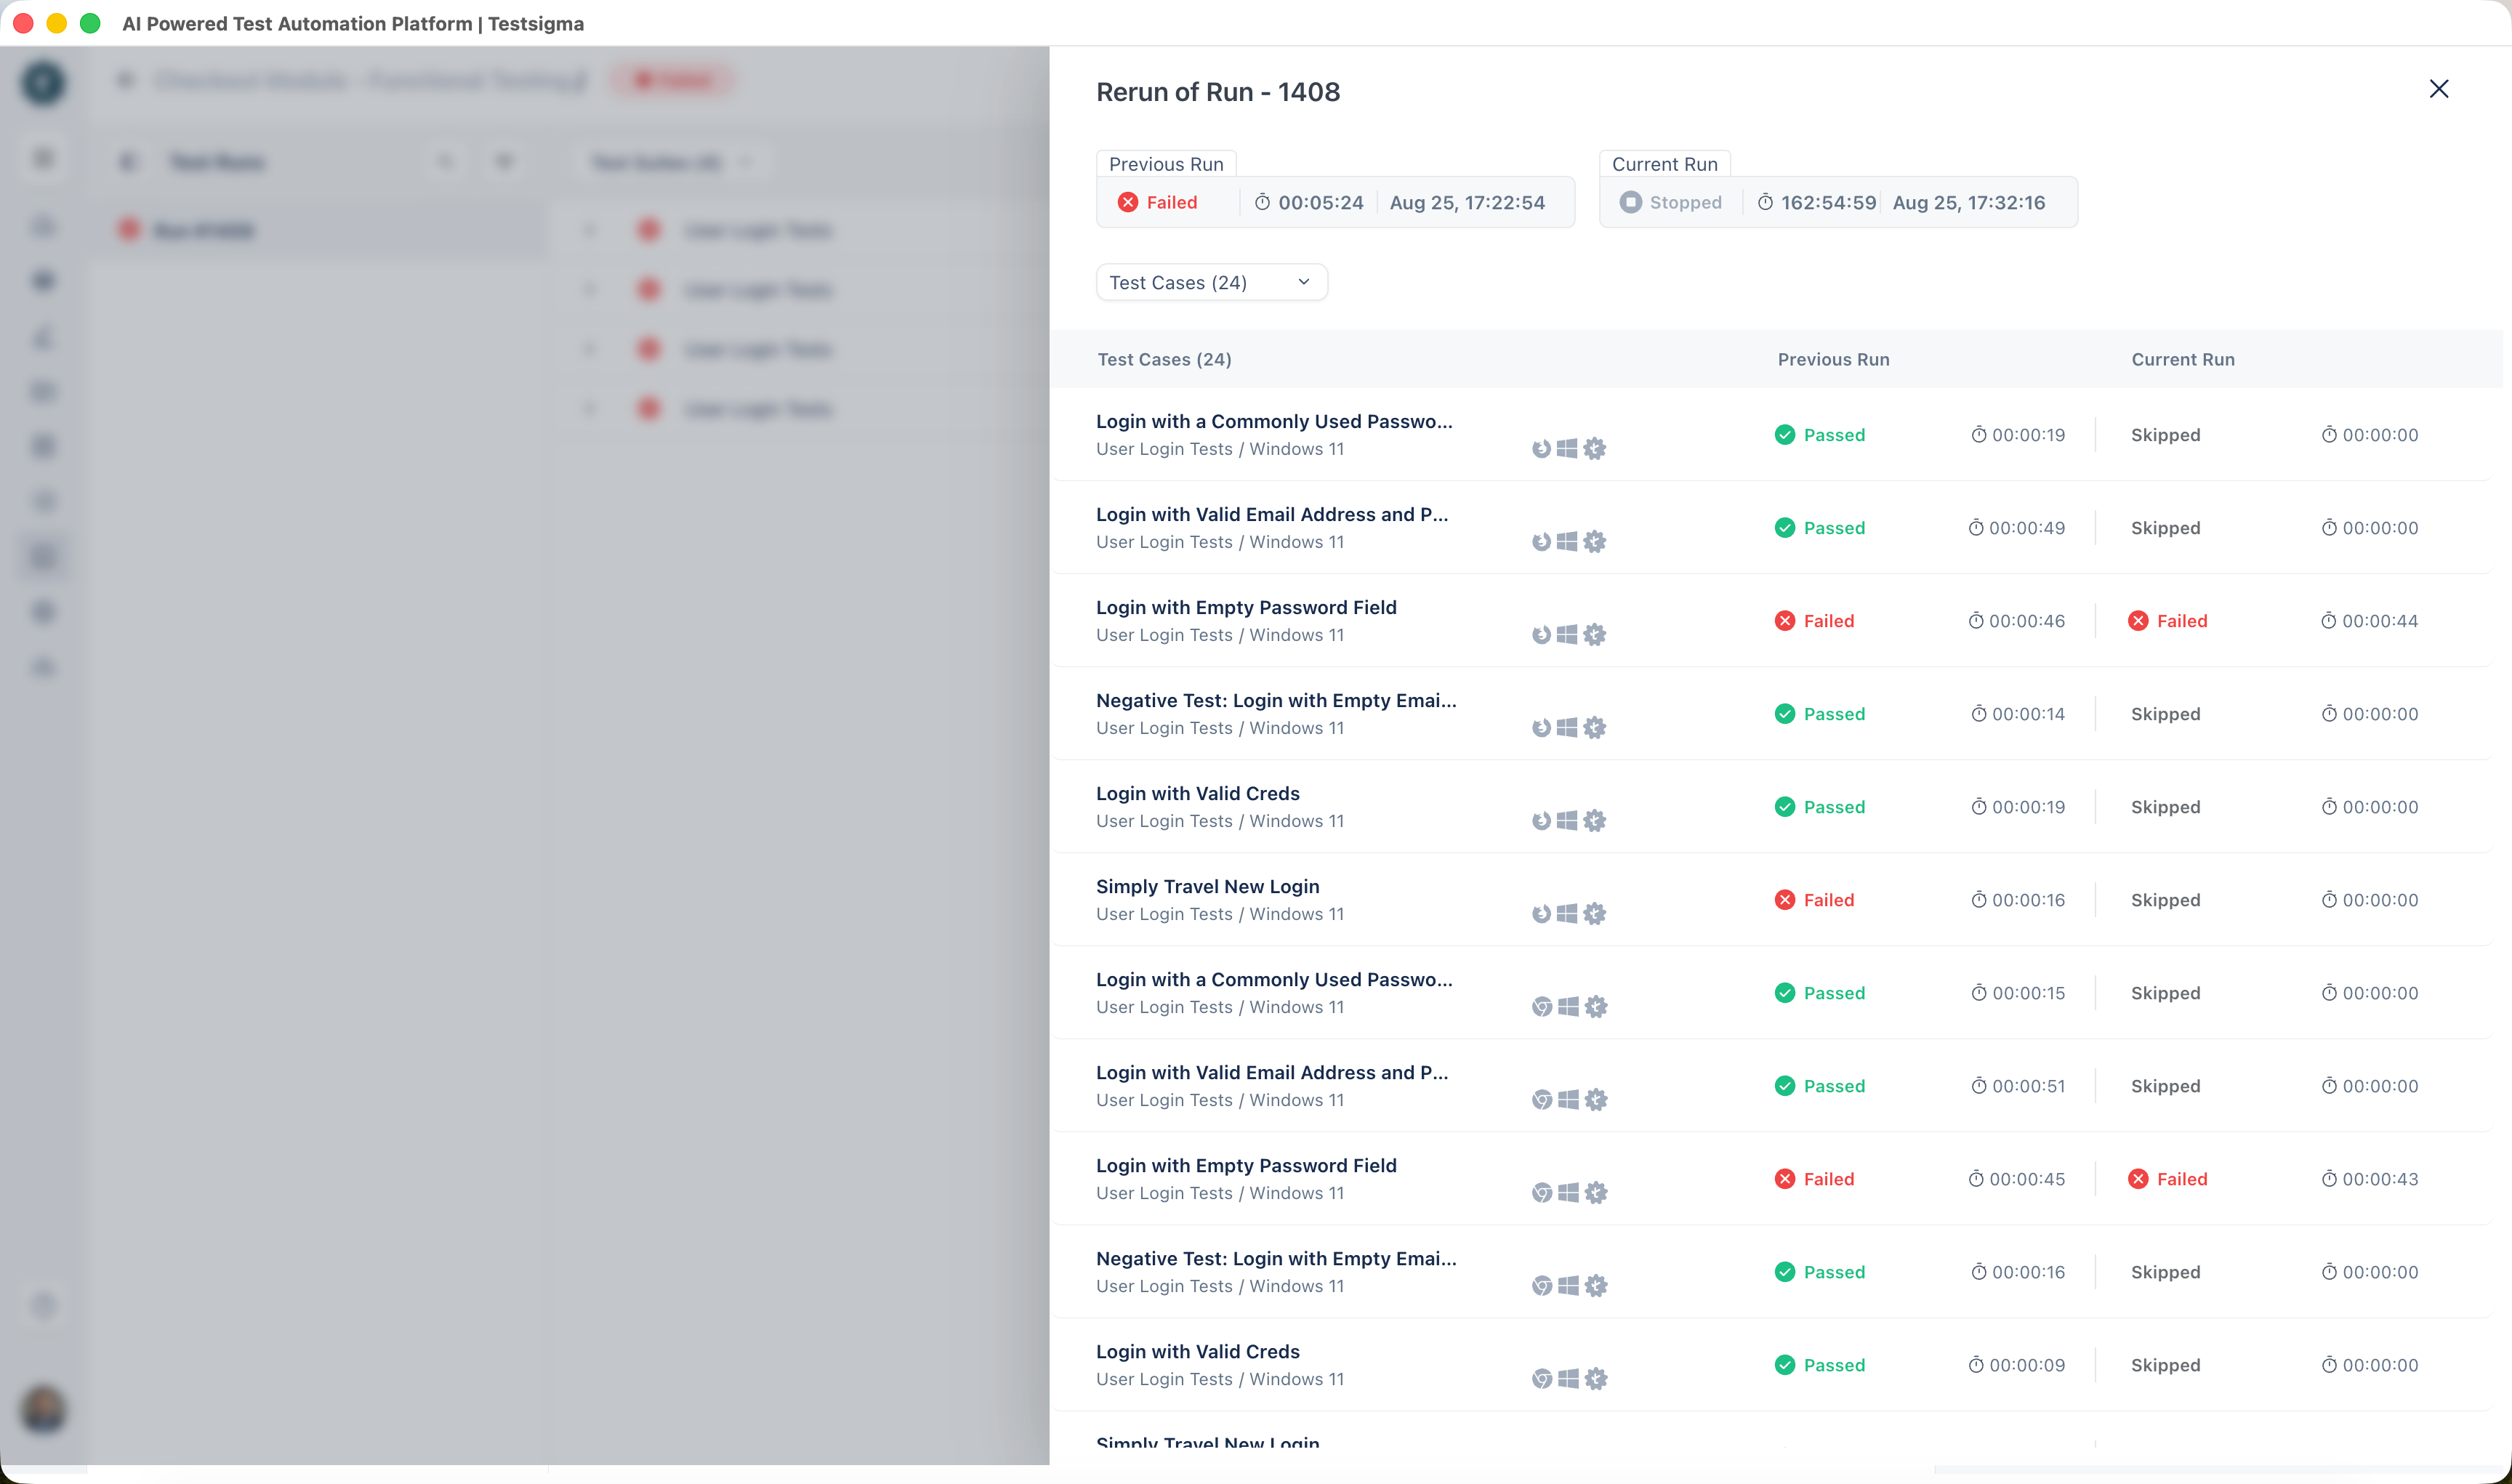
Section titled “Compare two runs”Comparing runs answers the question a single result cannot: what changed since this test last worked.
-
Click Compare Runs on the Test Case Results page.
-
Select a run from the list at the top of either panel.
Each panel shows the run’s duration, date, step count, and failed count, then every step with its own duration. The comparison spans the steps either side of the failure as well, because the step that reports an error is often not the step that caused it.
Compare a single step
Section titled “Compare a single step”-
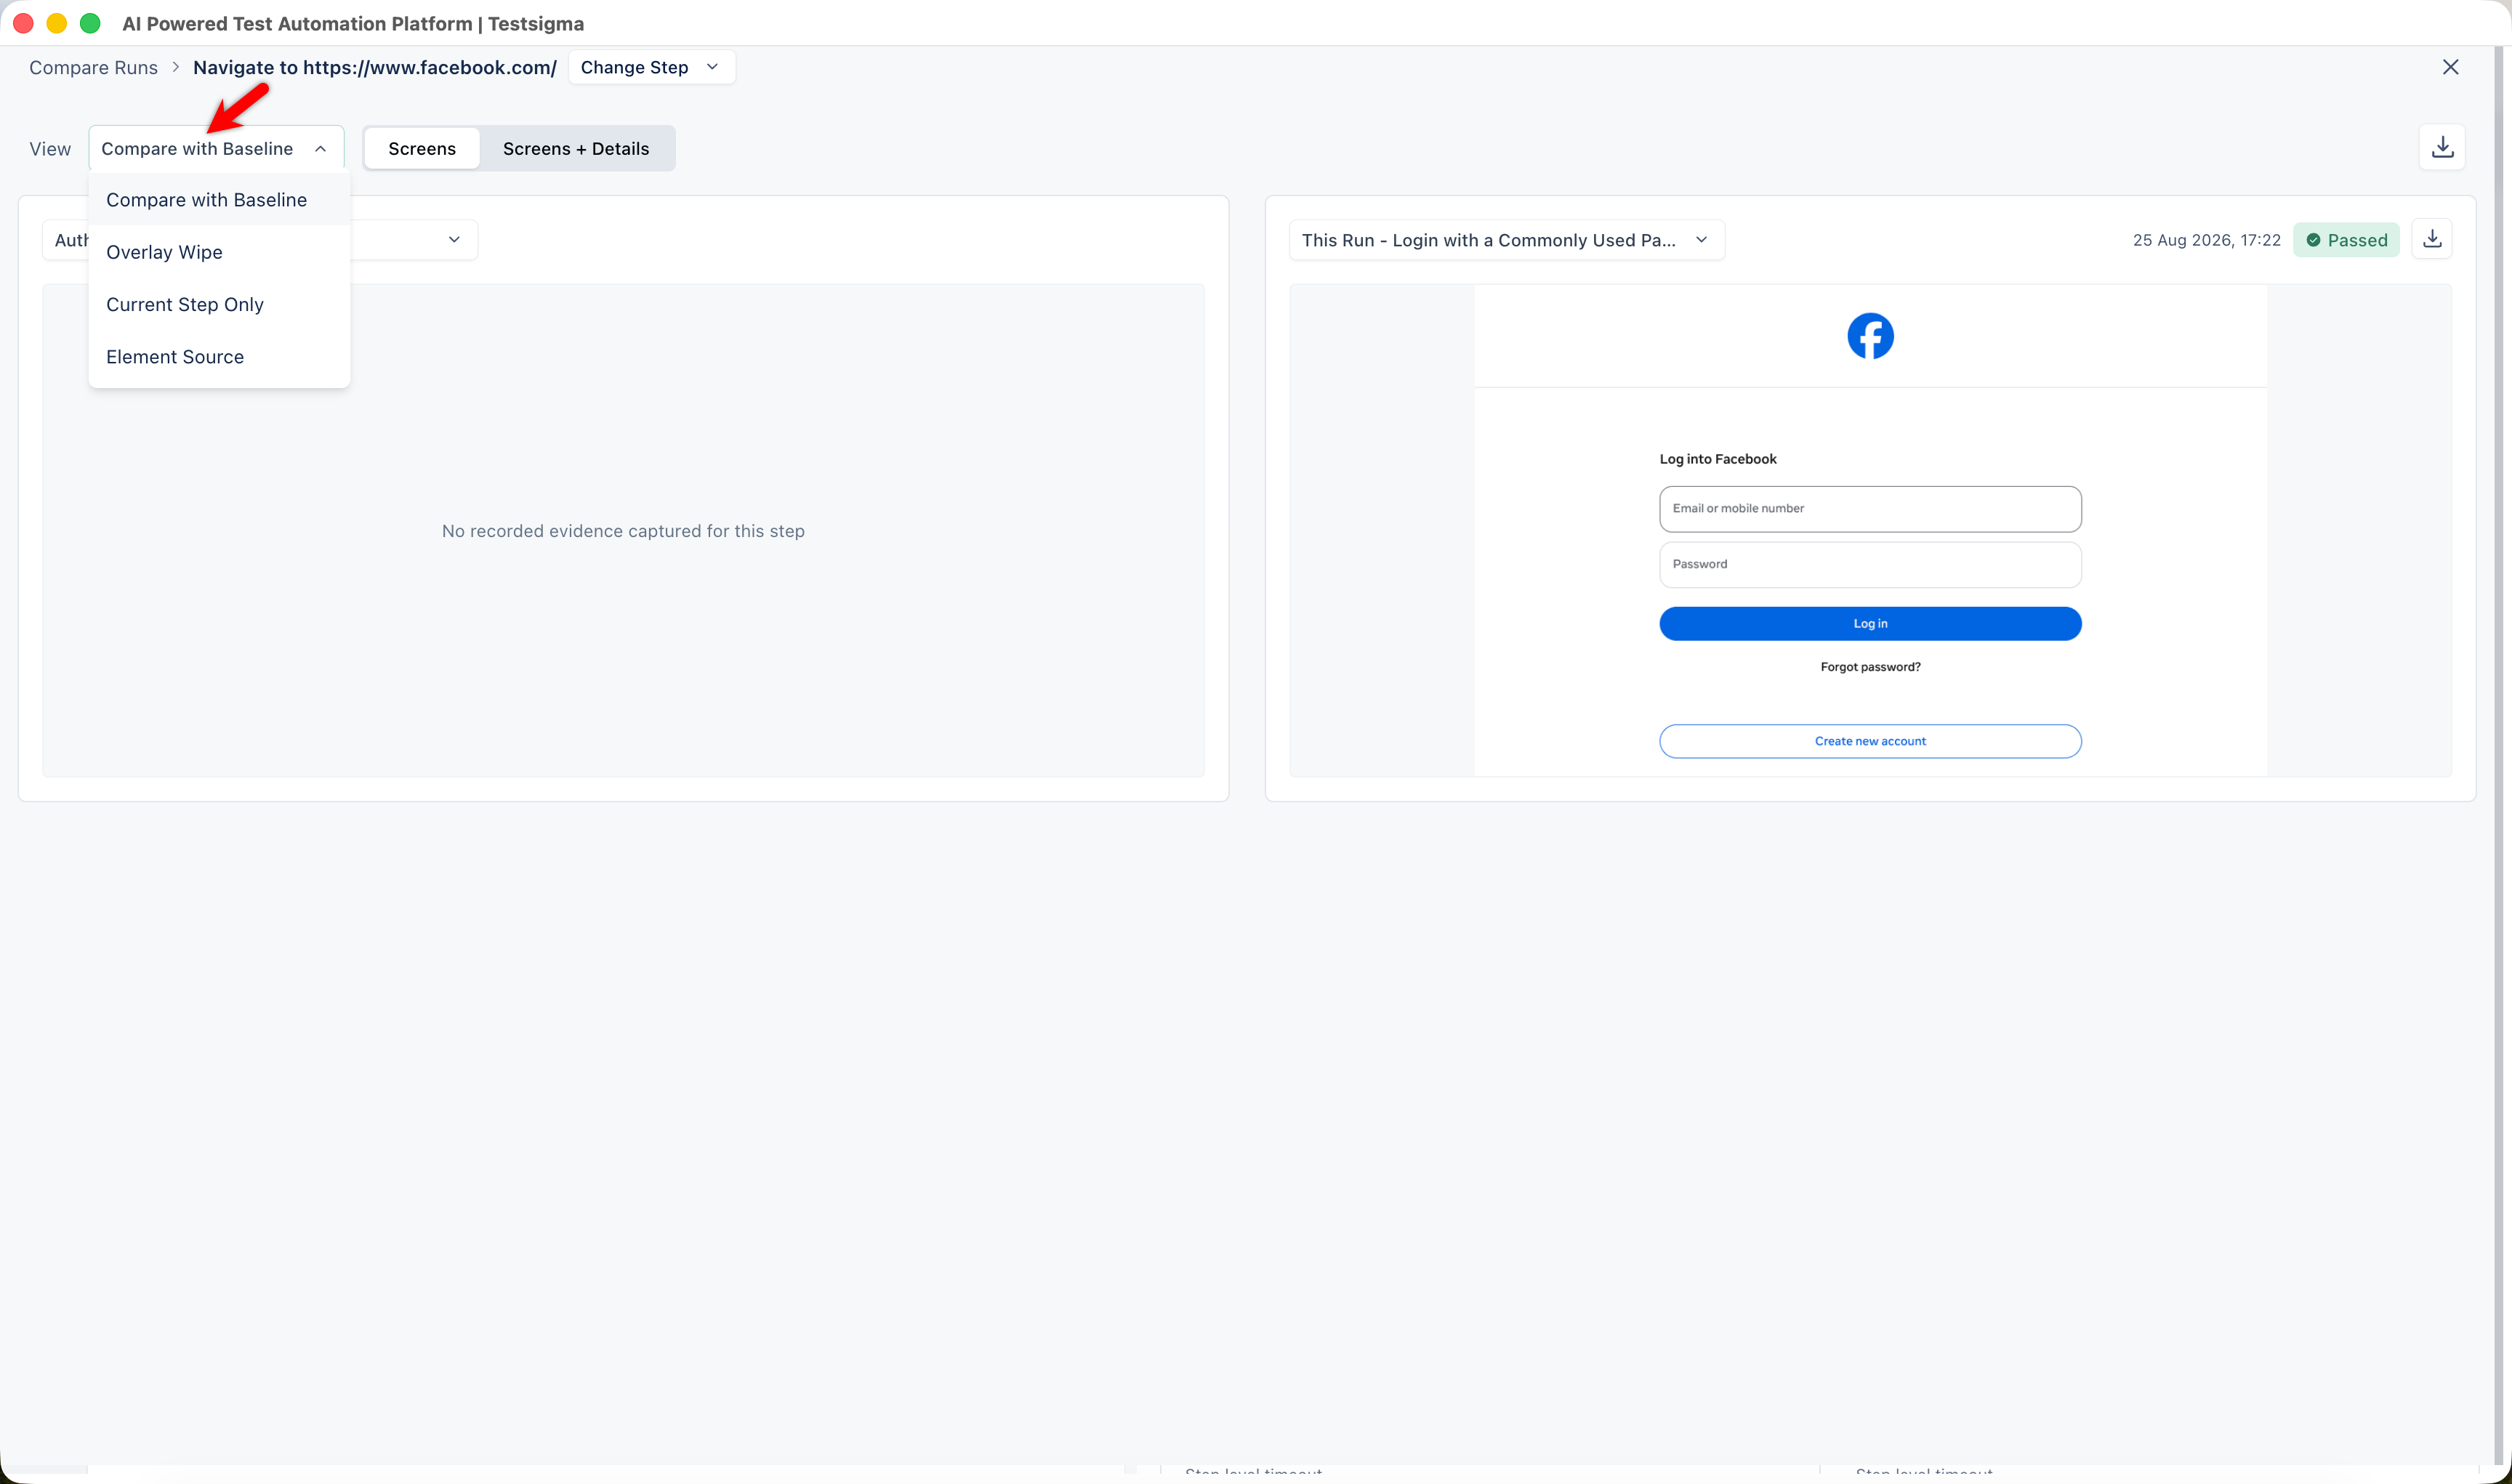
On the Analysis tab, in Visual Evidence, click Compare Steps. The step under comparison appears in the breadcrumb.
-
Select a mode from the View list.
Mode What it shows Compare with Baseline The baseline run and the current run side by side Overlay Wipe Both screenshots in one frame, with a divider to wipe between them Current Step Only The current run’s screenshot on its own Element Source A diff of the captured page source across the 2 runs, with the locator value for each Overlay Wipe loads the authoring capture and the execution capture into a single frame separated by a vertical divider. Drag the handle to wipe between them. Stacking the 2 makes a shifted control, a modal that did not close, or a reflowed layout visible at once, rather than something to find by comparing 2 panels.
-
Click Screens for screenshots only, or Screens + Details to show the step details beneath each one.
Screens + Details lists the run type, start time, duration, step level timeout, plan level timeout, error code, error message, element name, and locator for each run. A value that was not captured shows a dash.
-
Select a step from Change Step to compare a different one. Each entry shows the step number, name, duration, and status, including Not Executed for steps the run never reached.
-
Click the download icon to download the comparison artifacts.
Run overview
Section titled “Run overview”The Run Overview section summarizes the selected run at every level, showing the Last Run, Test Plan Settings, and Accessibility Test Overview.
View Runs lists all runs, More Settings opens the additional settings, and View Report opens the accessibility testing report.
Rerun from a result
Section titled “Rerun from a result”Select a different run in the Test Runs panel to see its results. Click Rerun to run the plan again, choosing:
- All Test Cases in the selected run
- All Failed Test Cases in the selected run
- Select Cases for Re-Run, to pick them yourself
Click Start execution to begin.
Watch the execution video
Section titled “Watch the execution video”A video of the run plays on the test case result, so you can watch what the test did rather than infer it from screenshots. Open the test case result and play the video alongside the step list.
Reach it from Ad-Hoc Runs in the utility panel as well, through View Details on the run.
Export a report
Section titled “Export a report”Click the Export icon and select PDF, MS Excel, or JUnit. A PDF opens a dialog for its screenshot options, JUnit downloads immediately, and Excel arrives as an emailed link.
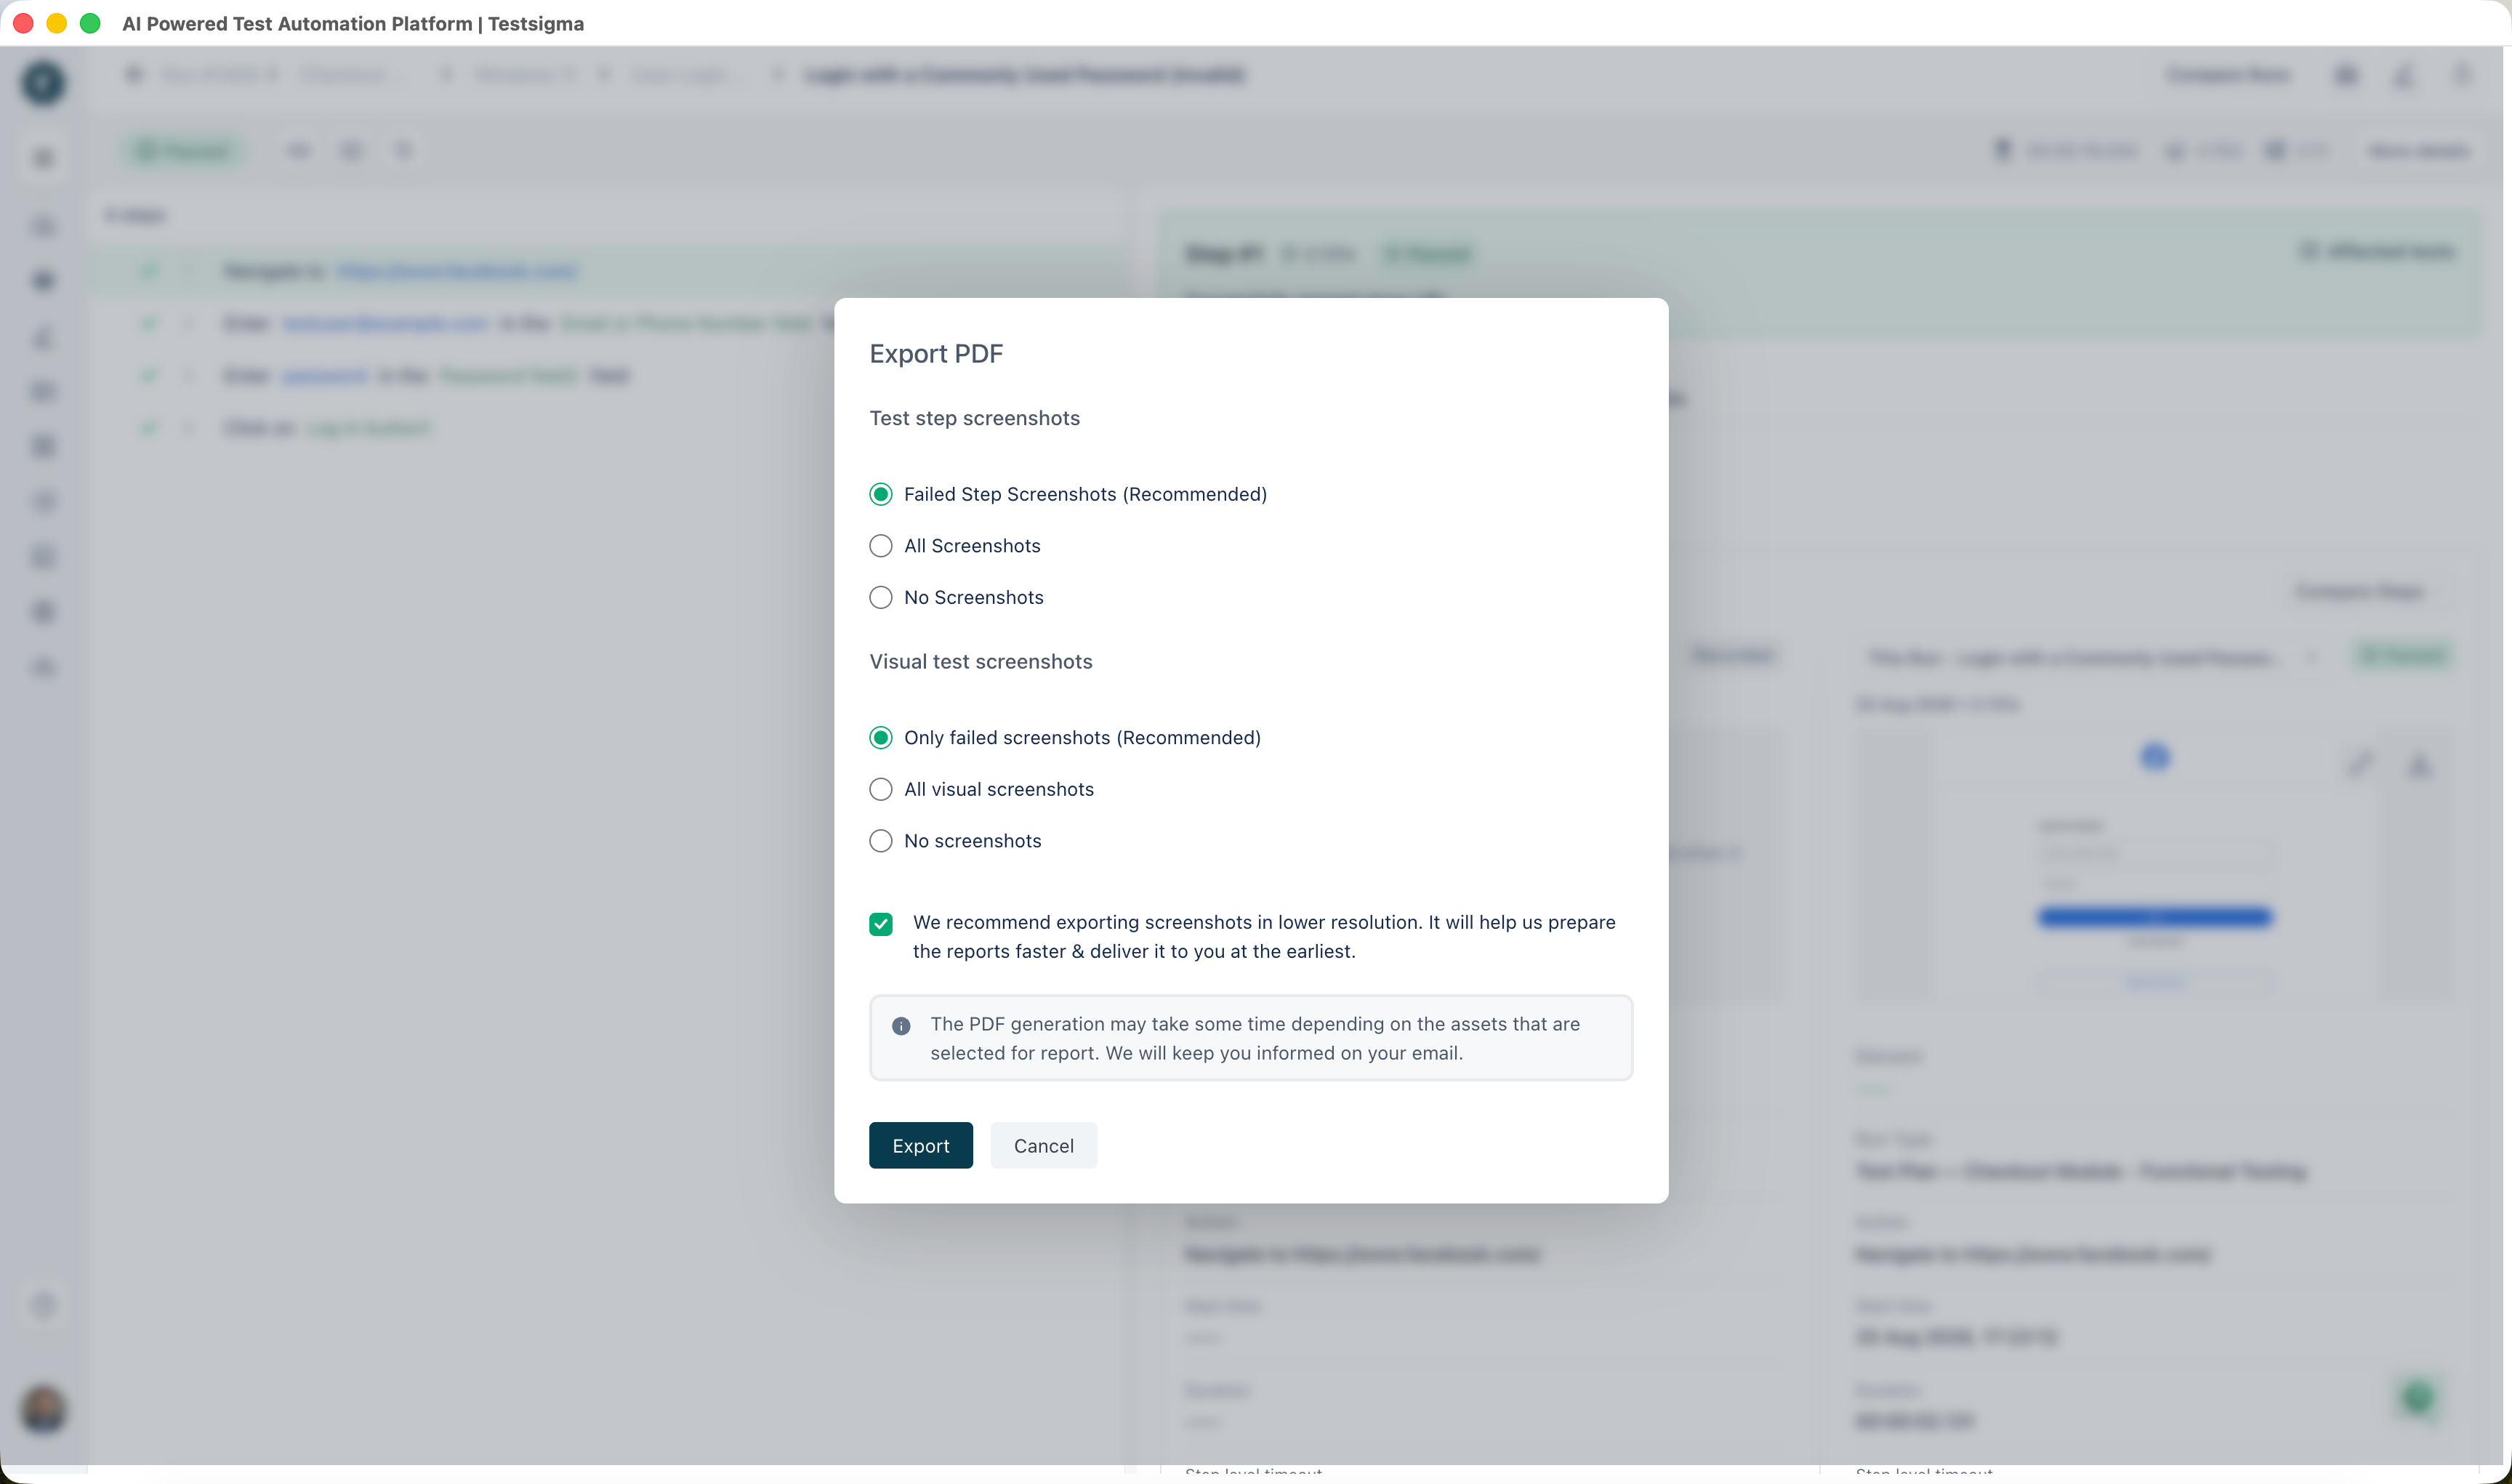
An exported report carries the names things had when the run executed, so exporting the same run twice reproduces the same document. See Reports for each format in full, and for the Allure and custom PDF reports generated outside the application.
Keyboard shortcuts
Section titled “Keyboard shortcuts”| Action | macOS | Windows |
|---|---|---|
| Test case level | Option + C | Alt + C |
| Test suite level | Option + S | Alt + S |
| Test machine level | Option + M | Alt + M |
| Run history | Option + H | Alt + H |
| Filters | Option + F | Alt + F |
| Run overview | Option + O | Alt + O |
Renamed and deleted items
Section titled “Renamed and deleted items”The Run Results page shows values as they were when the run executed. Renaming or deleting a test plan, test suite, test case, environment, test machine, or test data profile does not change what an earlier run displays.
User names are the exception. A report always shows a user’s current name, so renaming a user updates reports that already exist.
Was this page helpful?
Thanks for the feedback.