

Debug
When a step fails, the results page carries everything needed to work out why: the error, the screenshots either side of the failure, the logs, and what else depends on the element. This is the order to work through it in.
Open the failing step
Section titled “Open the failing step”-
Go to Run Results and click the test plan.
-
Click the test case you want to investigate.
-
Select the failed step from the step list on the left.
The list is headed by the step count and the number of failed steps, and each step carries an icon showing whether it passed, failed, or was not executed. Drag the divider between the list and the details pane to resize either side.
The step header shows the step number, duration, status, and error message, with Read more for the full message. The details pane carries the Analysis, Locators, Logs, Step Settings, and Metadata tabs.
Read the analysis
Section titled “Read the analysis”The Analysis tab opens with the error code, such as #NO_SUCH_ELEMENT. Visual Evidence then places the screenshot captured at authoring time next to the one captured in this run.
Below the panels, the tab lists the element, element name, run type, action, start time, duration, step level timeout, plan level timeout, error code, error message, test data type, and test data for each side. The icons on a screenshot expand or download it.
Page source at the bottom holds the captured HTML for each side. Click the file name to open it, or the download icon to save it.
Explain the failure
Section titled “Explain the failure”Testsigma can read the step’s error, screenshot, page source, and heal attempts, and explain what broke.
-
Find the Root cause card on the Analysis tab.
-
Click Explain this failure.
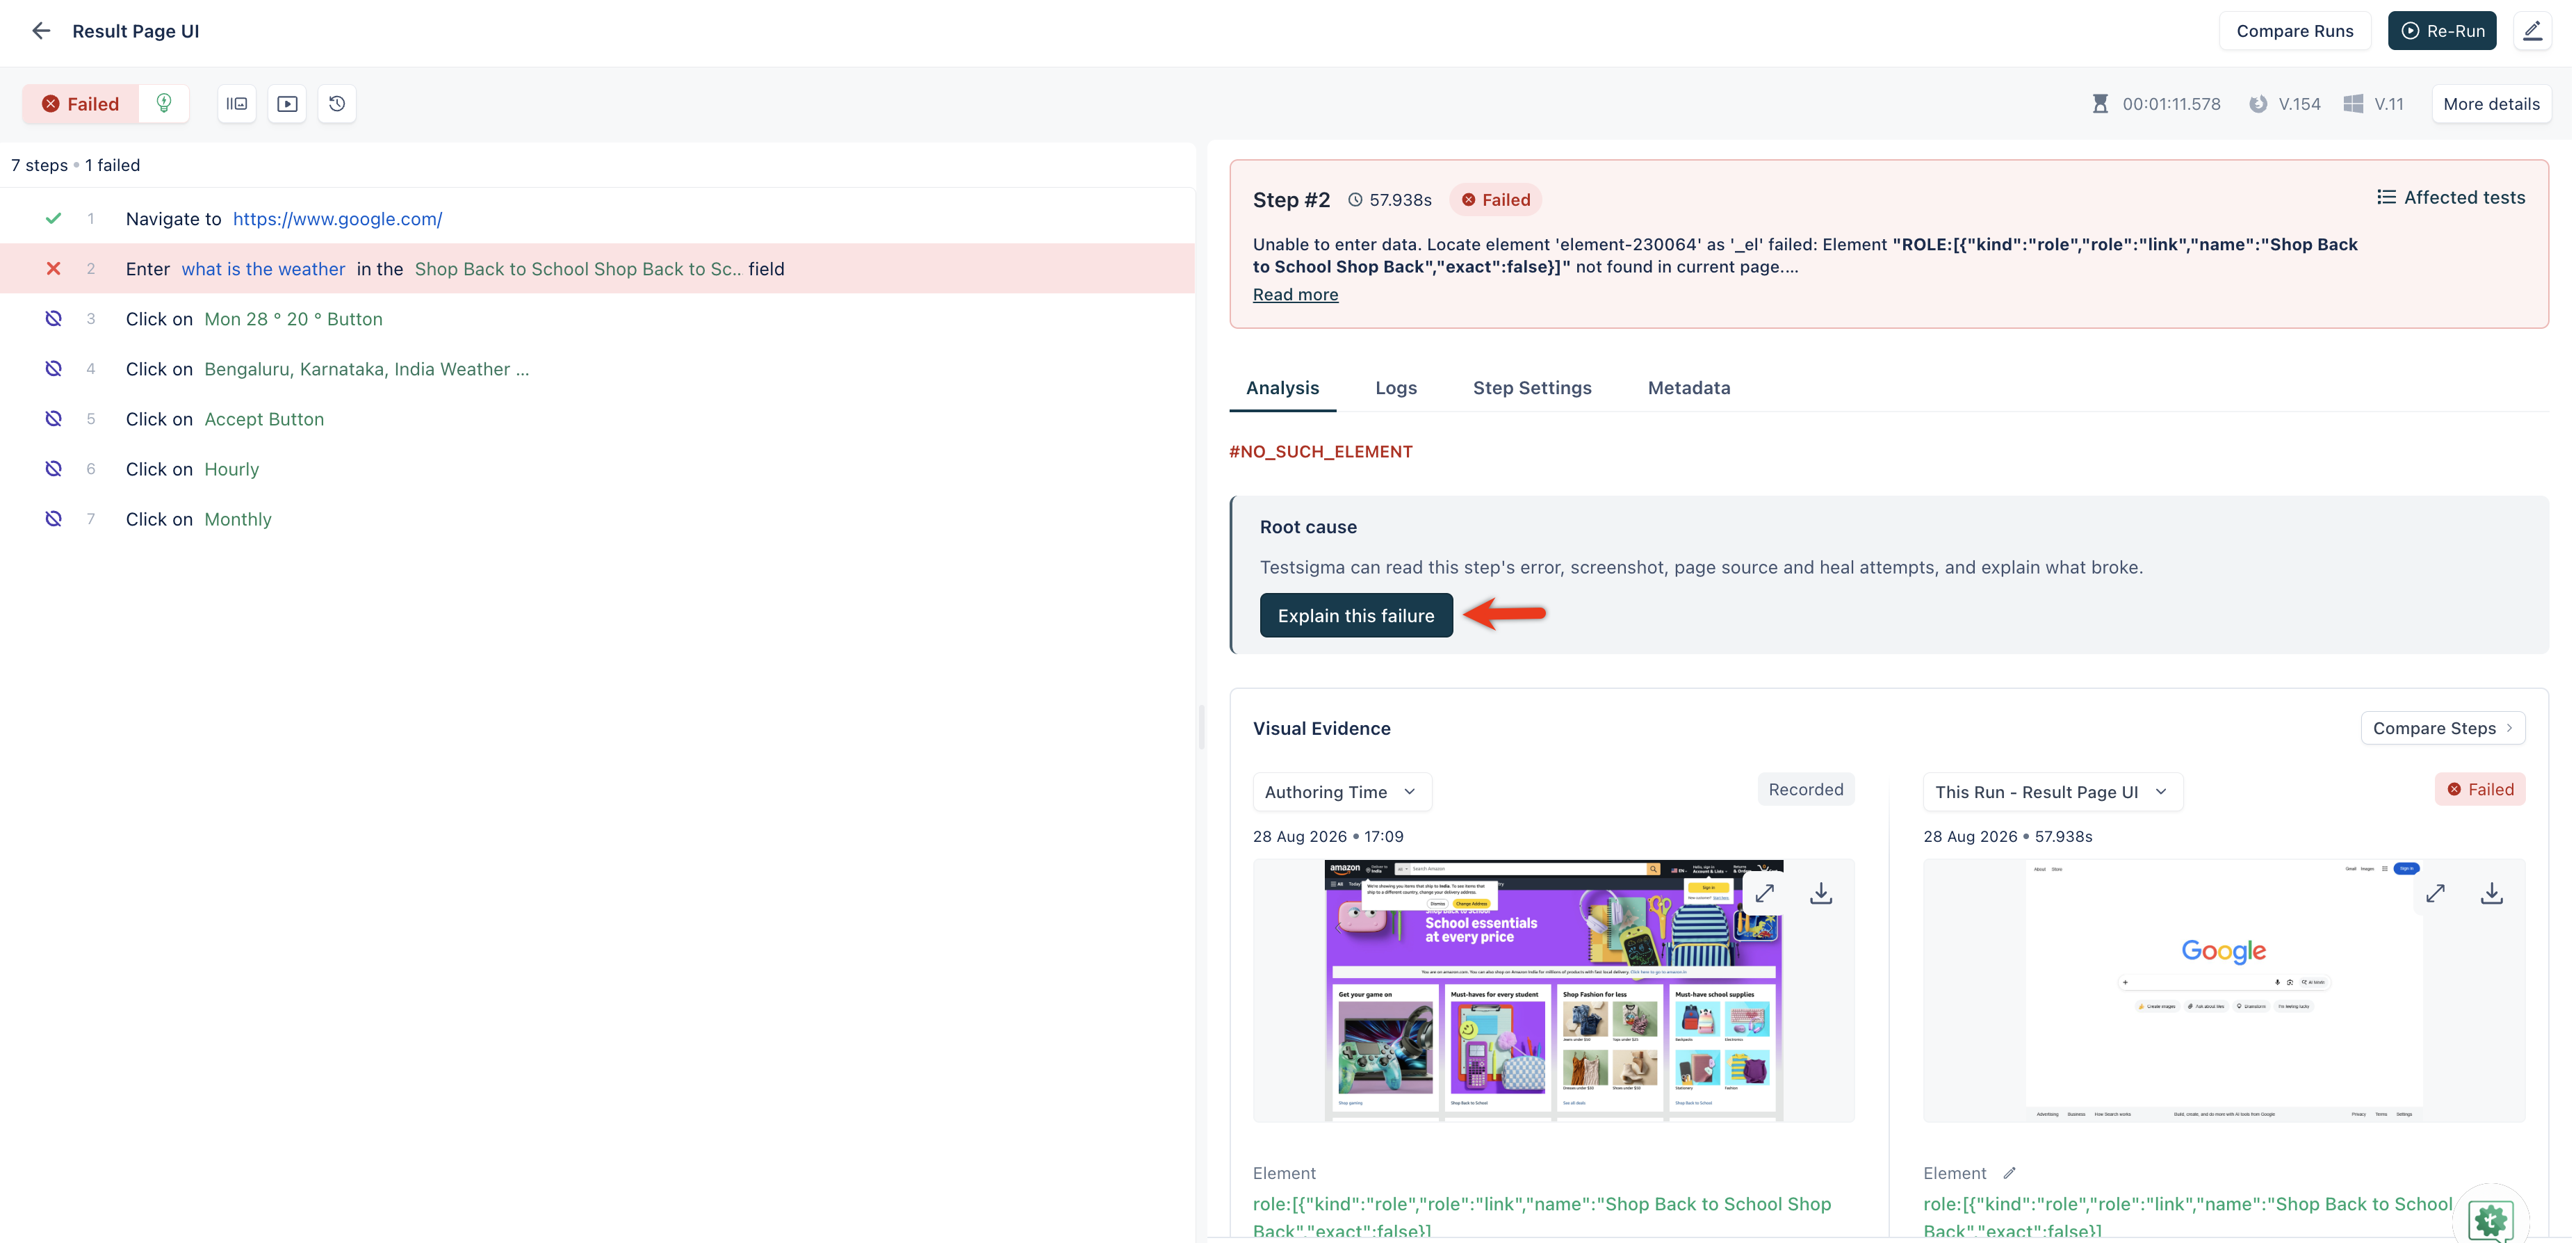
The explanation opens with a one-line summary of what failed, such as Step failed: no Shop Back to School link on Google homepage, followed by the reasoning and a recommended change. Read less collapses it.
Check the logs
Section titled “Check the logs”-
Open the Logs tab.
-
Select Selenium, Console, or Network.
-
Use the scope list to switch between This step and the whole run.
-
Click Jump to error to move to the first error in the log.
-
Click the download icon to save it.
Network logs are captured only when they are switched on for the test machine, and they arrive once the lab finishes uploading them. Until then the Network tab reads No network log was recorded for this run.
Check whether the step was healed
Section titled “Check whether the step was healed”When auto-healing resolves a locator mid-run, a banner above the step list reports how many steps were healed, and the Analysis tab shows a Healed this step card with Approve as Primary and Ignore.
A healed step reports Passed, because the step completed. See Healer.
Compare against an earlier run
Section titled “Compare against an earlier run”Comparing a failing step against a run that worked shows what changed. Two entry points:
- Compare Runs in the page header compares the whole test case across 2 runs, step by step
- Compare Steps in Visual Evidence compares the current step alone, with the screenshot and element source modes
Comparison spans the steps either side of the failure as well. See Results.
Check what else the element affects
Section titled “Check what else the element affects”When an element causes a failure, check which other tests depend on it before you fix it.
-
Click Affected tests in the step header.
-
Review each tab in the Affected Instances panel: Test Cases, Step Groups, Test Suites, and Test Plans, each with a count.
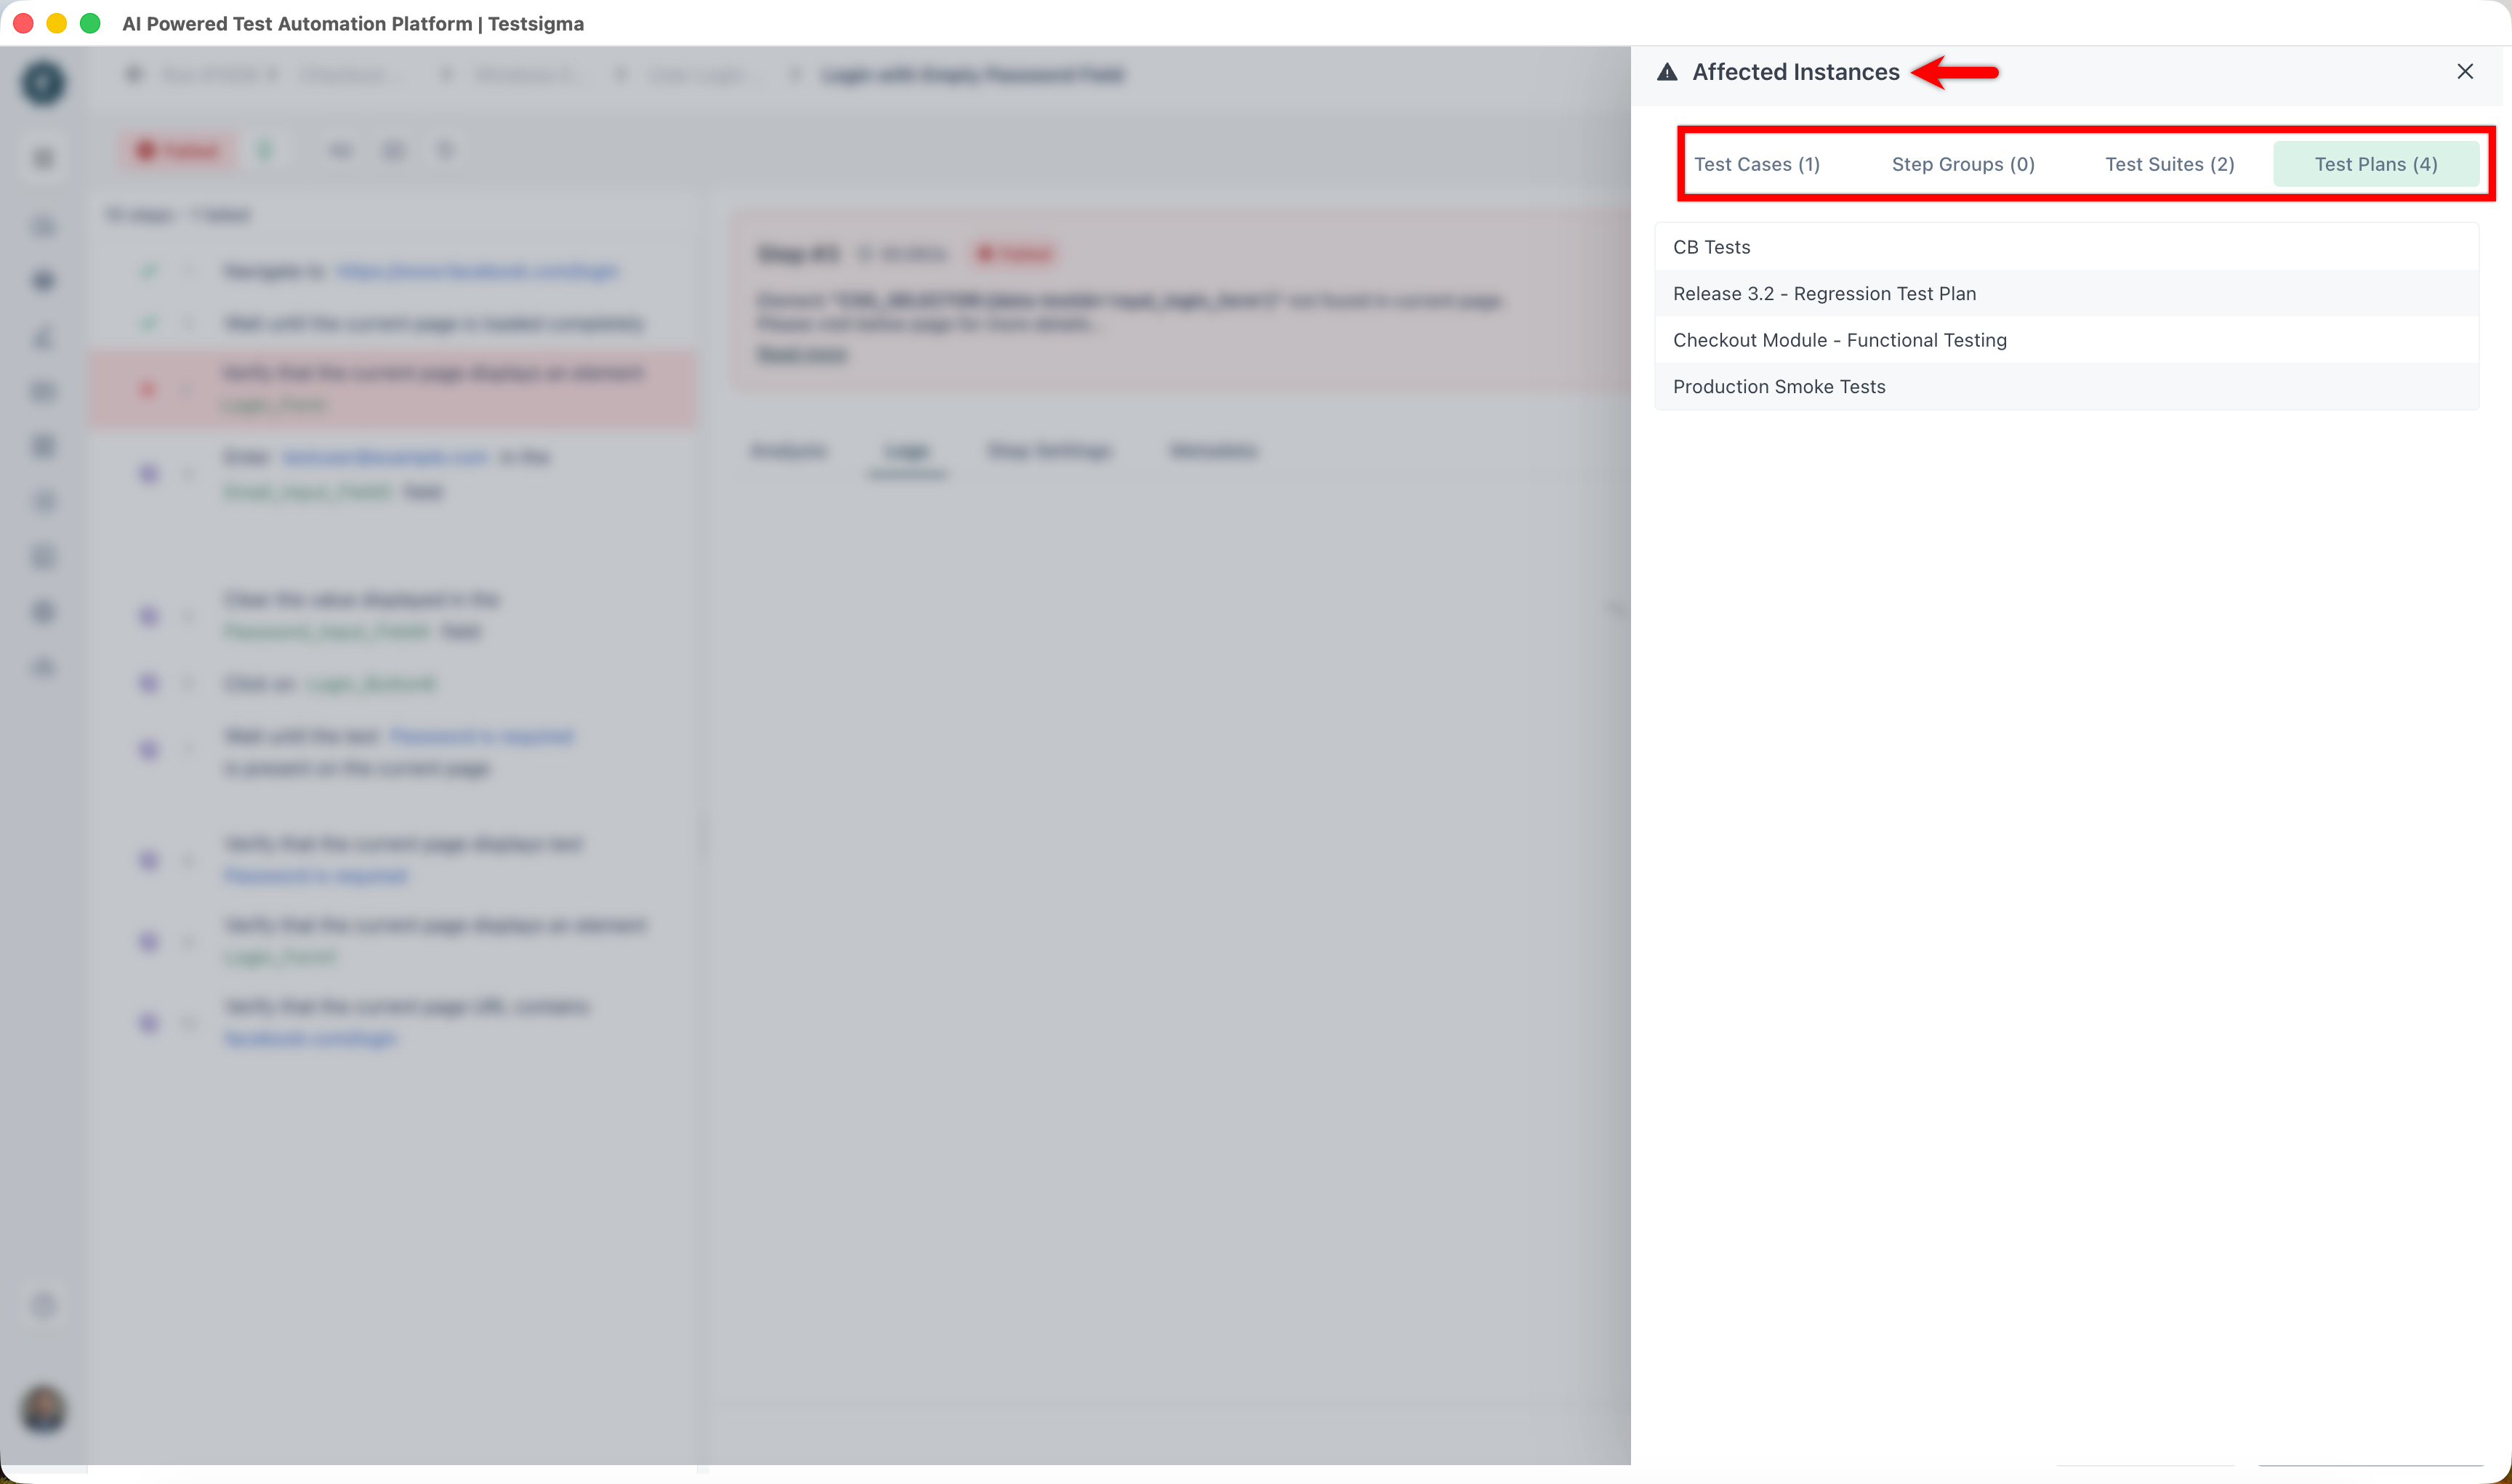
Where nothing else uses the element, the panel reads There are no Test Cases associated with the element.
Act on the failure
Section titled “Act on the failure”Four routes, all from the results page:
- Analyze with Agent in the action bar returns the error type, the root cause, and suggestions you can apply as a step update
- Run using Copilot in the action bar reruns the test case interactively
- Update element corrects a locator yourself, through the edit icon on the Element field in Visual Evidence
- Relearn step re-captures the step
Where auto-healing fired, approve or reject the healed element directly on the first screen.
Common causes of failure
Section titled “Common causes of failure”- The element or UI identifier changed in the application
- The application does not load
- The local internet connection fails
- The element is unchanged, but navigation to it changed
- Addon code does not perform as expected
- The application under test contains a defect
- The result is a false positive or false negative
- An API is down
- The element locator is incorrect
Was this page helpful?
Thanks for the feedback.