

Copilot
Copilot is an AI-powered authoring and debugging tool that runs a test case in a live session, so you generate, execute, and fix steps without leaving it. As you work, Copilot reads the application screen and generates steps from the actions you perform. You can execute each step as soon as it appears, so you know it works before you write the next one.
Capabilities
Section titled “Capabilities”| Capability | What it does | Why it helps |
|---|---|---|
| Record steps | Captures interactions from a live browser and converts them into executable test steps | Executes and validates each recorded step during the session, so creation and verification happen together |
| Debug points | Pause the test at a chosen step, added or removed before or during a run. While paused, you can inspect the application and adjust upcoming steps | Halts execution exactly where a problem is, without restarting the test |
| Debug toolbar | A global toolbar with Pause, Resume, Step Over, Skip Over, and Restart | Keeps every execution control in one place during a session |
| Execute from step | Runs the test from a chosen step instead of from the start. All prior steps are marked Skipped | Saves time on long tests, on validating a fix, or on one section of a flow |
| In-session step management | Add, edit, delete, reorder, or bulk-update steps inside the session | Keeps authoring and debugging in one loop, with no session restart to adjust a test |
When you change the steps, Copilot recalculates the execution flow so the run stays continuous.
Launch a session on web
Section titled “Launch a session on web”-
Go to Create Tests > Test Cases and open a test case.
-
Click Copilot in the action panel.
-
(Optional) In the Set Initial Debug Point field, select the step where execution should pause.
-
(Optional) In the Execute from Step field, select the step where execution should begin. All prior steps are marked Skipped. Put the application under test on the screen that matches that step first.
-
(Optional) Turn on Run till failed step to stop at the first failure. With it off, the test case runs from start to end.
-
(Optional) Configure Environment, Additional Settings, and Desired Capabilities.
-
Click Launch and wait for the session to start.
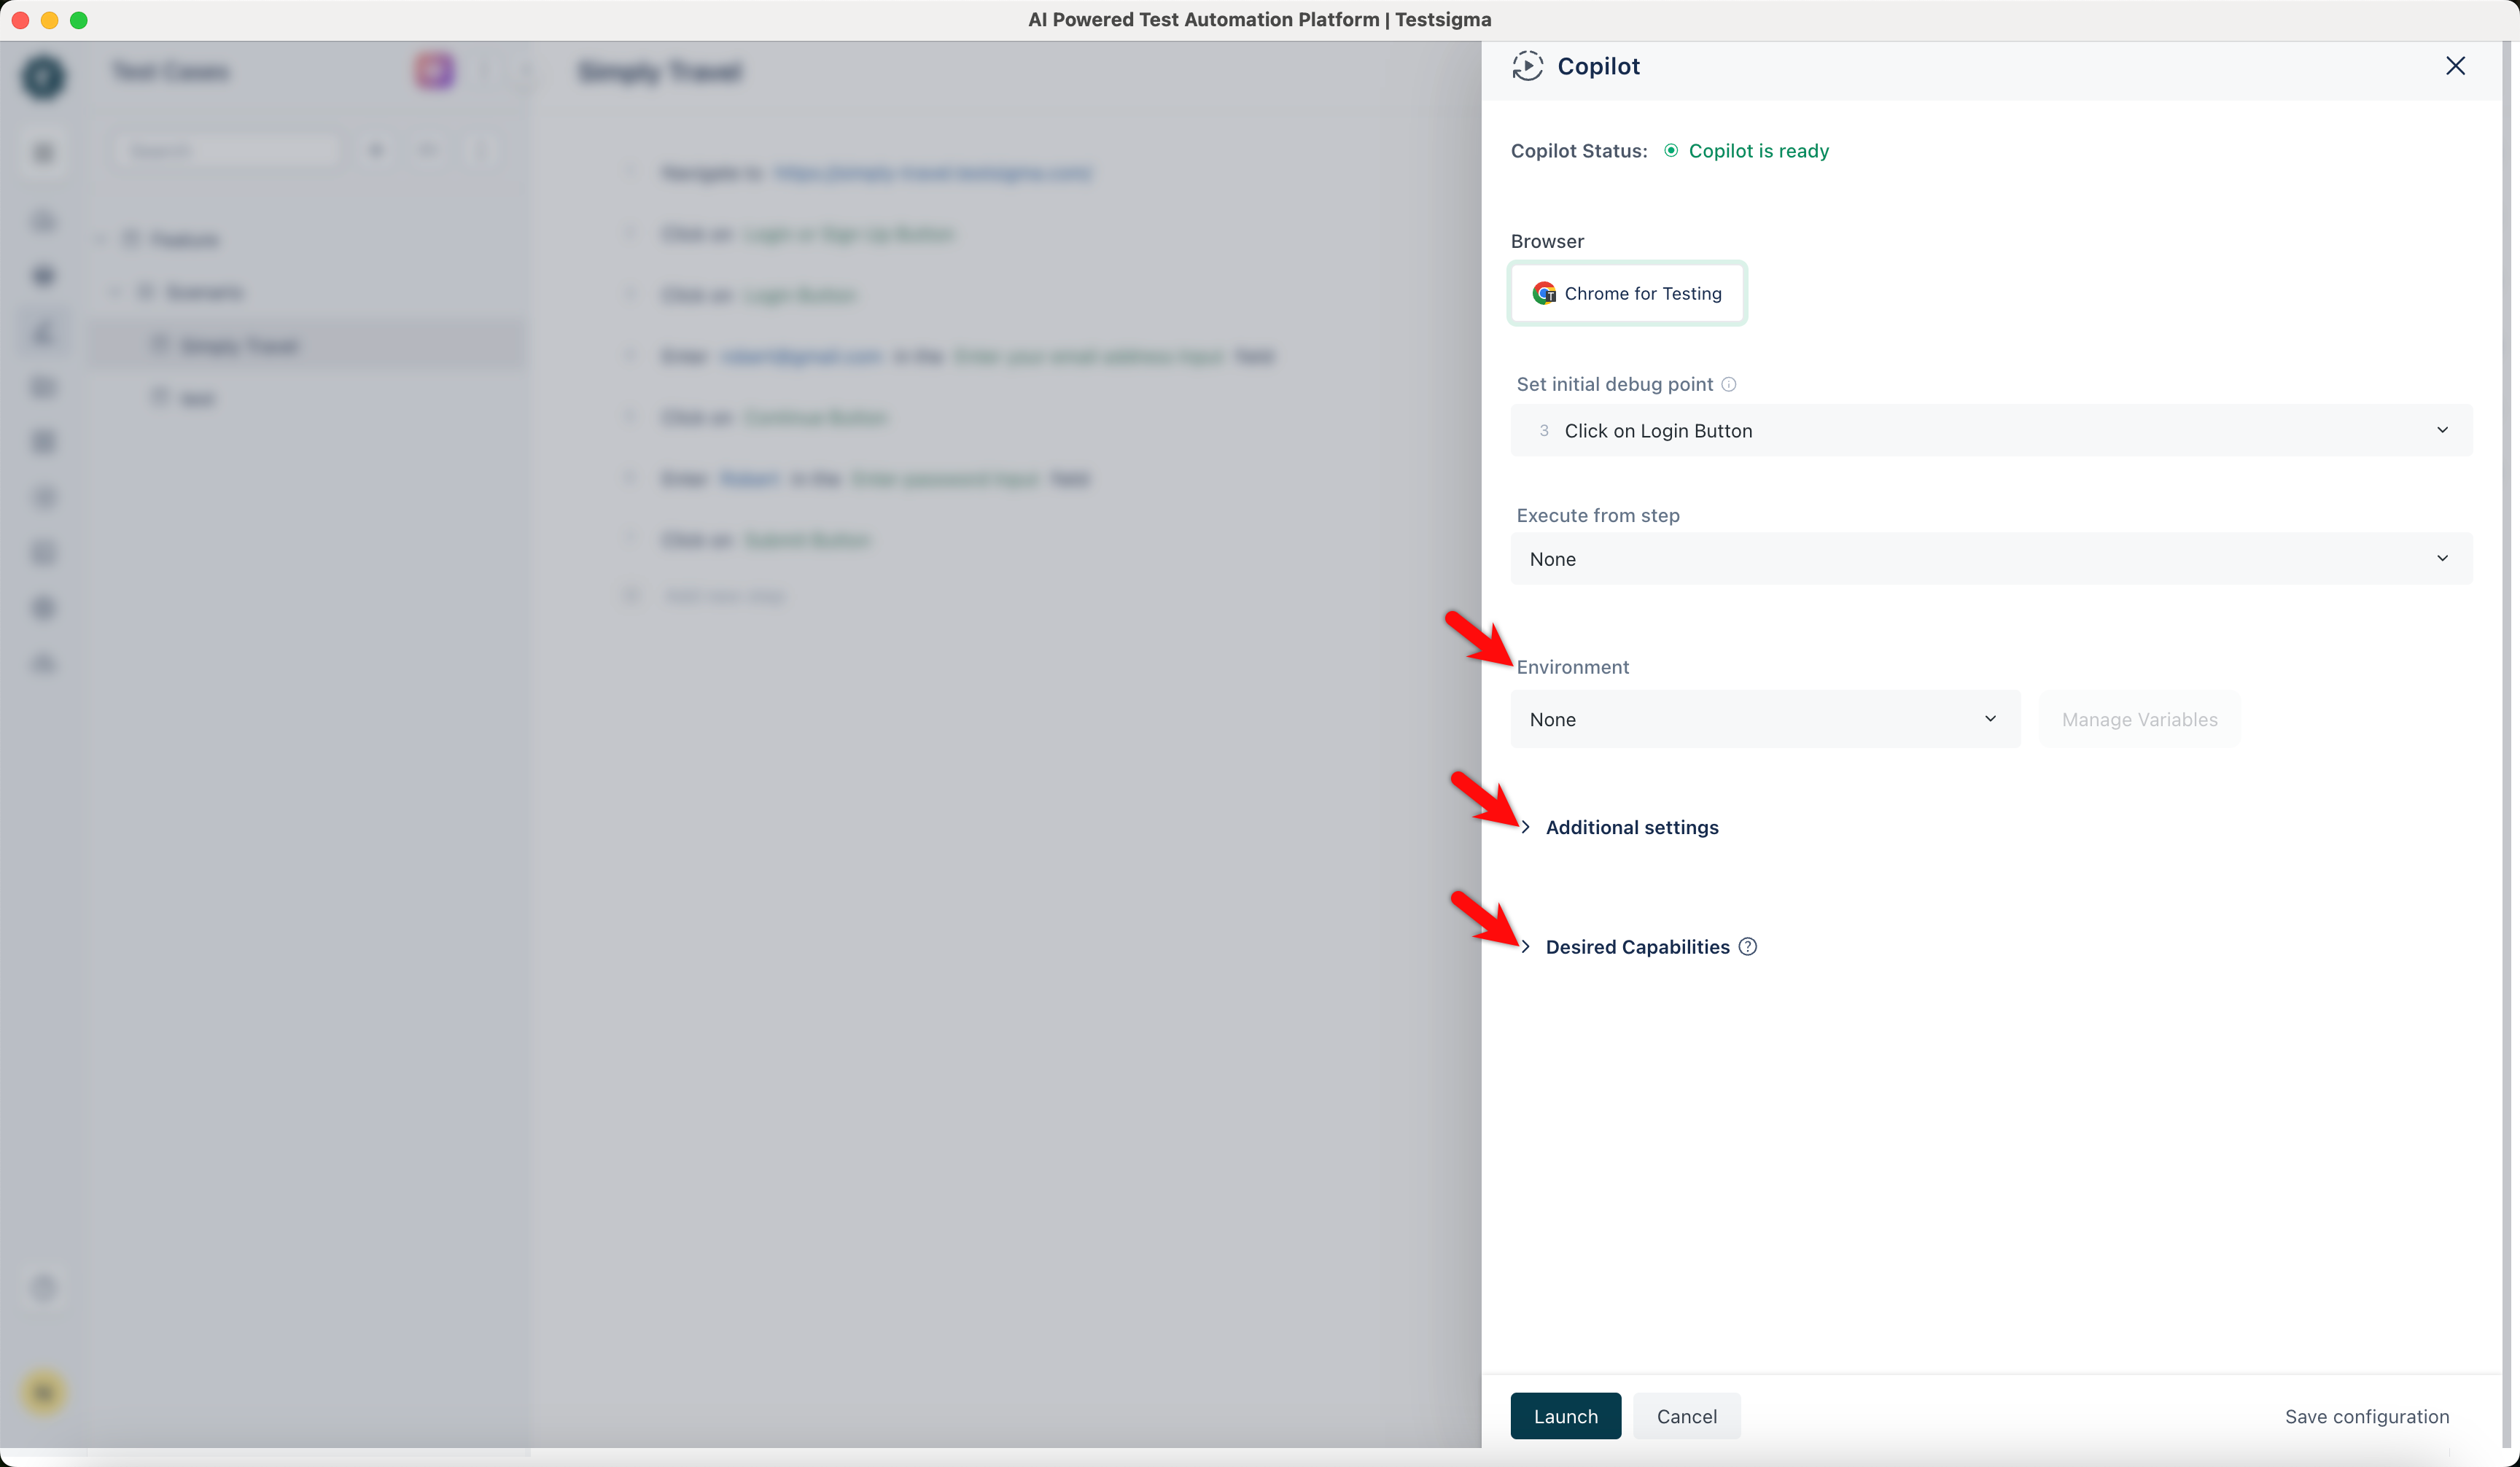
Copilot opens a browser window on the test case’s URL, and the steps panel and the application sit side by side.
Launch a session on Android or iOS
Section titled “Launch a session on Android or iOS”Connect the Android or iOS device to Testsigma before you start.
-
Open the test case and click Copilot.
-
In the Run in Debug Mode overlay, select the device from the Device dropdown under Test Machine.
-
(Optional) Turn on Run till failed step and select the step to pause at.
-
Supply the application: select External link for a publicly accessible URL, Uploaded apps for an app already in Testsigma, or Use details to enter the App Package and App Activity.
-
Click Launch.
The debugger opens with the test steps, the related information, and the device screen.
Launch in the same window
Section titled “Launch in the same window”Copilot opens in a new window or in the same window. A new window uses a new profile and needs no preparation. To use the same window, start Chrome in remote debugging mode first, in a new profile.
On Windows, open the command prompt and run:
start chrome.exe --remote-debugging-port=9222 --user-data-dir="C:\selenum\ChromeProfile"On macOS, open Terminal and run:
/Applications/Google\ Chrome.app/Contents/MacOS/Google\ Chrome --remote-debugging-port=9222 --user-data-dir="~/ChromeProfile"Chrome then exposes the remote DevTools protocol on that port, with the profile set by --user-data-dir, which is what lets ChromeDriver drive it.
Record test steps
Section titled “Record test steps”Recording captures your own actions as steps, adds them to the running session, and executes them there. To have Copilot draft the steps instead, see Generate test steps in the recorder.
Record below a specific step
Section titled “Record below a specific step”-
Hover over the step and click Step Below, then click Rec.
-
Perform the actions in your application. Copilot records each one as a step in real time.
-
Click Stop Recording.
-
Review the steps in the steps panel.
-
Click Add Steps to insert them below the selected step, or Discard to drop them.
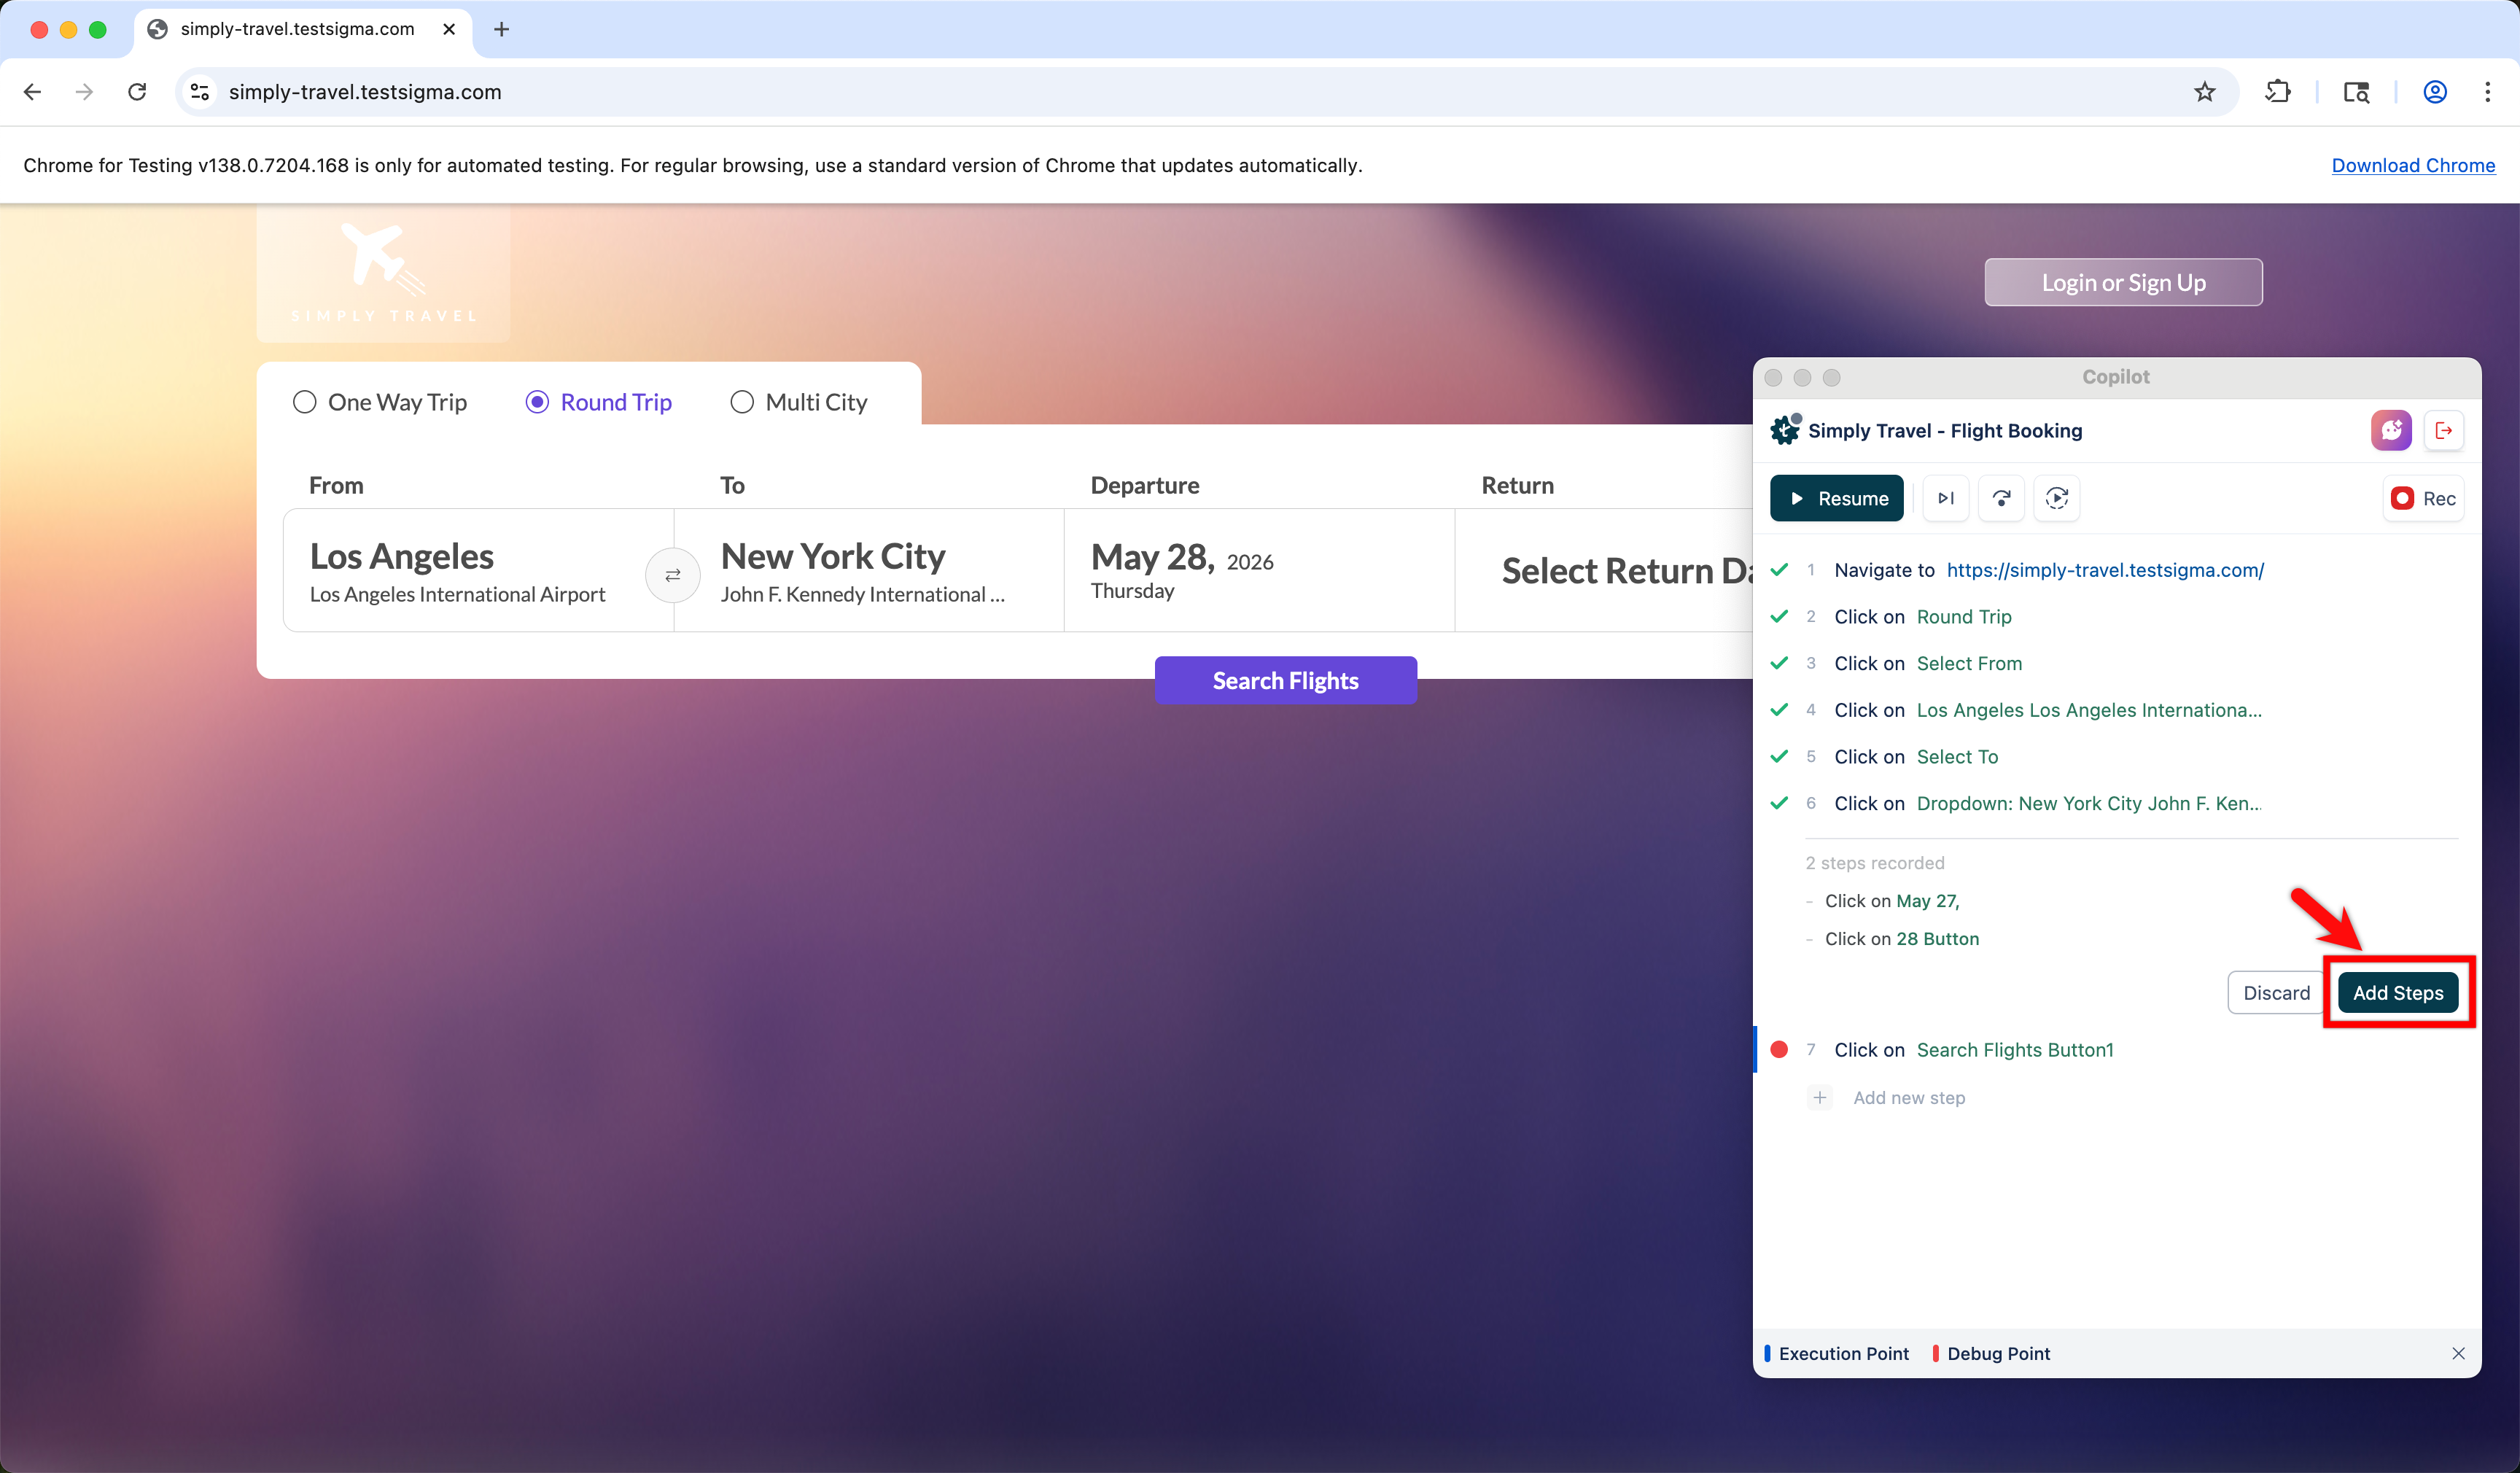
Steps inserted below the last executed step run automatically once added. Steps inserted above it need Resume.
Record at the end
Section titled “Record at the end”-
Click Rec. Steps record at the end of the test case by default.
-
Perform the actions in your application.
-
Click Stop Recording.
-
Review the steps in the steps panel.
-
Click Add Steps to append them, or Discard to drop them.
-
Click Resume.
Handle the Browser State Changed dialog
Section titled “Handle the Browser State Changed dialog”This dialog appears when you resume a paused run after adding recorded steps. Click Restart Execution to run from the beginning, or Dismiss to continue from where execution stopped. After dismissing, set the application state manually so it matches the step about to run.
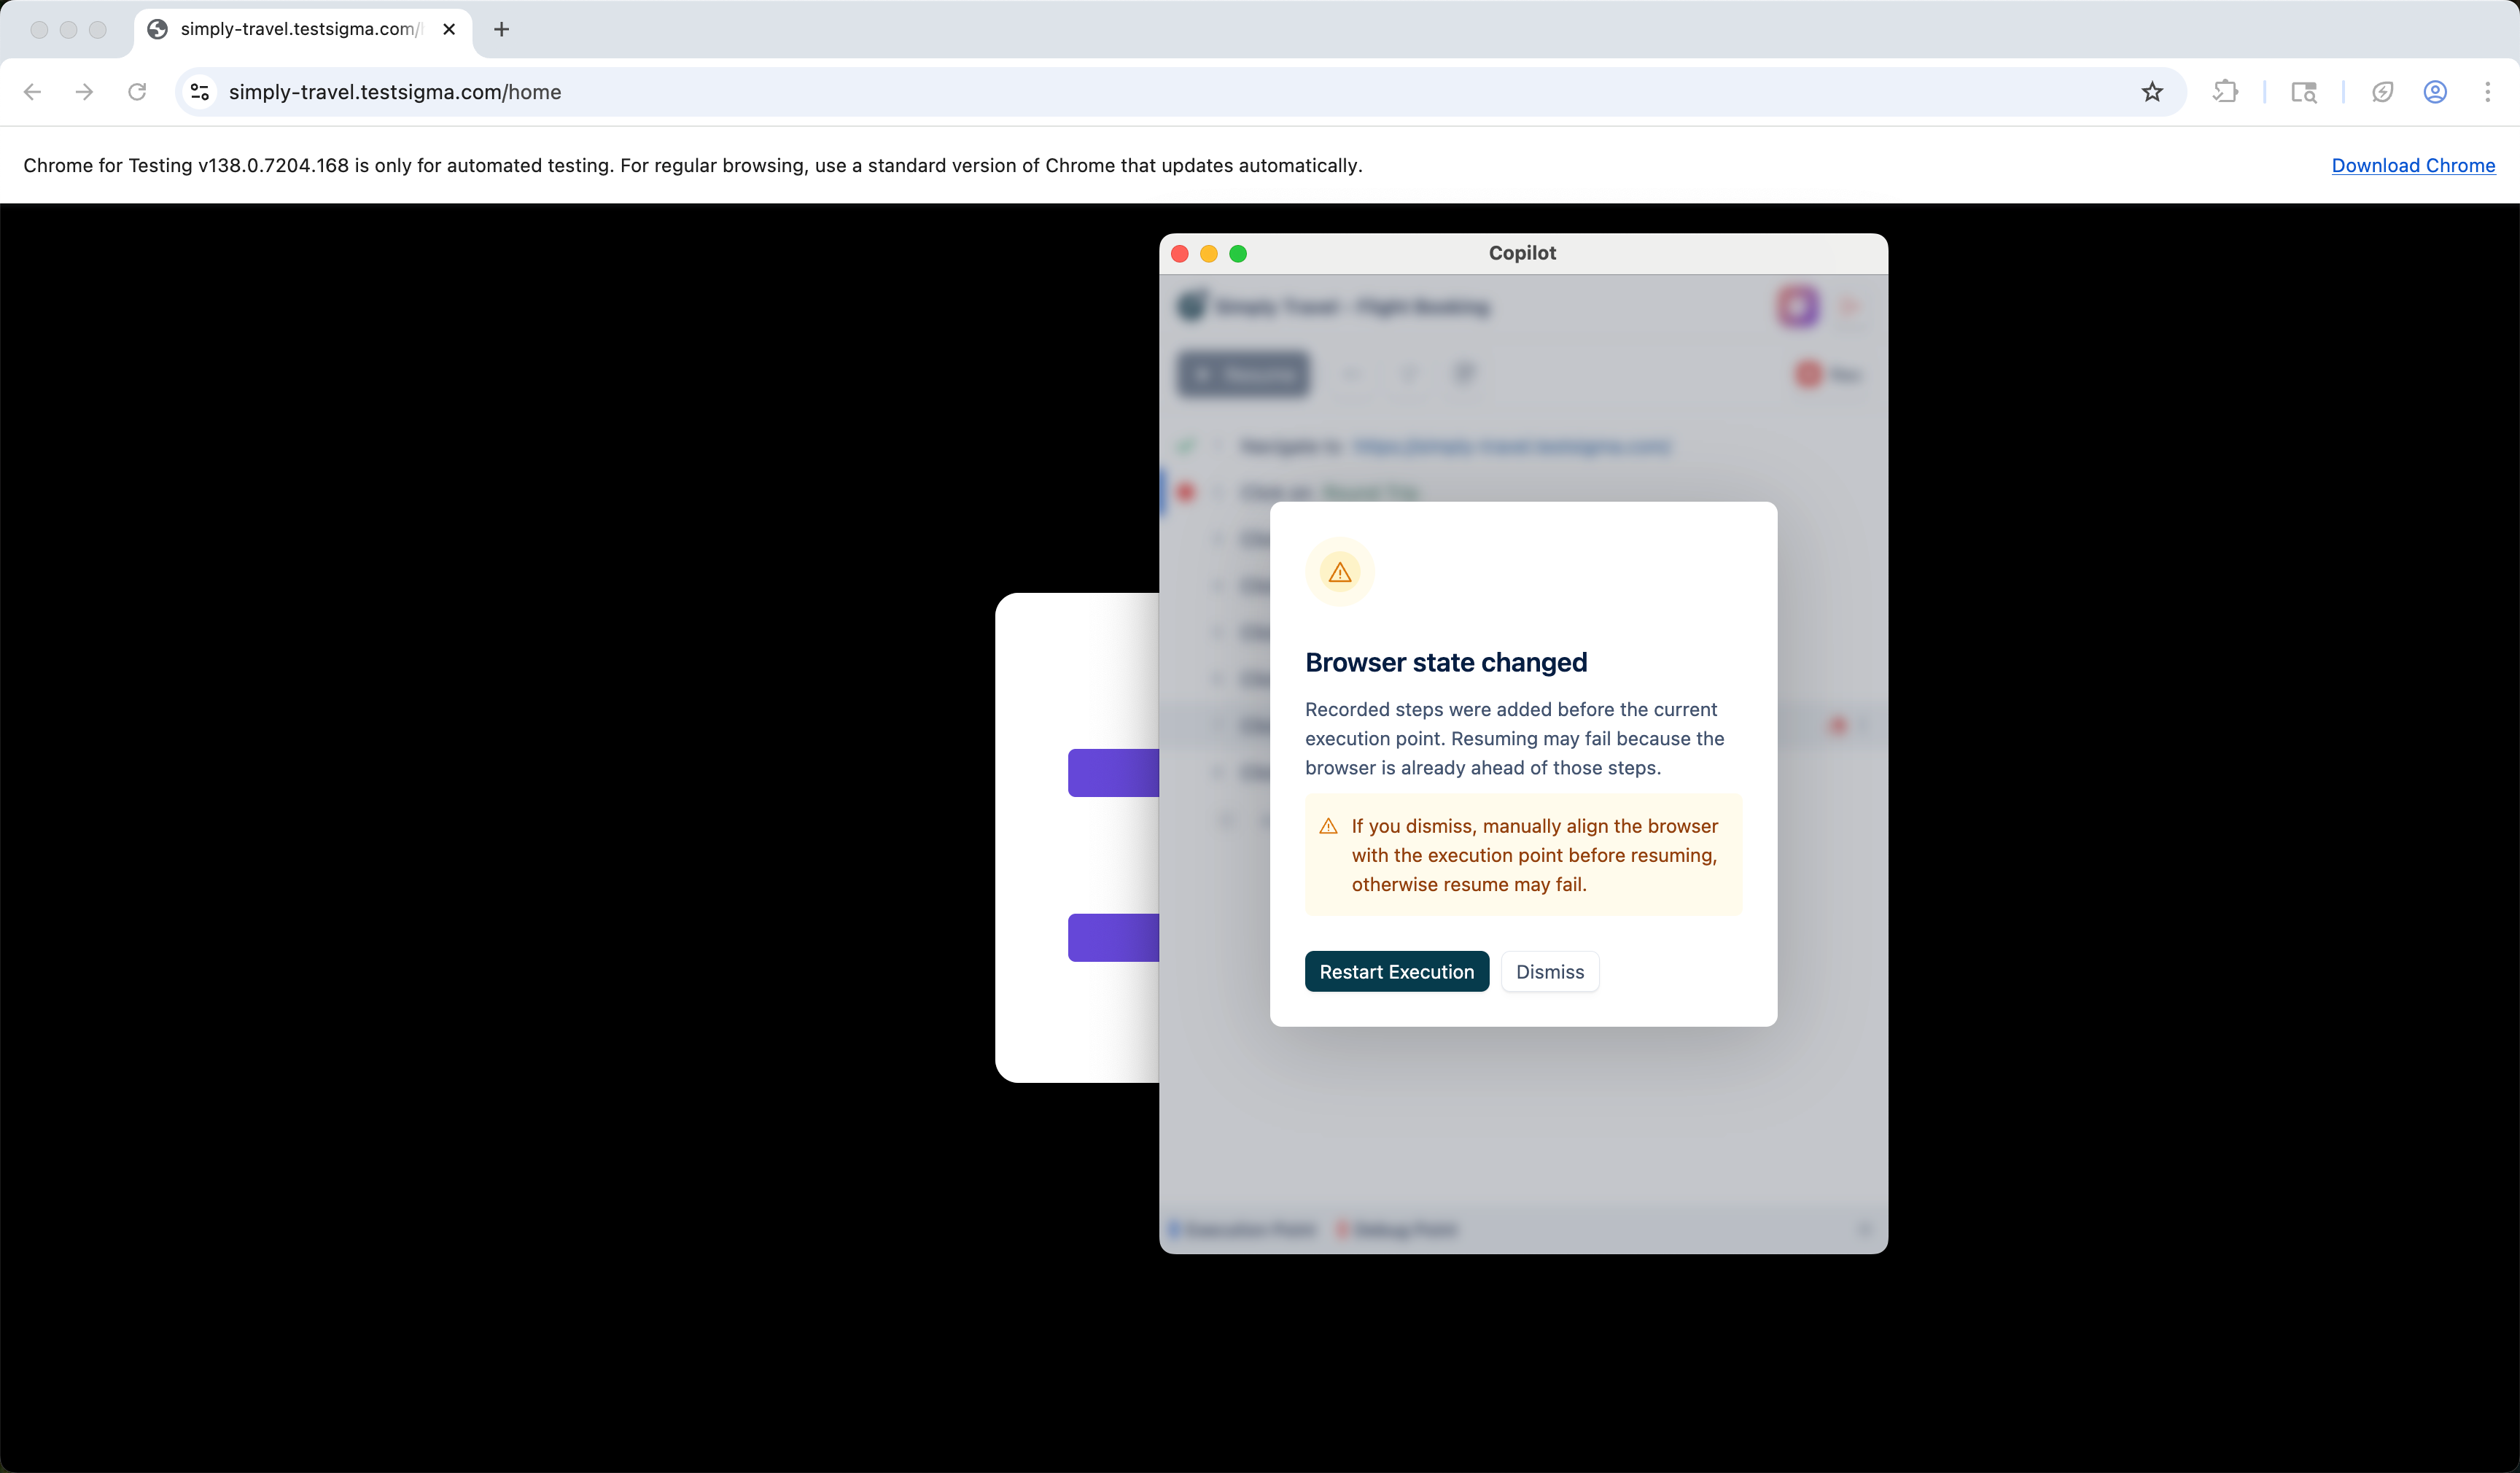
Generate test steps in the recorder
Section titled “Generate test steps in the recorder”Copilot reads the page or screen in front of you and drafts test scenarios from it, so a test case starts from what the application actually shows rather than from a blank step.
- Go to Create Tests > Test Cases and create a test case.
- Click Record on the Test Case Details page. A new window opens.
- Enter the URL of the page to generate from. The Testsigma Recorder activates.
- Click Testsigma Copilot.
- Click Generate Test Cases in the Testsigma Copilot overlay. Copilot generates scenarios from the current page content.
- Open a generated test case to see its steps.
- Select the steps you want, then click Add to test case to import them into the recorder.
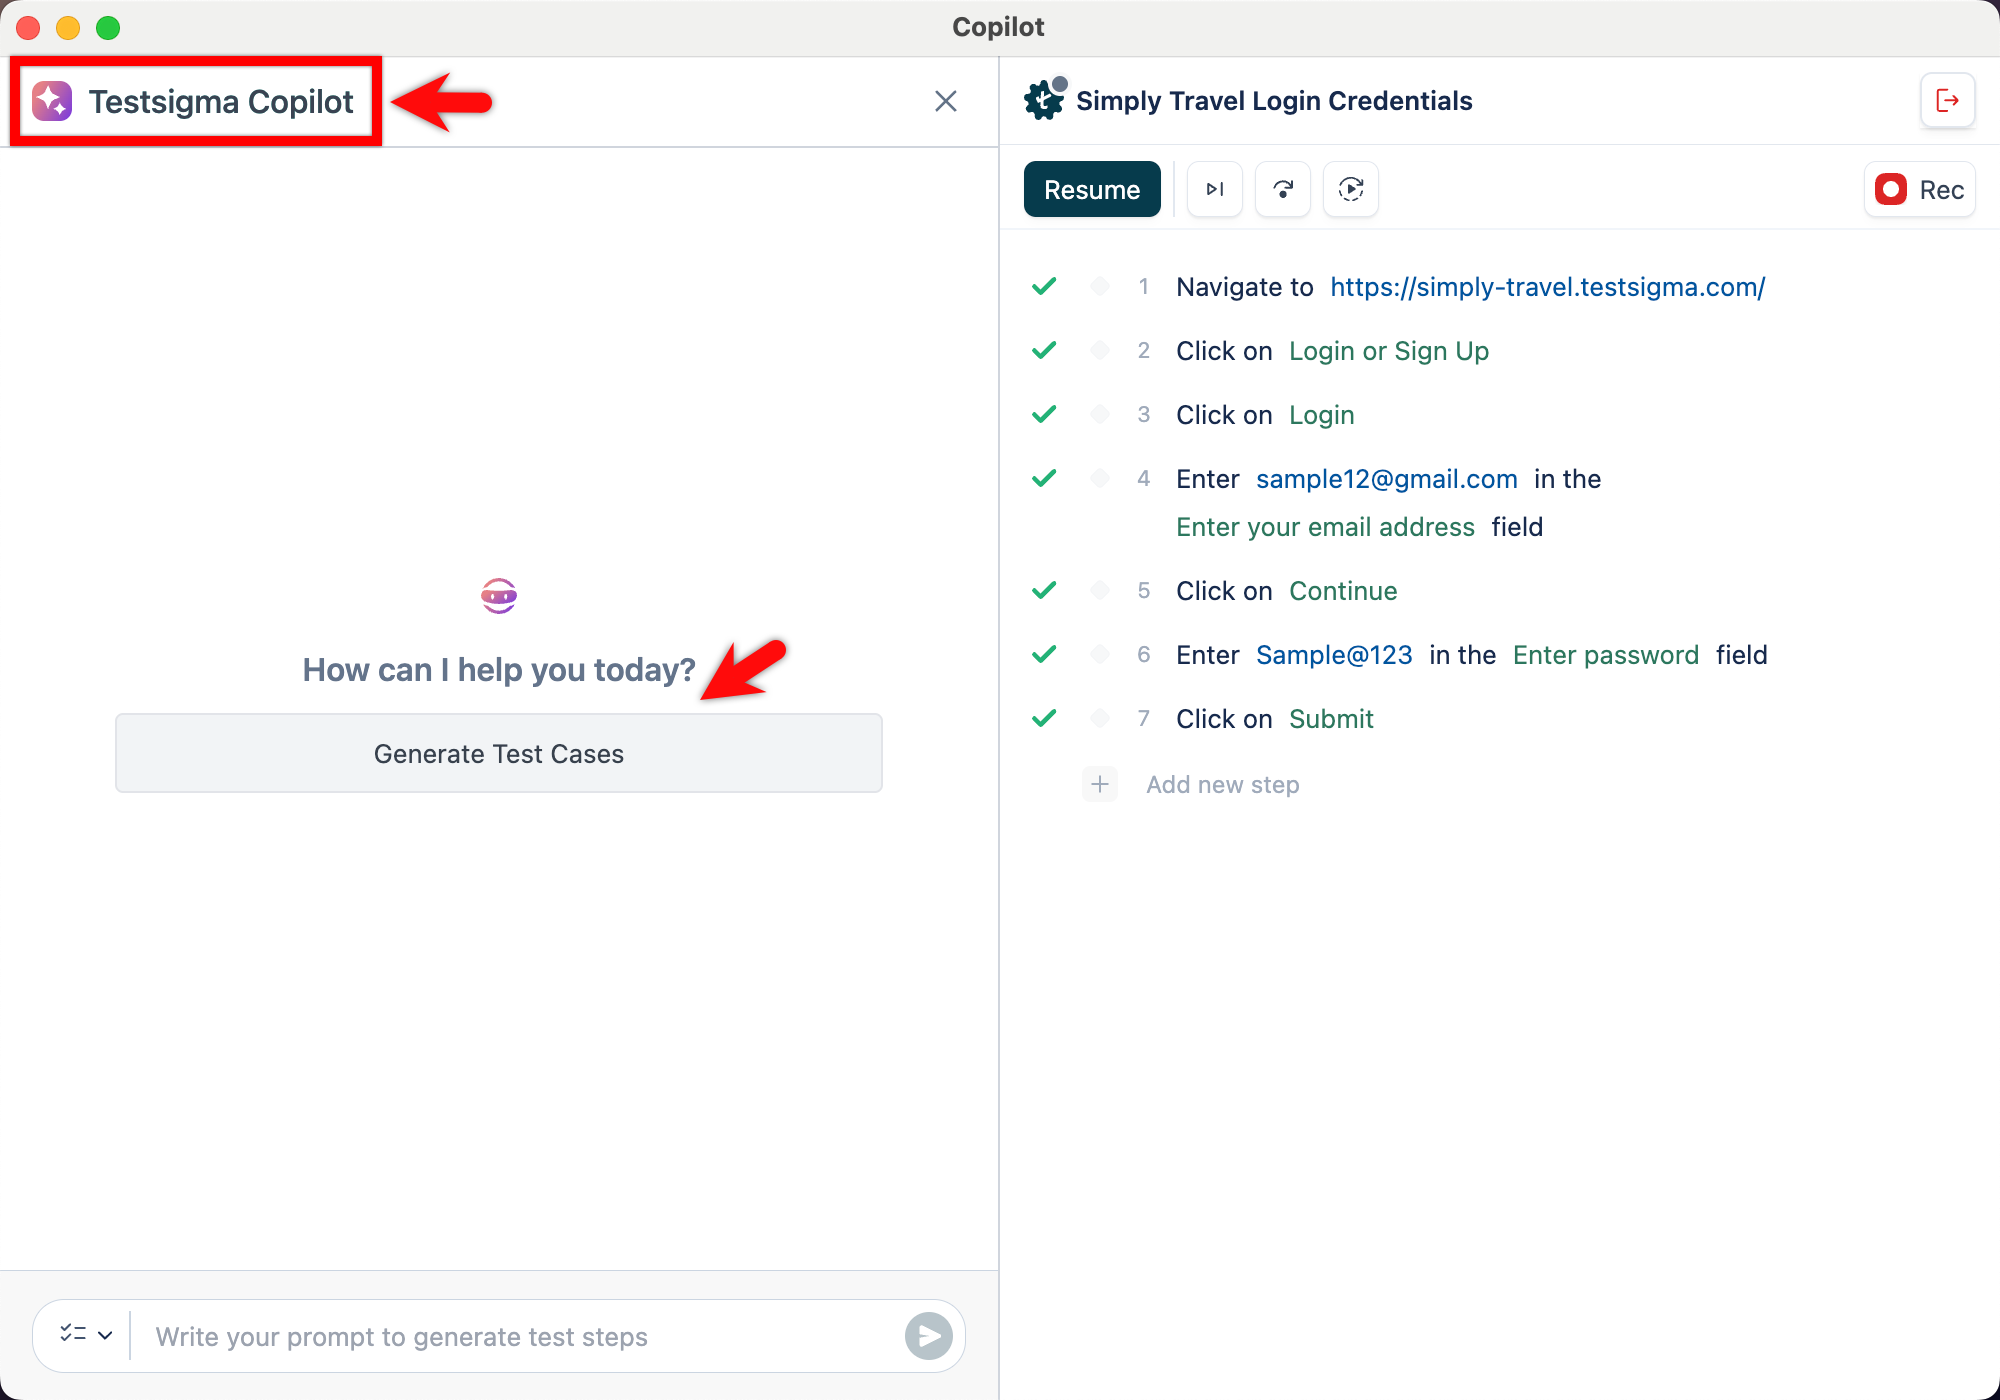
To ask for something specific instead, enter a prompt in the Testsigma Copilot overlay at step 5 and press Enter. Copilot generates steps for what you described, and Add to test case imports them the same way.
- Go to Create Tests > Test Cases and create a test case.
- Click Record.
- In the Record Test Steps overlay, select the Test Lab and Machine, upload the APK or IPA, and click Record.
- Wait for the application to load.
- Click Testsigma Copilot on the Test Recorder.
- Click Generate Test Cases in the Testsigma Copilot overlay, and wait for generation to finish.
- Open a generated test case to see its steps.
- Select the steps you want, then click Add to test case to import them into the recorder.
Imported steps are editable. Adjust them for the behavior you want, then click Stop to return to the Test Case Details page.
Add a step by describing it
Section titled “Add a step by describing it”Click + Add new step to add at the end, or hover over a step and click Step Below to insert at a position. Type the step to see matching NLPs, select one and configure it, add the elements and test data it needs, then click Create Step.
A step added above the execution point does not run in the current run, and runs on the next one. A step added below the execution point runs in the same run, as long as execution has not already passed it. The execution point is the step where the test is paused or running.
Edit a step
Section titled “Edit a step”To replace what a step does, click the step, type to select a new NLP, configure it, then click Update to save or Dismiss to restore the original step.
To work on the step’s element, hover over the step and click the element name:
- Rename: change the element’s display name, leaving its locator and configuration alone
- Learn: re-record the element during the live session so Copilot can find it on screen
- Change: replace it with another element from the repository, then click Update Step
- Create: create a new element with its name, screen name, type, and value, then click Update Step to attach it
- Edit: open Update Element to change the name, screen name, type, and value
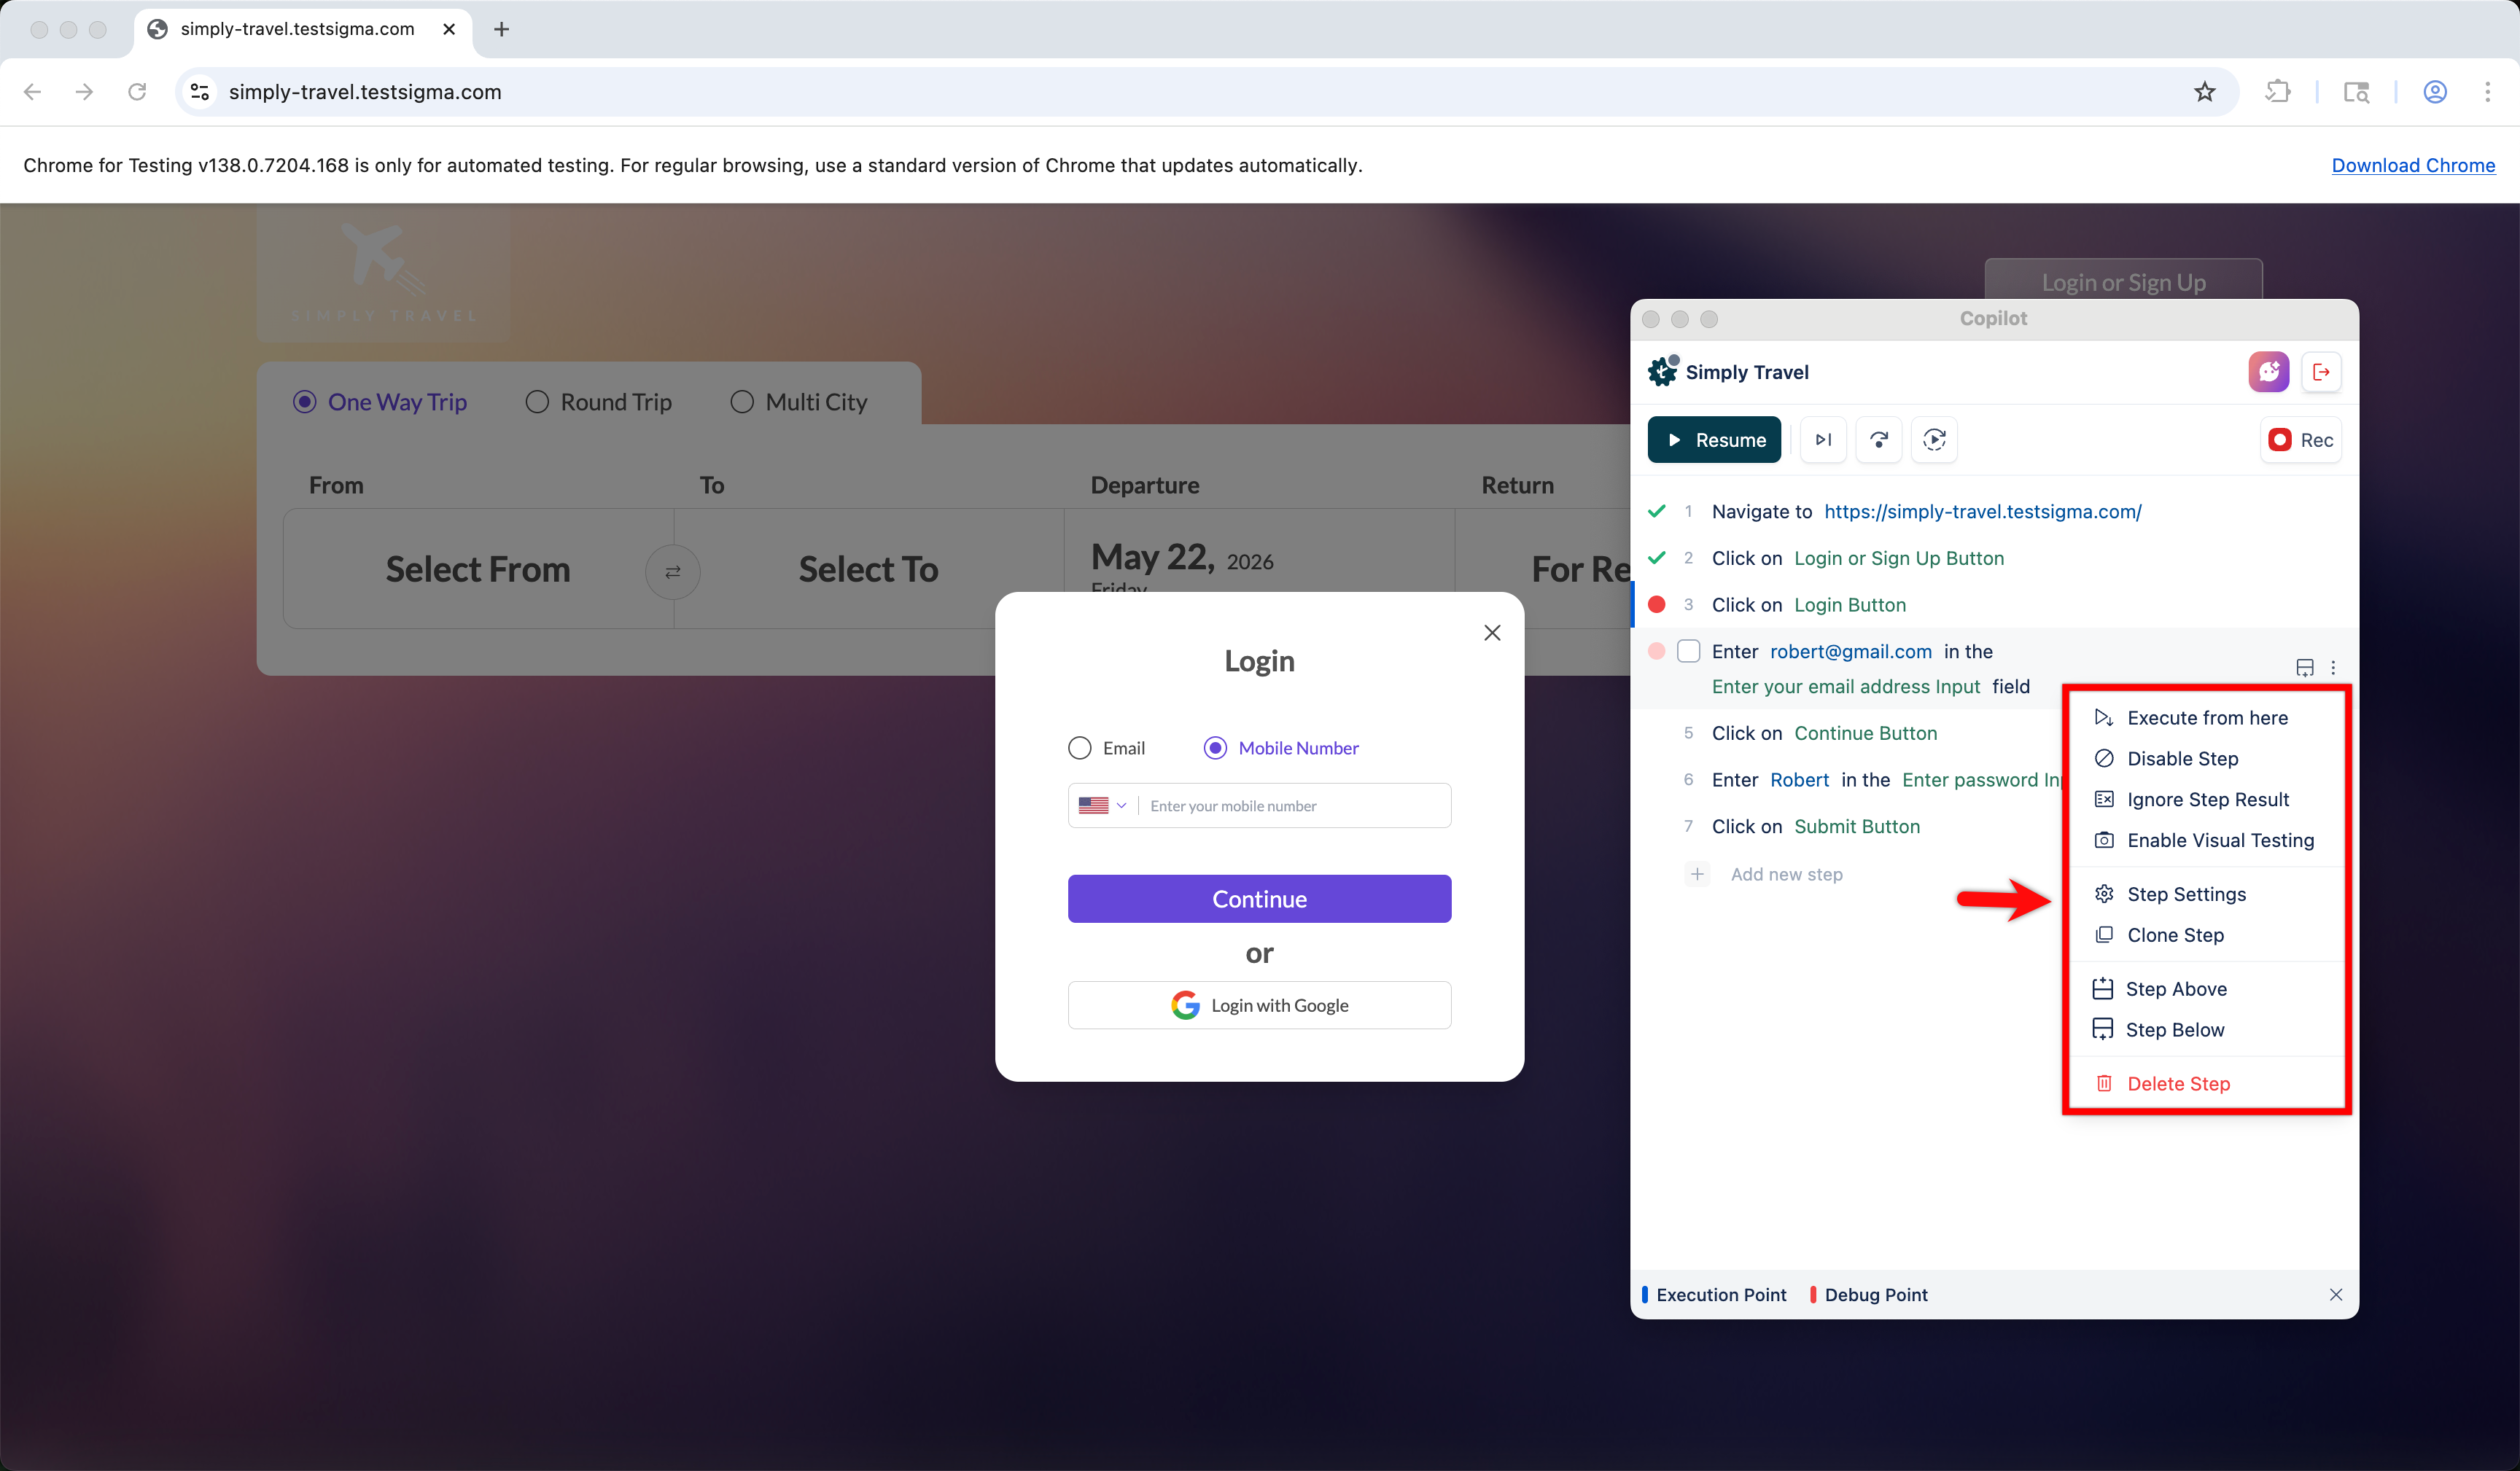
The ellipsis icon ⋮ on a step carries the rest of the options:
- Execute from Here: starts execution at this step and skips all prior steps
- Disable Step: skips the step during execution without removing it
- Ignore Step Result: keeps the step’s pass or fail status out of the test result
- Enable Visual Testing: captures and compares screenshots when the step runs
- Step Settings: opens the Step Details panel for step timeout, screenshot behavior, and other options
- Clone Step: copies the step directly below itself
- Step Above and Step Below: insert an empty step and open the inline editor
- Delete Step: removes the step
Reorder steps
Section titled “Reorder steps”Click the step you want to move, drag it to its new position, which highlights as you drag, then click Save Changes to keep the order or Discard to revert it. Click Resume to continue execution.
Delete steps
Section titled “Delete steps”To delete one step, hover over it, click the ellipsis icon ⋮, click Delete Step, then click Delete in the Delete step? dialog.
To delete several, hover over a step and click the checkbox in place of its number, select the rest, or click Select All, then click the Delete icon in the floating action bar and confirm.
Change several steps at once
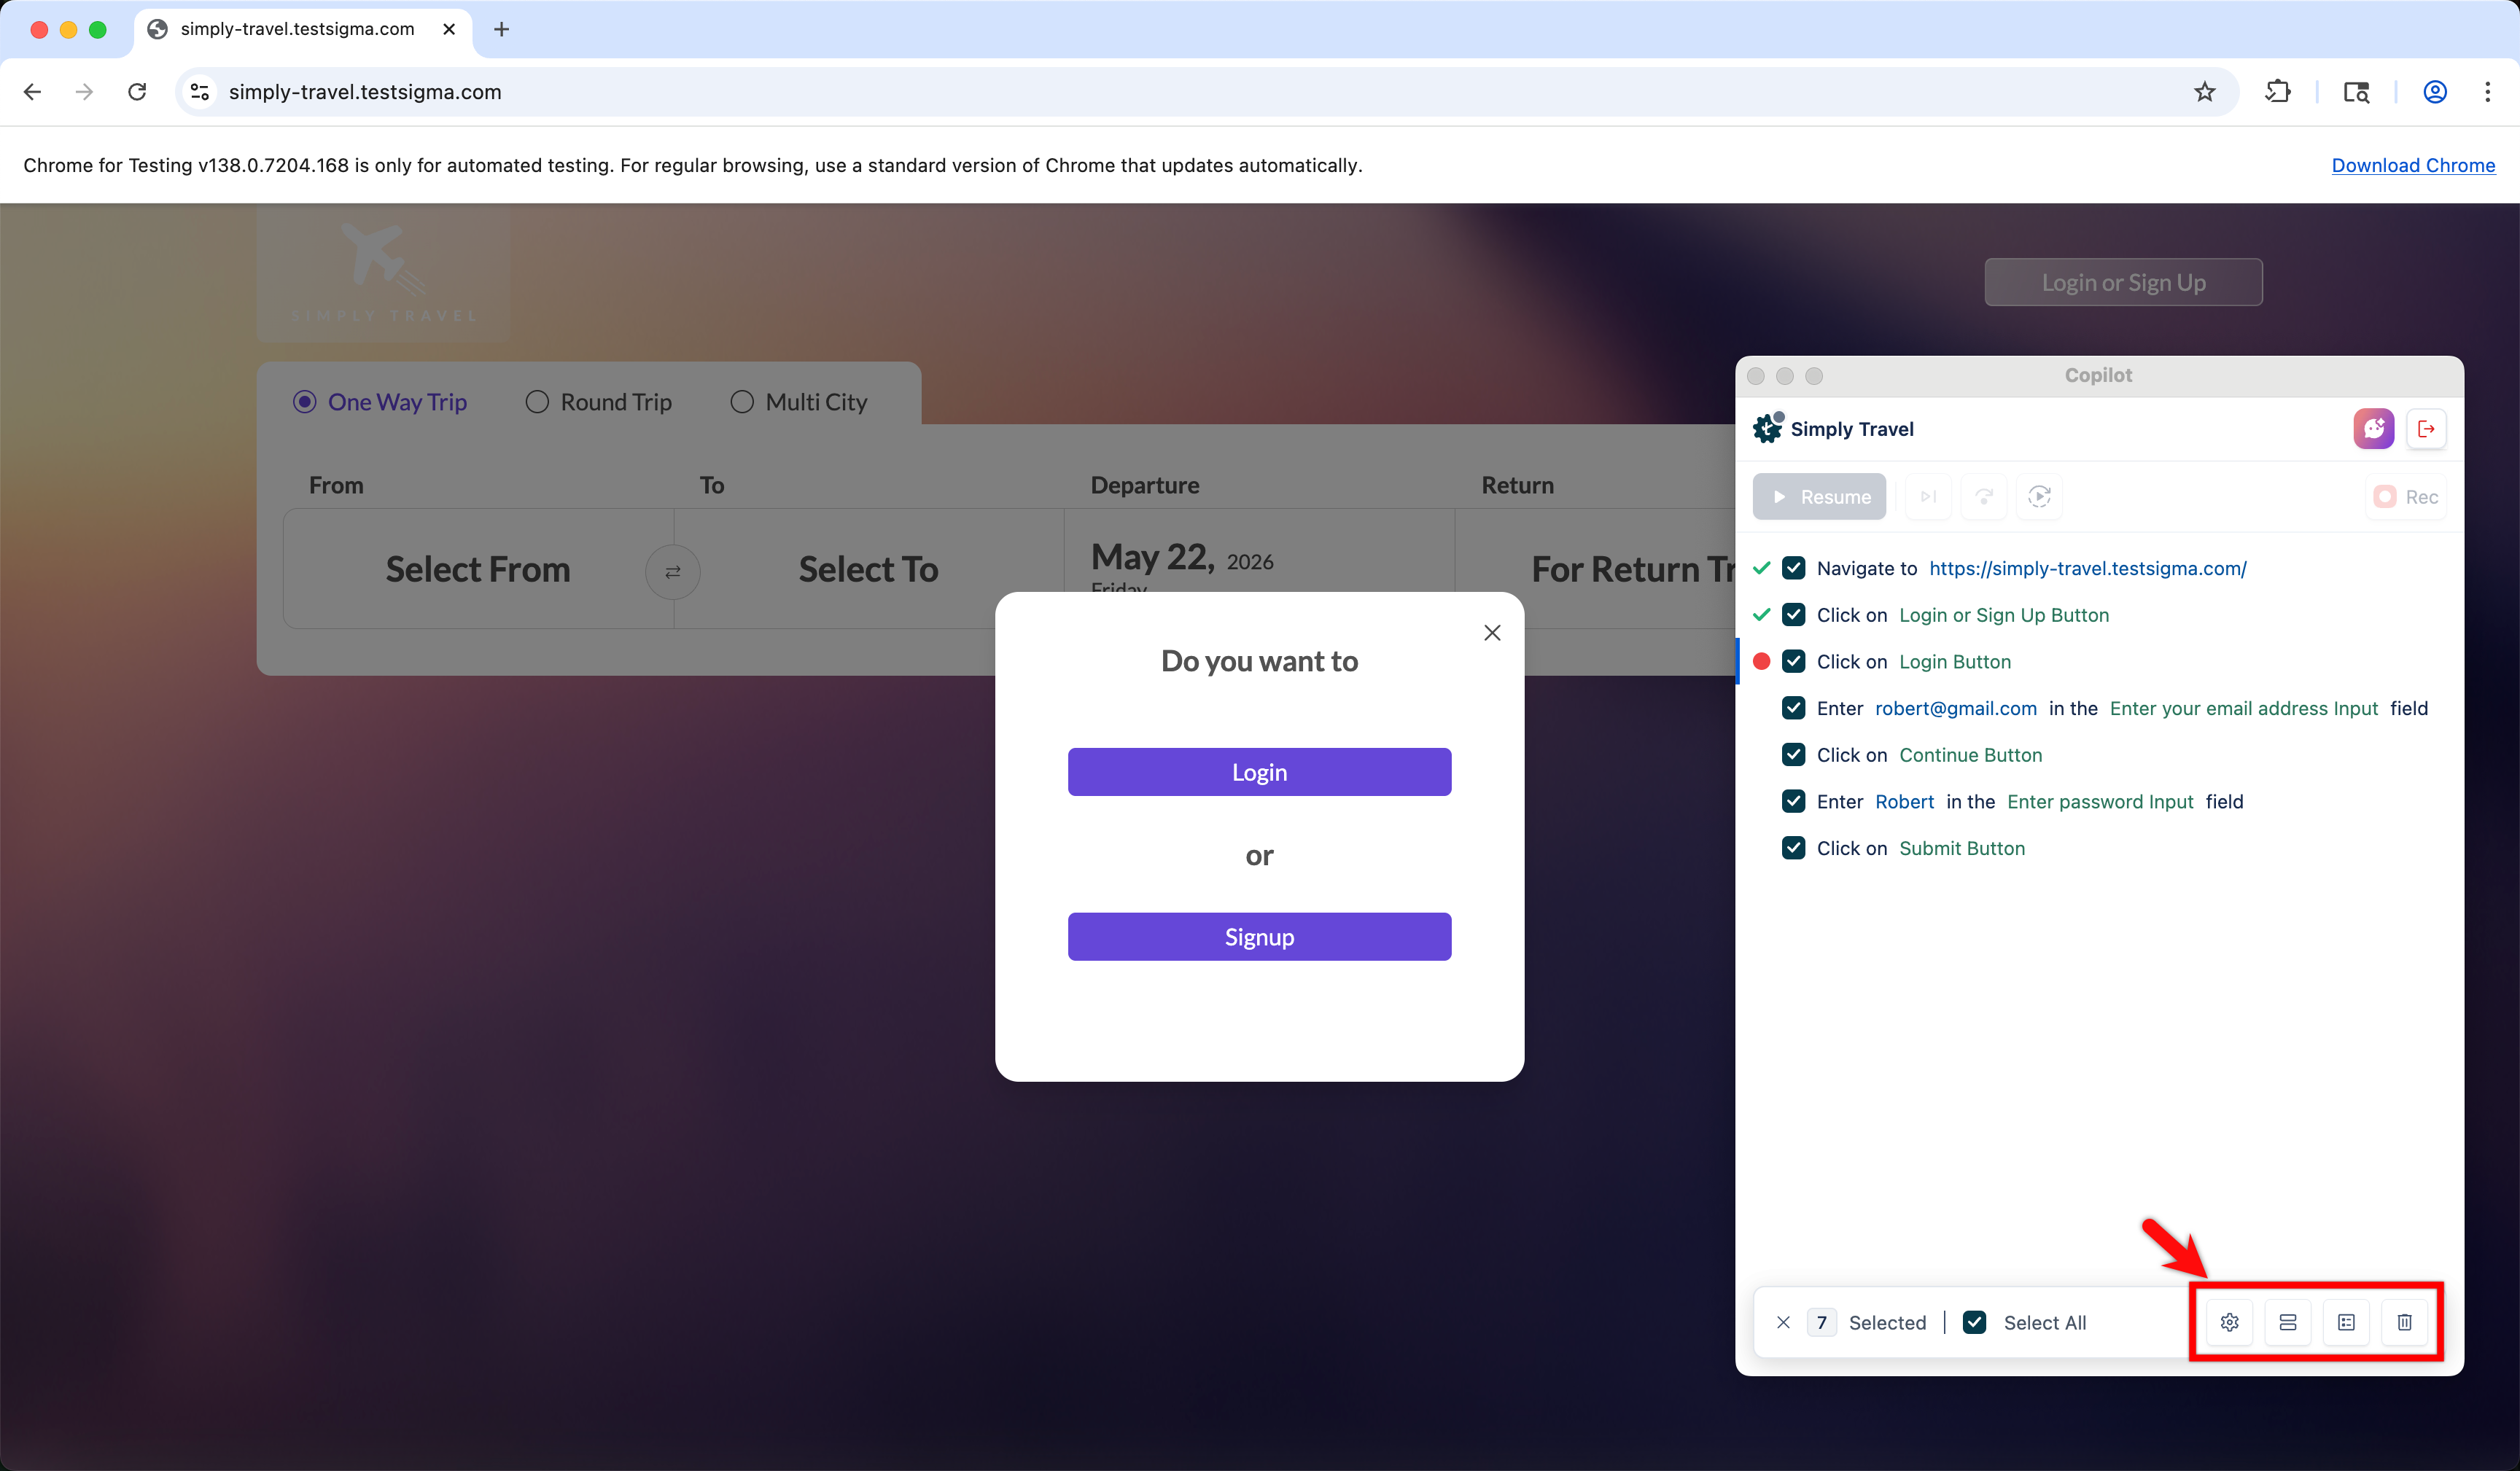
Section titled “Change several steps at once”Hover over a step and click the checkbox that appears in place of the step number, which opens the floating action bar. Select the other steps, or click Select All, then click an icon in the bar:
- Step Settings: applies shared settings, such as timeouts and screenshot behavior, to every selected step
- Create Step Block: groups the selected steps into a block
- Create Step Group: combines them into a step group
- Delete: removes them permanently
Set up a browser profile for recording
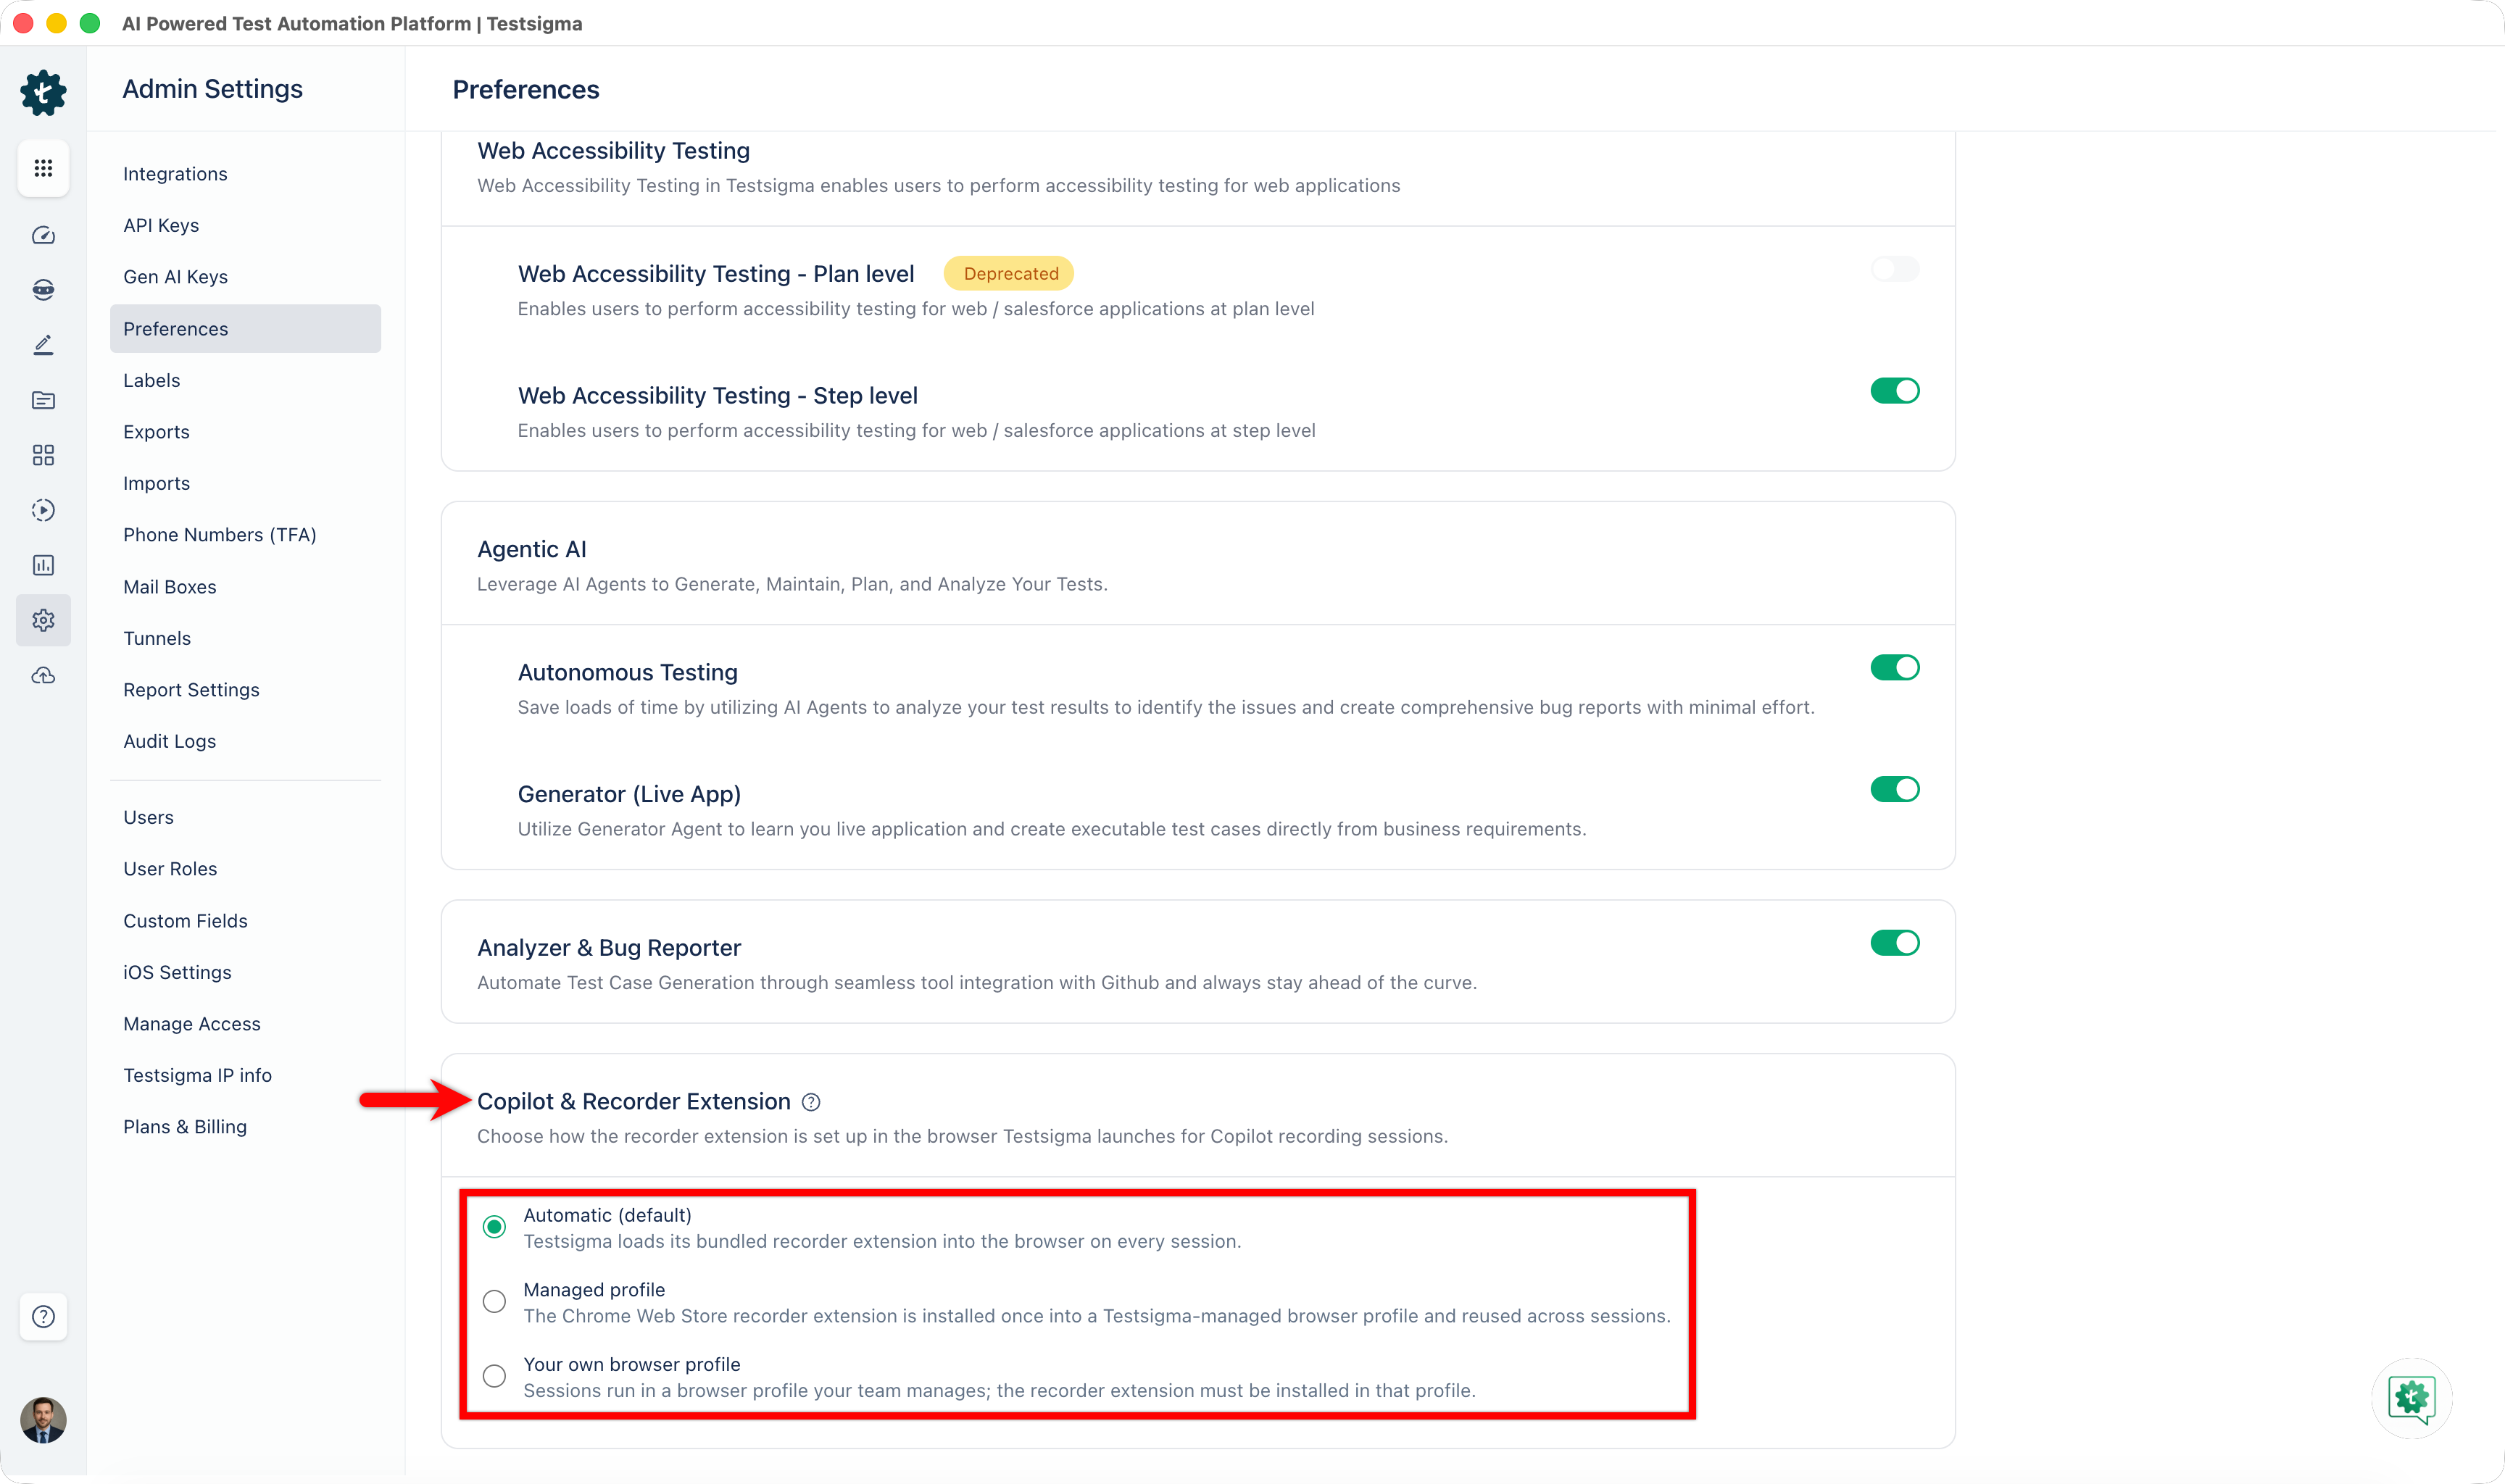
Section titled “Set up a browser profile for recording”Copilot loads the Testsigma recorder extension into the browser it opens. The profile mode controls how. Go to Settings > Preferences, scroll to Copilot & Recorder Extension, and select one of 3 options.
| Mode | Who owns the profile | Where the extension comes from | Choose it when |
|---|---|---|---|
| Automatic | Testsigma, fresh each session | Testsigma’s bundled extension, loaded every session | You do not need a profile that lasts, or your own extensions. This is the default, and needs no setup |
| Managed profile | Testsigma, reused across sessions | The Chrome Web Store, installed once | You want the extension already there and your browser settings kept, without maintaining a profile |
| Your own browser profile | Your team | You install it in your own profile | Your security policies require you to control every profile |
With Managed profile, Testsigma creates a user-data directory inside the Testsigma data directory on the first session and reuses it afterwards, along with any browser settings you apply. Install the recorder extension from the Chrome Web Store once.
Use your own browser profile
Section titled “Use your own browser profile”-
Create the profile folder outside the Testsigma data directory and outside the browser’s default user-data folders.
-
Grant Testsigma read and write access to that folder.
-
In the test configuration settings, add the Desired Capabilities for your browser, from the table below.
-
Install the recorder extension in that profile, from the Chrome Web Store or through your IT extension policy.
| Browser | Key | Data type | Value |
|---|---|---|---|
| Chrome | goog:chromeOptions | String | {"args":["--user-data-dir=<Profile Path>"]} |
| Microsoft Edge | MsOptions | String | {"args":["--user-data-dir=<Profile Path>"]} |
Replace <Profile Path> with the folder you created. To use a named profile inside that folder rather than the default one, pass --profile-directory=<folder name> alongside --user-data-dir, such as Profile 1. The default profile needs only --user-data-dir.
Default user-data folders
Section titled “Default user-data folders”An automation profile cannot live inside the browser’s default user-data folder. The restriction comes from Chrome and Edge, not from Testsigma: anything inside these directories is not accessible to automation, and Testsigma cannot launch it.
| Browser | Windows | macOS | Linux |
|---|---|---|---|
| Chrome | %LOCALAPPDATA%\Google\Chrome\User Data | ~/Library/Application Support/Google/Chrome | ~/.config/google-chrome |
| Microsoft Edge | %LOCALAPPDATA%\Microsoft\Edge\User Data | ~/Library/Application Support/Microsoft Edge | ~/.config/microsoft-edge |
Path tokens in desired capabilities
Section titled “Path tokens in desired capabilities”A literal path such as --user-data-dir=C:\Users\username\AppData\Roaming\... bakes in one machine’s username, so the capability works only on the agent it was written for. Path tokens let the agent fill in the machine-specific part, so one configuration works everywhere:
--user-data-dir=${TS_DATA_DIR}/browser-profiles/custom/testprofile| Token | Resolves to |
|---|---|
${TS_DATA_DIR} | The Testsigma agent’s data directory, honoring a custom ENV_TS_DATA_DIR if IT set one at install |
${TS_USER_HOME} | The home directory of the OS account running the agent |
These 2 tokens are portable and behave the same on Windows, macOS, and Linux. Native OS aliases such as %APPDATA%, $HOME, and ~/ also work, but only on their own platform.
Set debug points
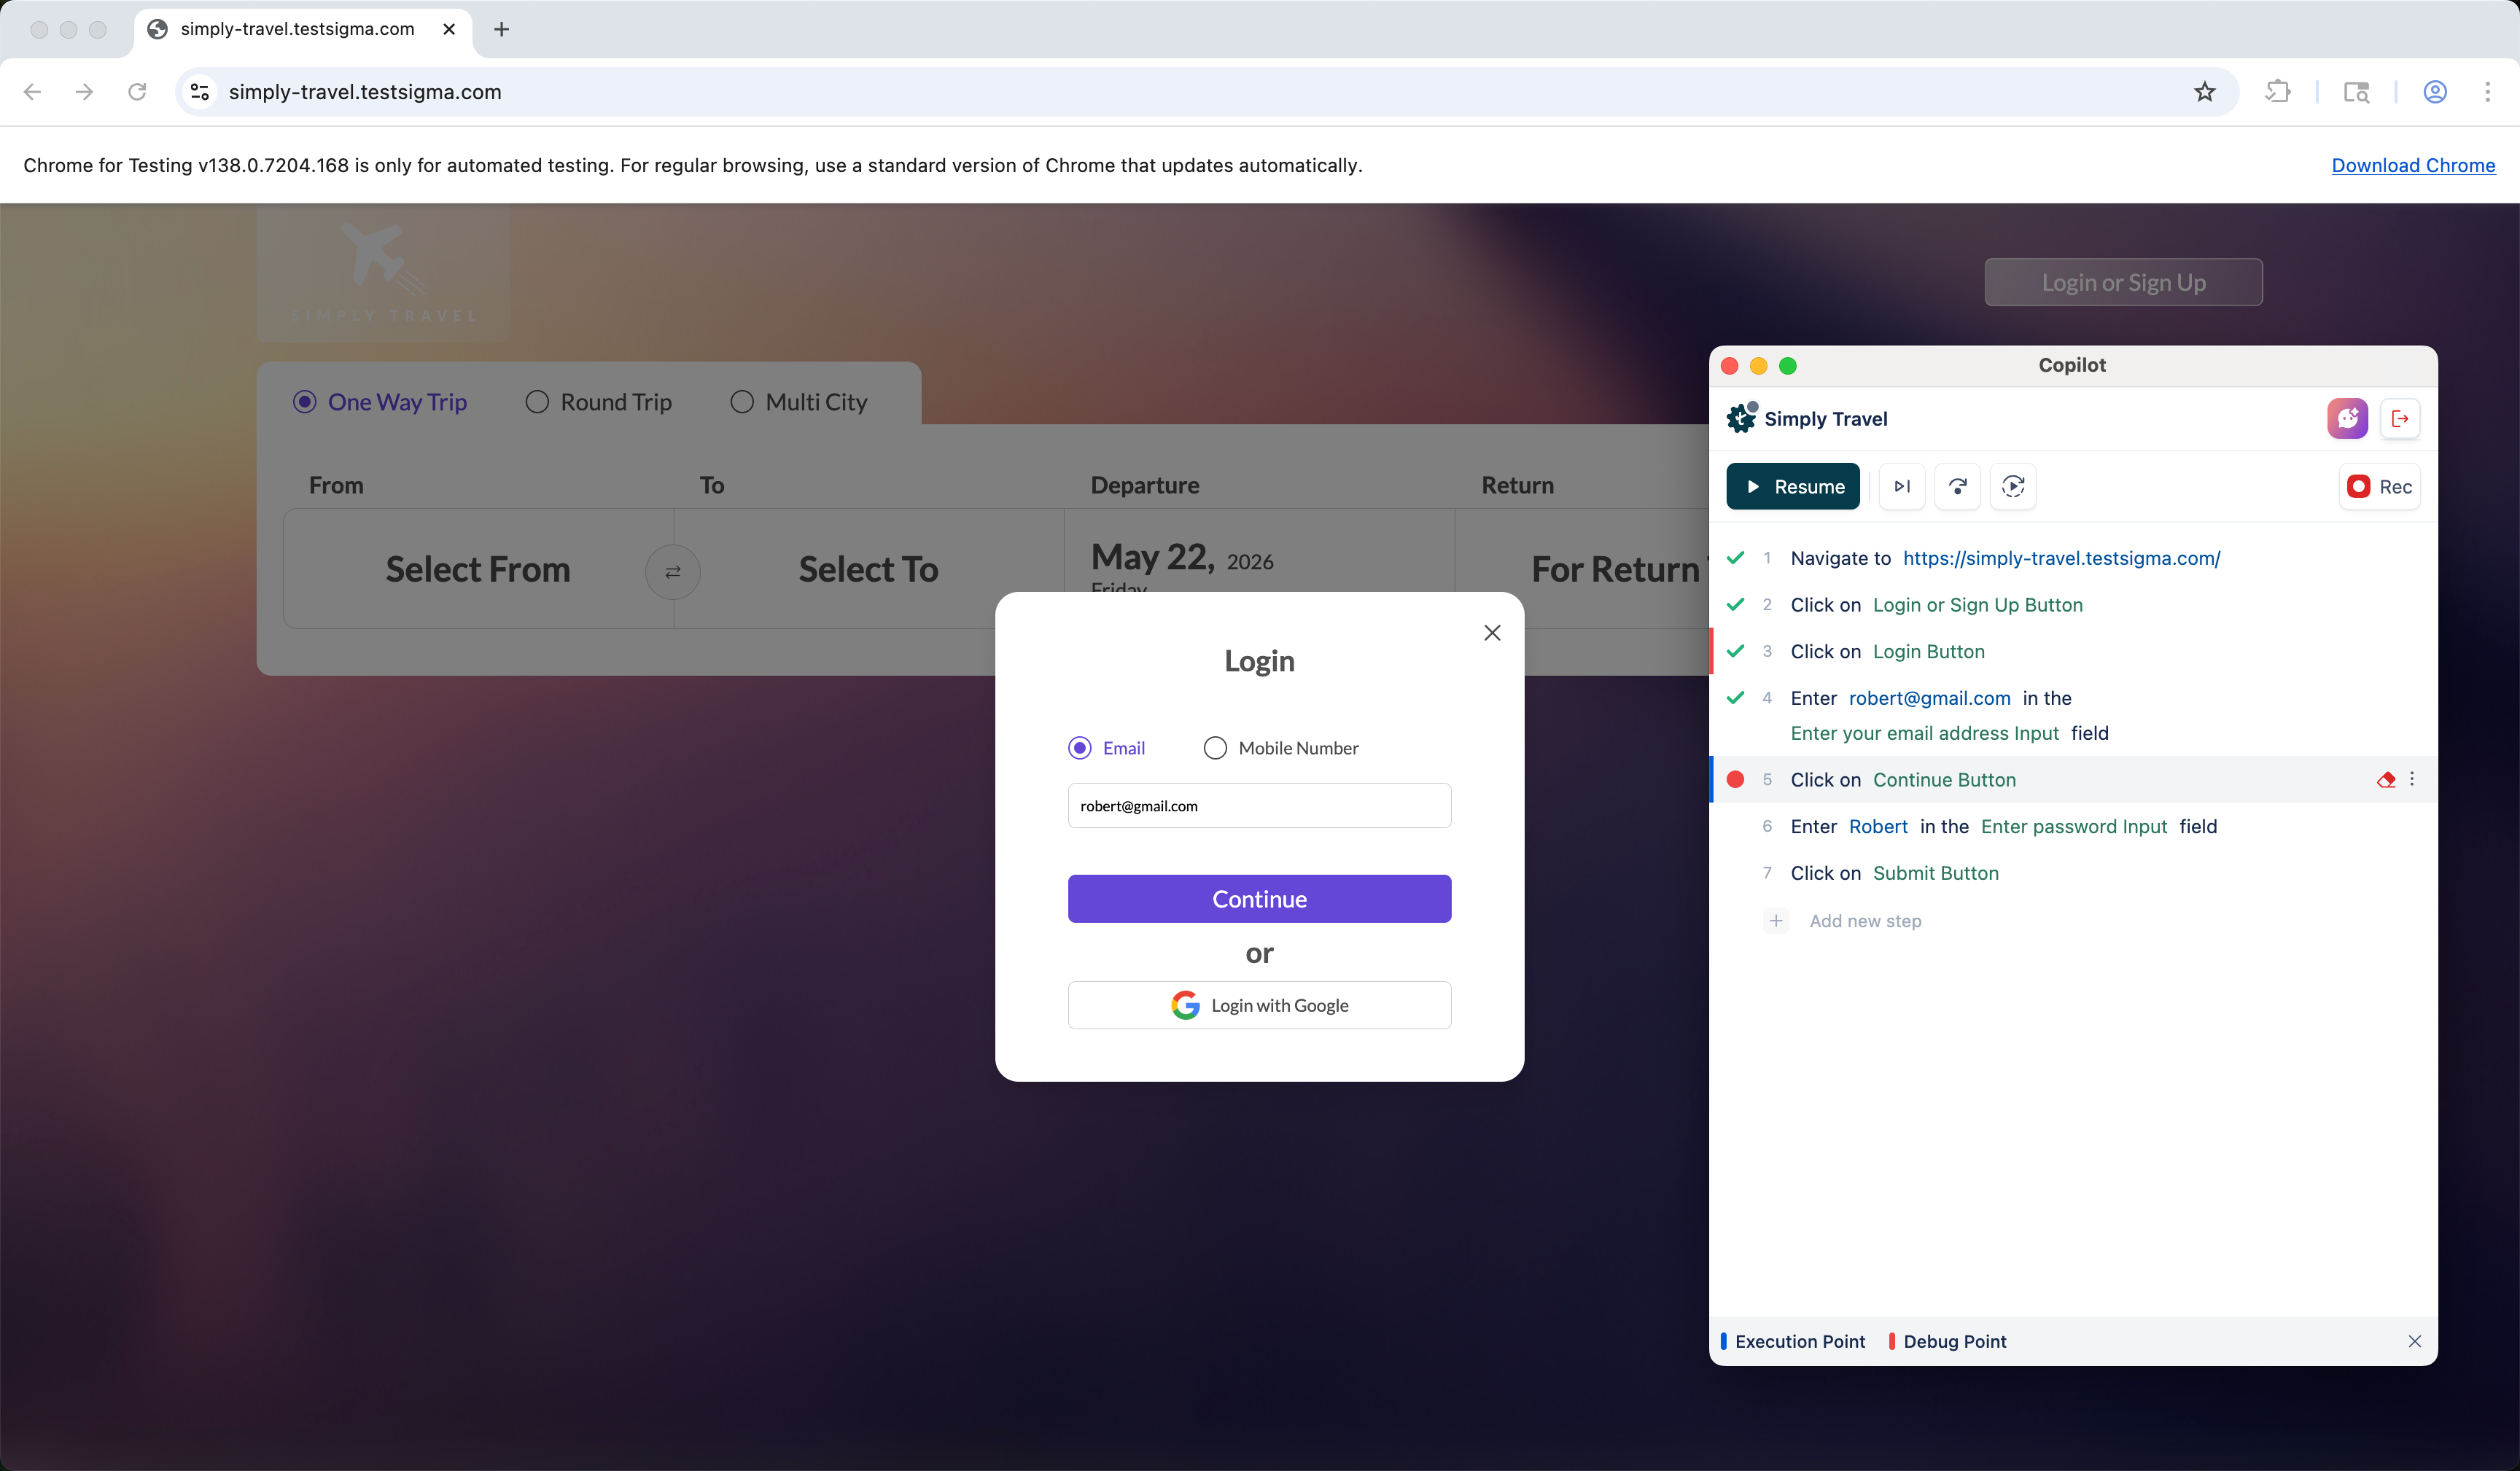
Section titled “Set debug points”A debug point is a checkpoint on a step that pauses a run there, so you can inspect the application state and decide what to do next. Add them before a session from Set Initial Debug Point, or during a run.
Hover over a step that has not executed yet and click the Place Debug Point icon. Repeat on any other steps you want to pause at. To clear a debug point, click its red dot again, and execution continues past that step.
The step widget marks both the debug point and the execution point.
Use the debug toolbar
Section titled “Use the debug toolbar”The toolbar is global, and its controls are enabled when a run is paused at a debug point or on a failure.
- Resume: continues from the next step, without restarting. Use it after you have inspected the state and changed the test case, to validate the change
- Pause: stops the run after the current step finishes. Use it when something looks wrong and you want to review the state before deciding
- Step Over: runs the paused step, then pauses on the next one. Use it to move through a test one step at a time
- Skip Over: skips the paused step without running it, and pauses on the next one. Use it to get past a failing step instead of fixing it now
- Restart Execution: clears the session and starts fresh from the first step. Use it after larger changes, when you want a clean run rather than the paused session’s state. It is available only while execution is paused
Debug steps inside a loop
Section titled “Debug steps inside a loop”Inspect or change loop behavior once execution has paused, failed, or finished.
To see how many times a loop has run, select the Iteration dropdown next to the step and review the execution count.
Inside a loop, added steps follow the same rule as anywhere else. A step added below the execution point runs in the current iteration. A step added above it runs from the next iteration onward.
While execution is paused, you can add steps to the loop sequence, drag steps into a different order, create elements on a step in the iteration, and delete steps you do not need. Click Resume afterwards to continue from the next step that has not run.
Diagnose a failed step
Section titled “Diagnose a failed step”Copilot pauses and highlights the step when a run fails or reaches a debug point.
Click Step Options on the step, then View Result, and review the diagnostic data: Error Message, Element, Test Data, Step Settings, Metadata, and Step Details. Mobile sessions also carry screenshots.
Fix an “Element Not Found” error
Section titled “Fix an “Element Not Found” error”The element is on the page, but Testsigma cannot identify it from the properties stored against it.
Click Step Options, then View Result, and click the element name to see its identification properties. Compare those properties against the current application UI to find why the match failed. Update the element, click Update Step, and restart the execution.
Frequently asked questions
Section titled “Frequently asked questions”What does Copilot need before it can start?
Section titled “What does Copilot need before it can start?”Testsigma Terminal, installed and running, for a session on a local device. It manages the agent, and one agent serves Copilot, remote executions, and ad-hoc runs. See Testsigma Terminal for the requirements, the agent relationship, and the setup failures.
Where are the Terminal and agent logs?
Section titled “Where are the Terminal and agent logs?”Click Logs on the Testsigma Terminal home screen, which carries Terminal, agent, and execution logs separately. See Testsigma Terminal.
For anything not covered here, contact Testsigma support at support@testsigma.com.
Was this page helpful?
Thanks for the feedback.