

Release readiness
Arcus answers “can this sprint ship?” with four QI (Quality Intelligence) Metrics and a release gate. Coverage, Pass Rate, and Confidence measure the testing. Readiness rolls them into one score. The release gate checks them, plus critical failures and flaky tests, against your thresholds and gives a verdict: Ready, Conditional, or Not Ready.
Where you see readiness
Section titled “Where you see readiness”| Where | What it shows |
|---|---|
| QI Home, Sprints and Adhoc tabs | Each sprint or session’s Readiness and Coverage, grouped into Current Sprints, Upcoming, and Closed |
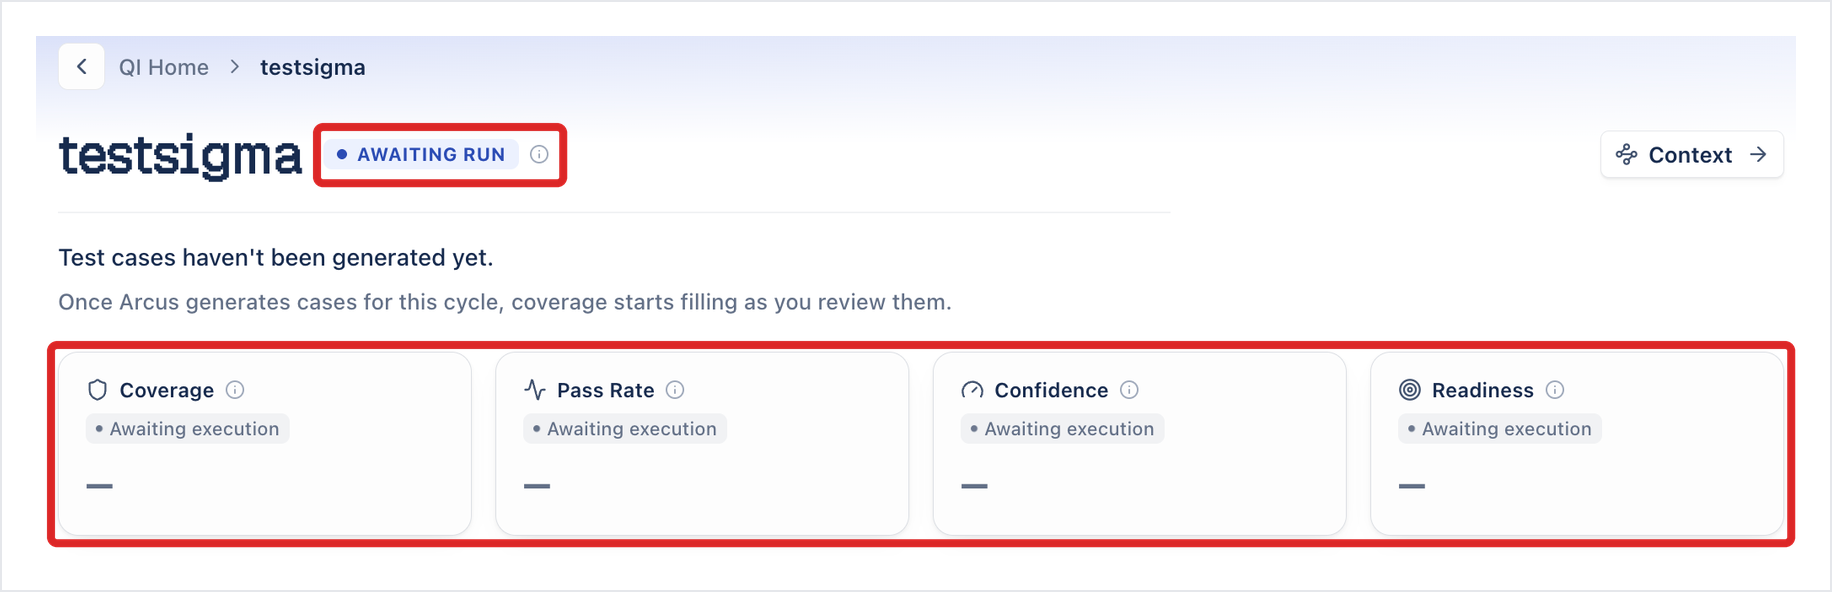
| A sprint or Adhoc session | The verdict chip next to its name, the reason for it, and the four metric cards |
| Dashboard > Advanced > Readiness | One verdict across the active sprints, what blocks it, Confidence over time, and the open risks. See Readiness across sprints |
| Dashboard > Advanced > Coverage | Requirement coverage and the gaps in it. See Coverage and gaps |
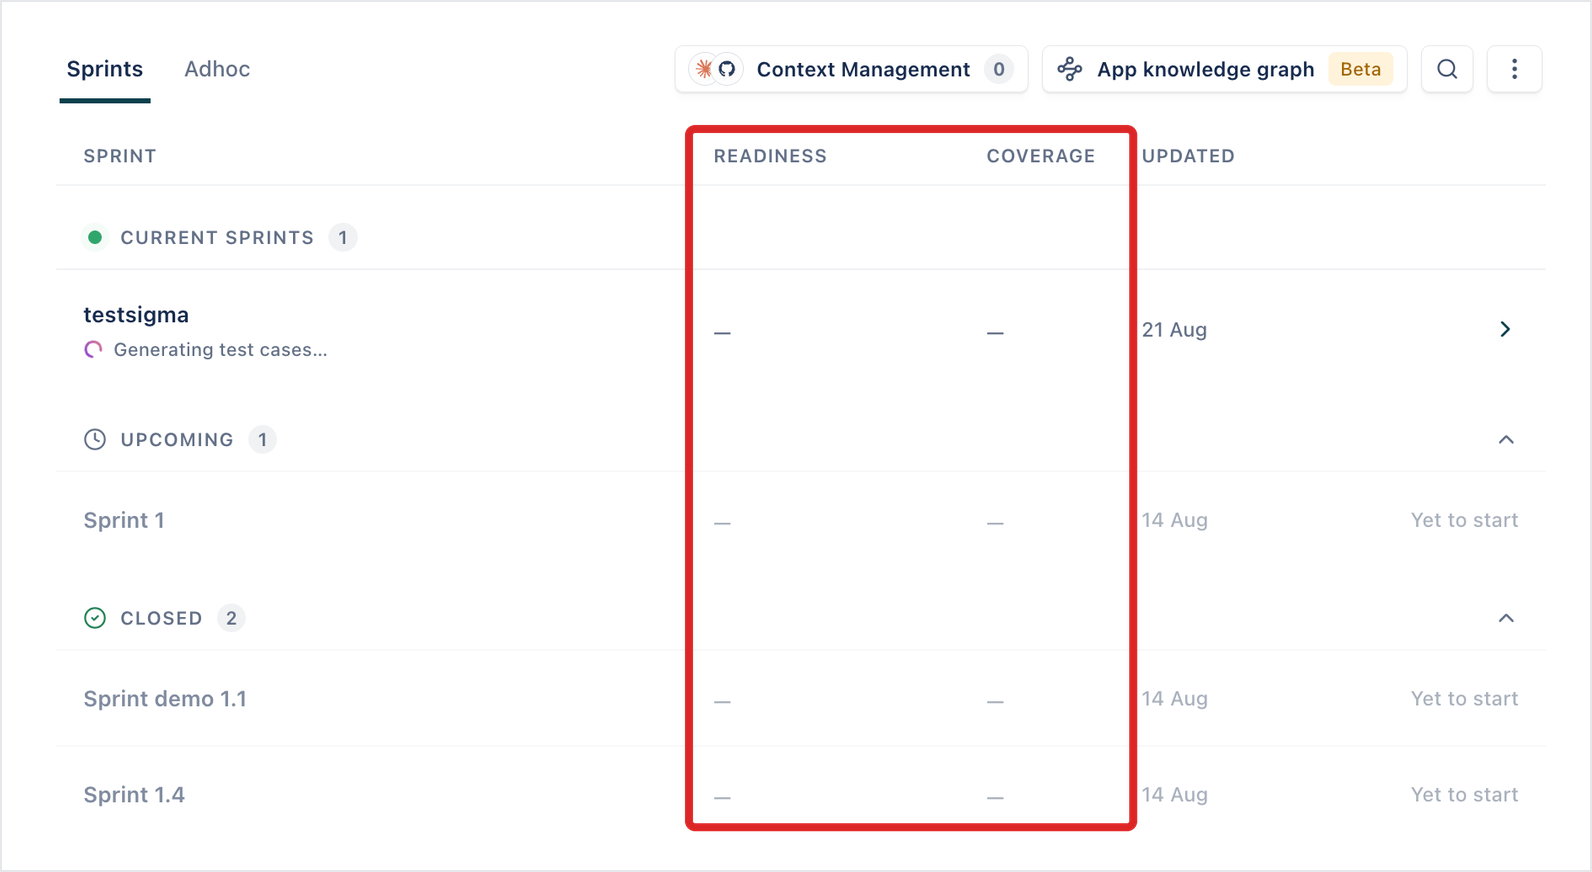
In a sprint or Adhoc session, the verdict chip sits next to the name. Hover its info icon for how the verdict works. Each metric card has an info icon with the metric’s definition and target, and a sliders icon (Configure {metric} thresholds) that opens Settings > QI Metrics.
The QI Metrics
Section titled “The QI Metrics”The metrics build on each other. Coverage reports how much of the generated test surface you accepted. Pass Rate reports how much of what ran passed. Confidence reports how far those results can be trusted. Readiness combines the three.
Coverage
Section titled “Coverage”The share of the generated test cases that you accepted. It rises as you review test cases, before anything runs.
Coverage = Accepted Tests ÷ (Accepted + Pending) × 100Pending test cases count against coverage. Rejected test cases are left out, so rejecting a weak test case doesn’t lower it. Coverage says nothing about whether the test cases pass. Default target: 85% or above.
Pass Rate
Section titled “Pass Rate”The share of executed units that passed, where a unit is one test case on one machine. Each unit counts once, on its latest result. Passed, failed, and blocked results count, and a blocked result counts as not passed. Skipped, not-run, and in-progress units are left out. A manual result has no machine, so it counts as its own unit, apart from the automated ones.
Pass Rate = Passed Unique (Test case × Machine) Units ÷ Total Unique (Test case × Machine) Units with Terminal Status × 100Pass Rate stays empty until a test plan runs. Default target: 95% or above.
Confidence
Section titled “Confidence”The priority-weighted share of the planned scope that ran trustworthily: executed, and not flaky. A test case that has both a passed and a failed result in its last 3 results is flaky and isn’t trusted. Blocked results don’t count toward those 3. So a suite that passes unpredictably scores below one that passes consistently. Weights follow the position of the test case’s priority in your priority list: the top priority weighs 3, the second weighs 2, and the rest weigh 1. With the default priorities, that is Critical 3, Major 2, and Medium and Minor 1. Flaky critical test cases cost the most.
Confidence = Trustworthy Weight ÷ Total Weight × 100Confidence counts the scope you planned. If you generate a wide set of test cases and run only some of them, the rest stay in the total, and the score shows validation you planned but didn’t do.
Confidence falls in one of three bands:
| Band | Default | Meaning |
|---|---|---|
| HIGH | 80% of score or above | Trustworthy signals |
| MEDIUM | 50% to 79% of score | Some issues |
| LOW | Below 50%, derived from MEDIUM | Unreliable signals |
Readiness
Section titled “Readiness”Pass Rate, Coverage, and Confidence in one 0 to 100 shippability score. It stays empty until a run reports. The card in a sprint says Readiness. Settings > QI Metrics calls it Release Readiness.
Release Readiness = (Pass Rate × 0.40) + (Coverage × 0.25) + (Confidence × 0.35)Pass Rate has the most weight because a failing test is a more direct signal than a gap in coverage. The weights are fixed.
The release gate
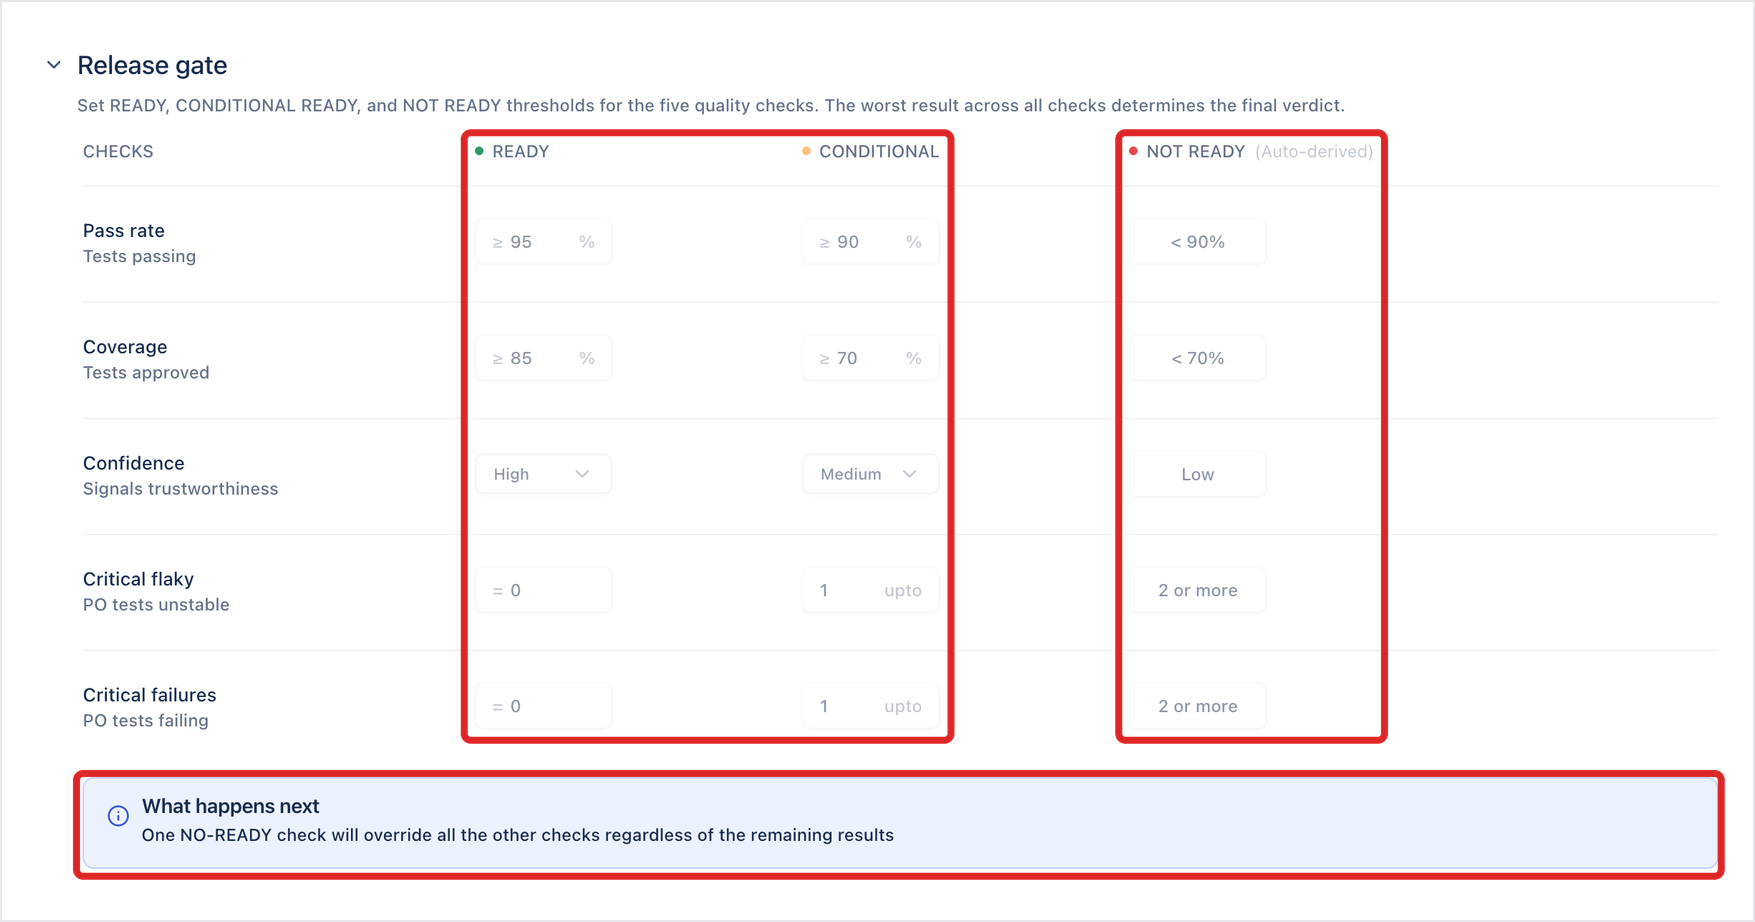
Section titled “The release gate”The release gate runs five checks. Each check lands in Ready, Conditional, or Not Ready, and the worst one is the verdict. A single Not Ready check makes the verdict Not Ready, whatever the other checks say.
| Check | Ready | Conditional | Not Ready |
|---|---|---|---|
| Pass rate: tests passing | 95% or above | 90% or above | Below 90% |
| Coverage: tests approved | 85% or above | 70% or above | Below 70% |
| Confidence: signals trustworthiness | High | Medium | Low |
| Critical flaky: critical tests unstable | 0 | Up to 1 | 2 or more |
| Critical failures: critical tests failed or blocked | 0 | Up to 1 | 2 or more |
These are the defaults. You set the Ready and Conditional values. The Not Ready values follow from them. See Change the thresholds.
The verdict chip’s info text sums it up: “Ready = every check passes. Conditional = a soft threshold is missed. Not Ready = a hard threshold is breached. A check with no data yet is skipped.”
A critical test case is one with the top priority in your priority list, Critical by default. Whatever you rename it to, the top priority is the one that counts. Critical failures counts critical test cases whose latest result on a machine is failed or blocked. Critical flaky counts critical test cases that are flaky.
Before the first run
Section titled “Before the first run”Coverage is live from the moment test cases are generated. The other metrics, and the verdict, wait for run results.
| Generated, none accepted | Accepted, no runs | After runs | |
|---|---|---|---|
| Coverage | 0% | Rises as you accept | Rises as you accept |
| Pass Rate | Awaiting execution | Awaiting execution | A percentage |
| Confidence | Awaiting execution | Awaiting execution | A percentage and its band |
| Readiness | Awaiting execution | Awaiting execution | A 0 to 100 score |
| Verdict | AWAITING RUN | AWAITING RUN | READY, CONDITIONAL, or NOT READY |
Before test cases exist, a sprint reads “Test cases haven’t been generated yet. Once Arcus generates cases for this cycle, coverage starts filling as you review them.”
After a run, the sprint header says what the verdict means:
| Verdict | Header | Reason line |
|---|---|---|
| READY | “This cycle is ready to release.” | “Every release-gate check is passing on the latest run.” |
| CONDITIONAL | “Ready with conditions.” | The check holding the verdict back |
| NOT READY | “Not ready to release.” | The check holding the verdict back |
The reason line names the first check that is Not Ready, or, if none is, the first that is Conditional. It reads one of these:
- For Pass rate, Coverage, or Confidence: “{Check} is {value}%, below the {Ready value}% bar.” For example, “Coverage is 24%, below the 85% bar.” The bar is always the check’s Ready value, even when the check is Not Ready.
- For Critical failures or Critical flaky tests: “{count} critical failures are holding the gate.” or “{count} critical flaky tests are holding the gate.”
Before a run, the reason line can already name a failing Coverage check, because Coverage is live.
Readiness across sprints
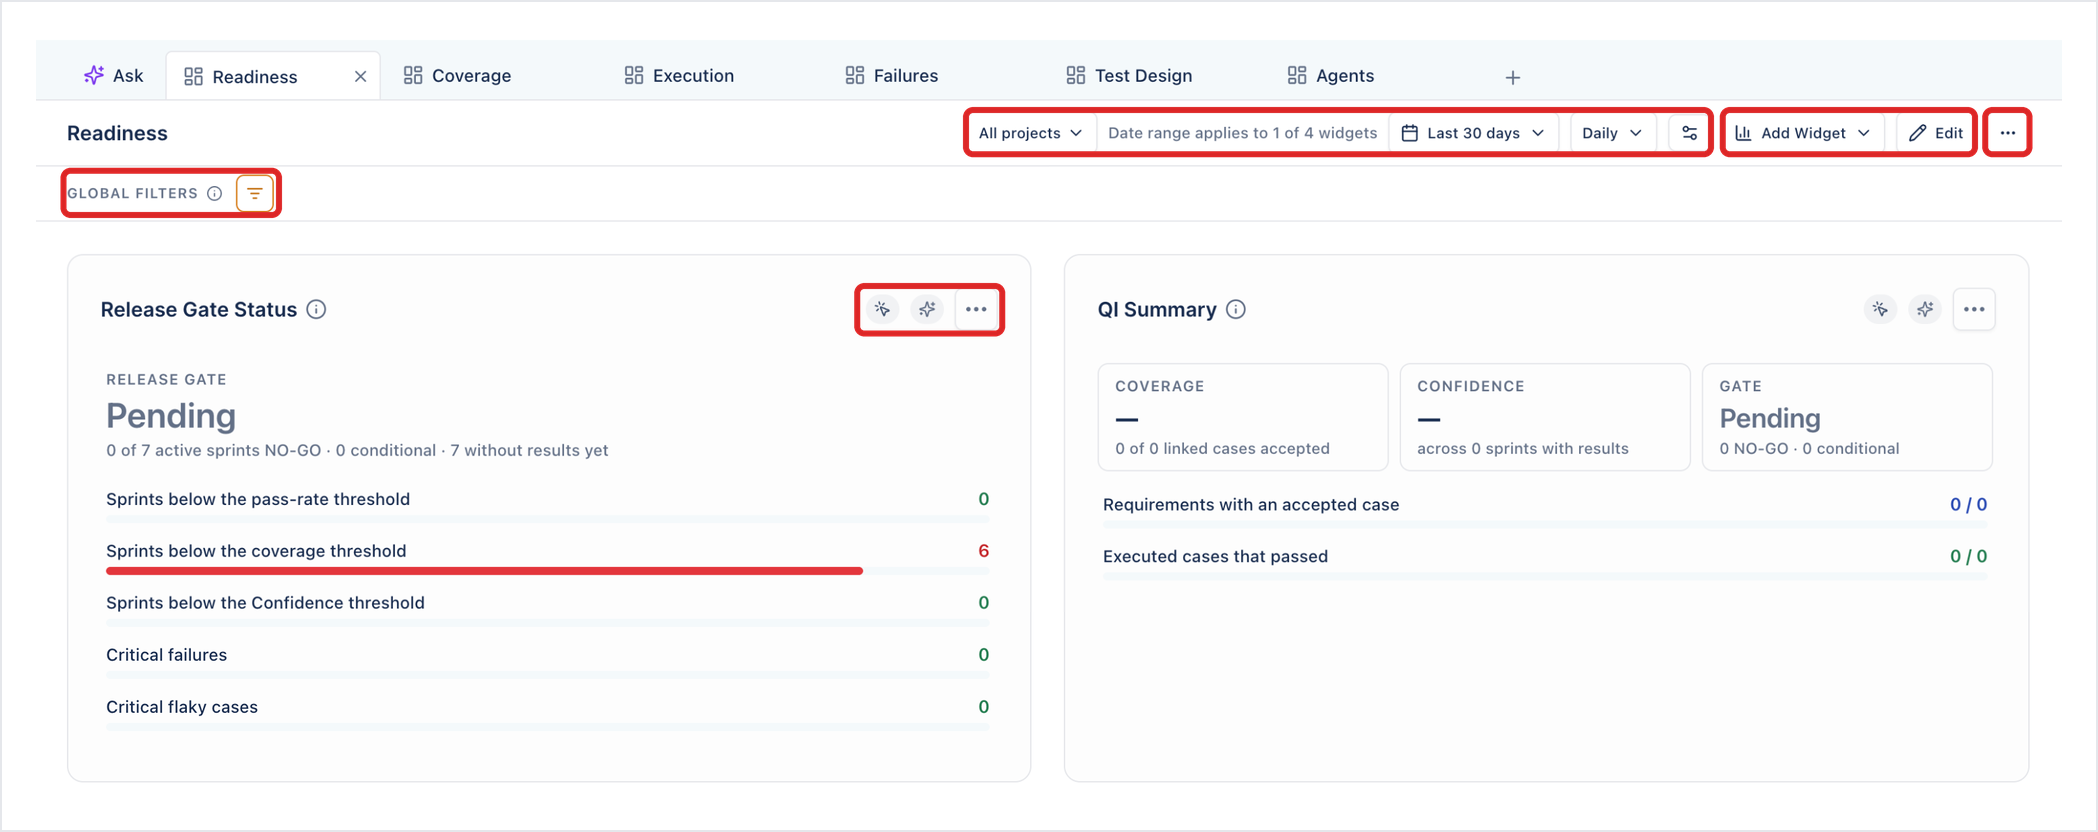
Section titled “Readiness across sprints”The Readiness dashboard (Dashboard > Advanced > Readiness) shows readiness across every active sprint and Adhoc session in scope, not one at a time. Use the project list at the top to look at one project. See Dashboards.
Release Gate Status
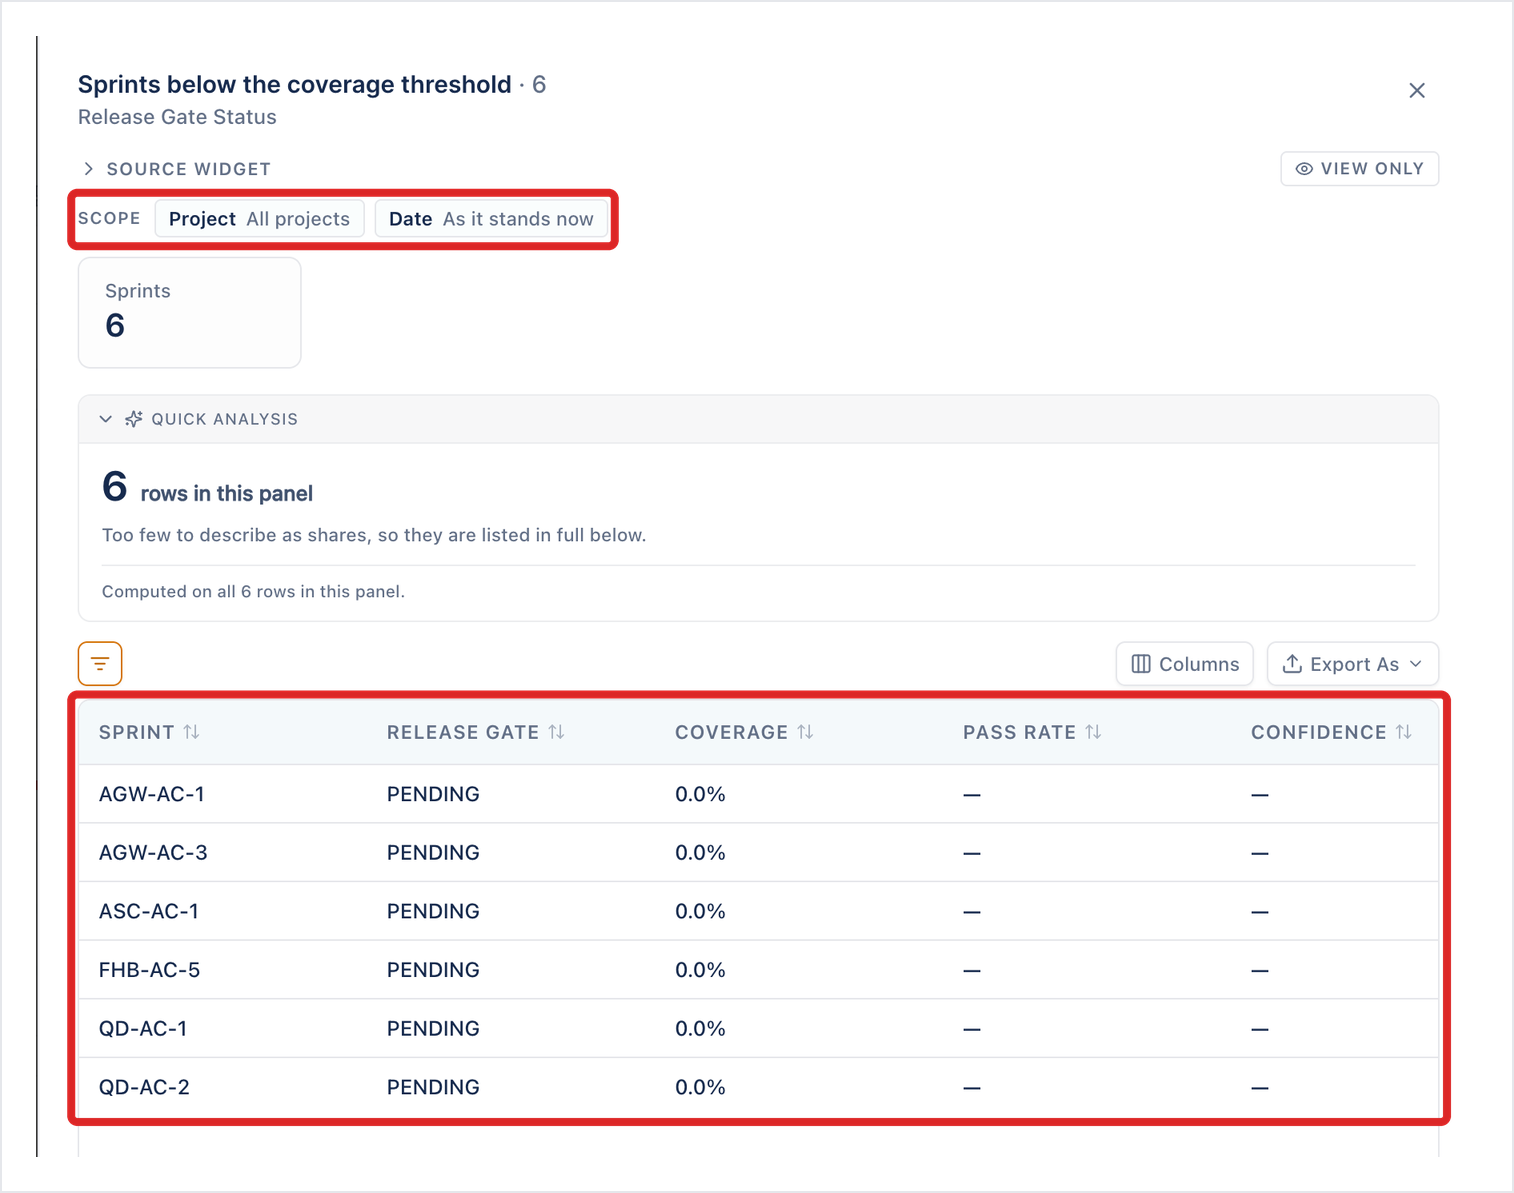
Section titled “Release Gate Status”One verdict for the active sprints in scope, and how many sprints fail each check: Sprints below the pass-rate threshold, Sprints below the coverage threshold, Sprints below the Confidence threshold, Critical failures, and Critical flaky cases.
Each sprint gets its own gate, the worst of its five checks. The widget’s verdict is the worst gate among the active sprints:
| Widget verdict | When |
|---|---|
| Not ready | Any active sprint is NO-GO |
| Conditional | Any active sprint is CONDITIONAL GO |
| Ready | Every sprint with results is GO |
| Pending | No sprint has results yet |
A check that needs results reads PENDING until the sprint has some. Click Explore on the widget to see the current state in words, for example “Pending: 0 of 7 active sprints are NO-GO and 0 conditional; 7 have no results yet.”
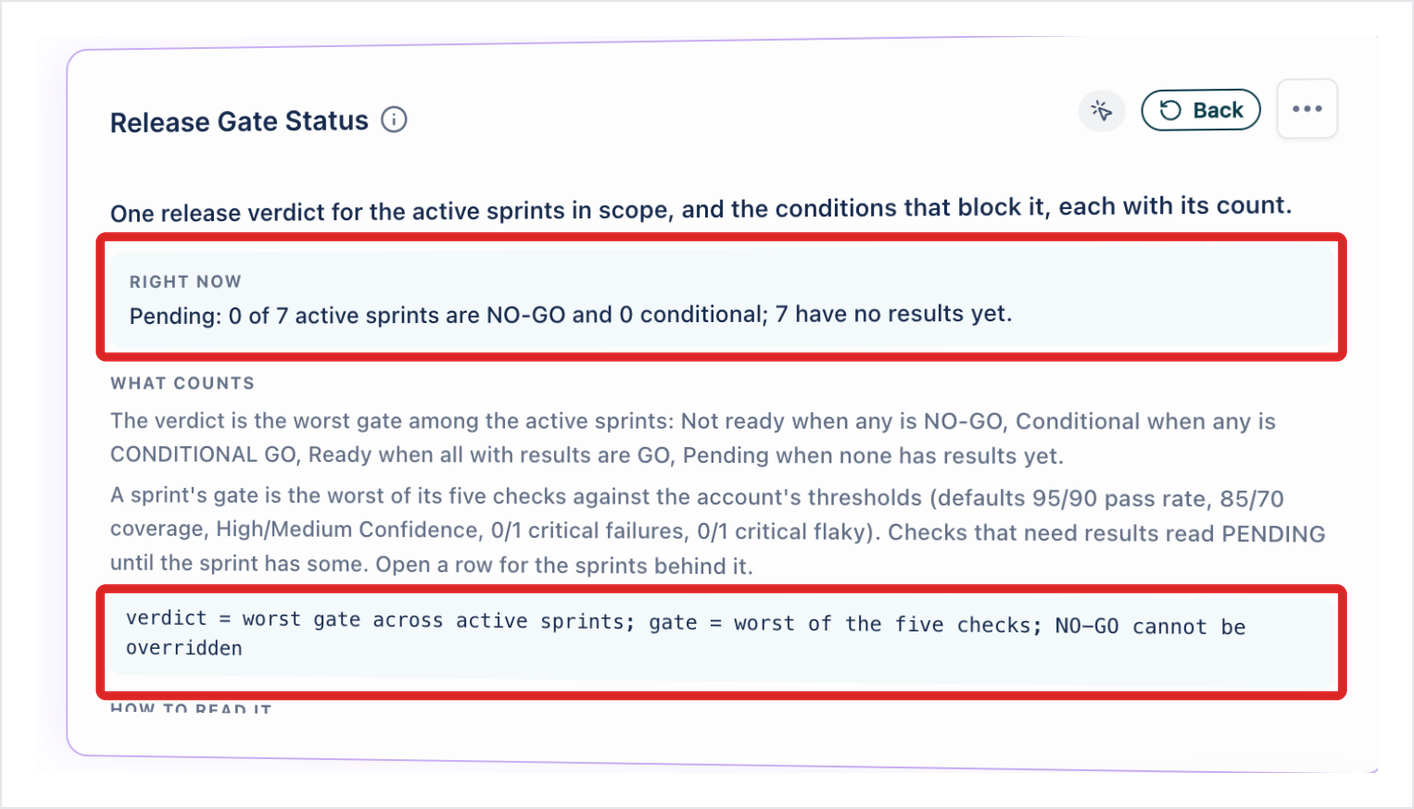
Click a row to see the sprints behind it. The panel lists each sprint with its Release gate, Coverage, Pass rate, Confidence, Critical failures, Critical flaky, Release Readiness, Status, and Started, and you can export the list.
QI Summary
Section titled “QI Summary”Coverage, Confidence, and the gate for the active sprints in scope. Coverage counts accepted test cases linked to requirements. Confidence is the average of the sprints’ Confidence. The gate is the worst sprint’s. Two bars show Requirements with an accepted case and Executed cases that passed.
Confidence Trend
Section titled “Confidence Trend”The average Confidence of the sprints that started in each period. Each point stands for its period, not a running total, so a dip means that period was worse.
Open Risk Items
Section titled “Open Risk Items”What stands between the project and a release, one row per kind of risk with how many are open. Release-blocking risks come first, then the ones that make the release conditional, then risks to watch.
| Gate effect | Risks |
|---|---|
| Not Ready | A P1 test case’s latest result failed, an open P1 defect, a blocked P1 test case |
| Moderate | A blocked P2 test case, a review pending for over 2 days, a requirement with no accepted test case |
| Risk item | Other test cases blocked for over 2 days, recurring failures (failed in the last 3 runs), failures with no bug or note after 2 days, flaky test cases |
The widget sorts test cases by priority name, not by position in the list:
- P1: a priority named P0, P1, Blocker, Highest, Urgent, or starting with Critical. With the default priorities, that is Critical.
- P2: a priority named P2, or starting with High or Major. With the default priorities, that is Major.
A P1 defect is one with the top priority in its tracker, for example Highest in Jira or Urgent in ClickUp.
Because the release gate goes by position and this widget goes by name, the two can disagree if you rename your priorities.
Click a row to see each item, with its Gate effect, Risk, ID, Item, Detail, Owner, and Since.
Coverage and gaps
Section titled “Coverage and gaps”Coverage on a sprint counts accepted test cases. The Coverage dashboard (Dashboard > Advanced > Coverage) shows which requirements those test cases cover, and which they miss.
| Widget | What it shows |
|---|---|
| Requirement Coverage | Coverage of the requirements in active sprints: accepted test cases out of the accepted and pending ones linked to them |
| Coverage Trend | Requirement Coverage over time. The latest point is today’s Requirement Coverage |
| Coverage Gaps | Requirements in active sprints with no accepted test case, one row per requirement with its sprints. Requirements with no test case at all come first. A requirement with only one accepted test case isn’t a gap. Shows the first 100 |
| Untraced Test Cases | Test cases linked to no requirement. The mirror image of Coverage Gaps. Shows the 100 most recent |
| Traceability Matrix | Each requirement against its test cases, with each test case’s acceptance, latest result, and defect. Requirements with no test case are rows too. Pending test cases are marked Pending, and rejected ones are left out. Shows the first 200 rows |
| Coverage By Folder | Requirement Coverage for each folder. The percentages are independent and don’t add up to 100 |
| Defect Linkage | Test cases that failed in a run, split by whether a defect was raised on the failure |
To close a gap, review the requirement’s pending test cases. In a sprint, Insights and activity also flags coverage gaps, such as a module at 0% coverage. See QI Home.
Change the thresholds
Section titled “Change the thresholds”Thresholds are set in Settings > QI Metrics. The page shows each metric’s formula, which you can’t change, and the thresholds, which you can.
-
Go to Settings > QI Metrics. In a sprint, you can also click a sliders icon on a metric card, or hover the verdict chip and click the settings icon next to it.
-
Click the edit icon (pencil) at the top right.
-
Under Confidence, set where HIGH starts at and MEDIUM starts at. LOW is follows from MEDIUM.
-
Under Release gate, set the READY and CONDITIONAL values for each check. For Pass rate and Coverage, enter percentages. For Confidence, choose a band. For Critical flaky and Critical failures, enter counts. The NOT READY values follow from them.
-
Click Save changes, or Cancel to discard them.
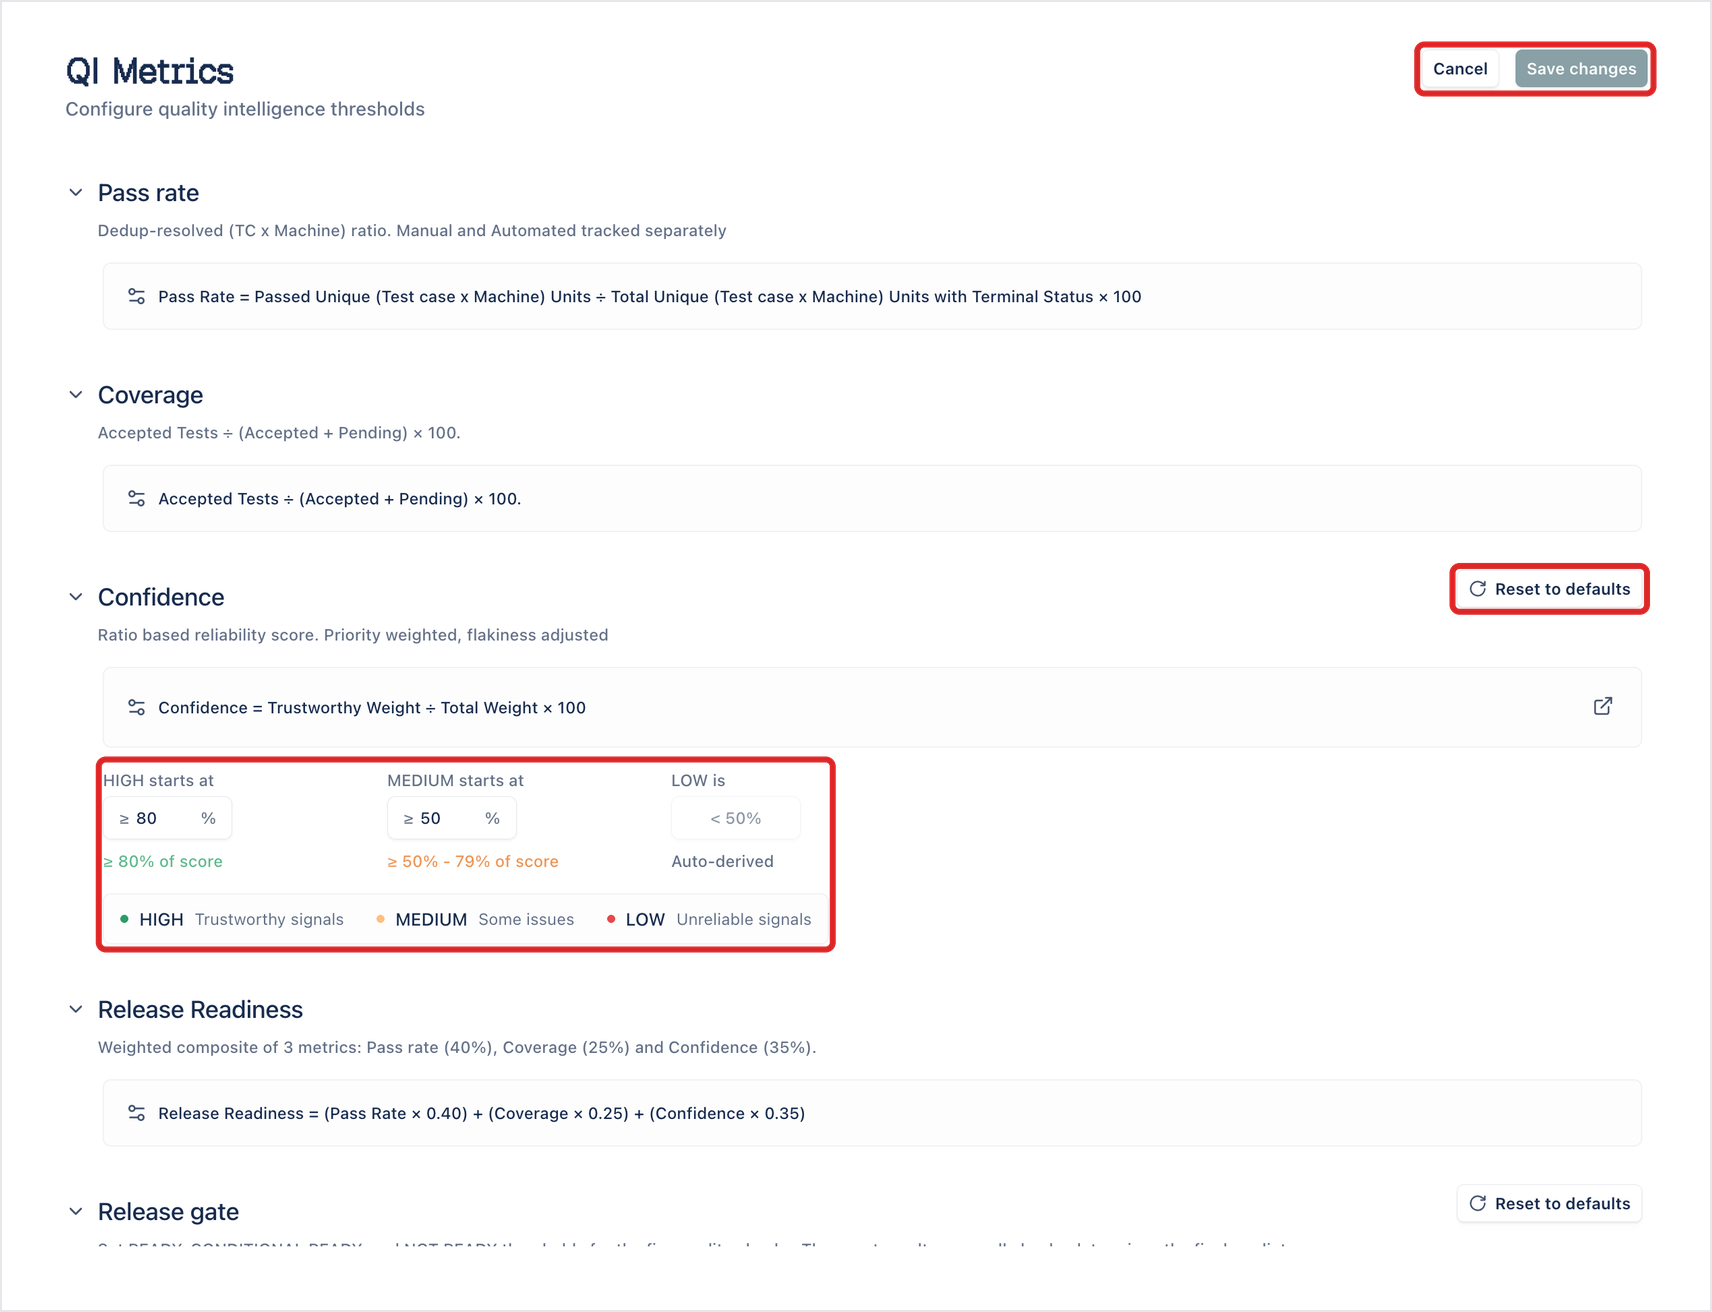
To go back to the default values, click Reset to defaults on the Confidence or Release gate section while editing, then Save changes.
The thresholds apply to the whole account, across every project. Anyone who can create or edit test cases sees the edit icon and can change them.
Arcus works out a sprint’s metrics and verdict each time you open it, with the current thresholds. A change applies to every sprint, including closed ones. A closed sprint doesn’t keep the verdict it had.
Coverage is 0% after test cases were generated
Section titled “Coverage is 0% after test cases were generated”Coverage counts accepted test cases, not generated ones. Generated test cases start as pending and hold coverage down until you accept them.
Pass Rate, Confidence, and Readiness are empty
Section titled “Pass Rate, Confidence, and Readiness are empty”They need run results. Until a test plan runs for the sprint, they show Awaiting execution and the verdict shows AWAITING RUN. Accepting test cases moves Coverage only.
The verdict is Not Ready when Readiness is high
Section titled “The verdict is Not Ready when Readiness is high”Readiness is a weighted average, and the verdict is the worst check. One check below its Conditional value, such as two failed or blocked critical test cases, makes the verdict Not Ready even when the other metrics are high.
The Readiness dashboard says Pending
Section titled “The Readiness dashboard says Pending”None of the active sprints in scope has run results yet. The widget’s verdict waits for at least one sprint with results.
Was this page helpful?
Thanks for the feedback.