


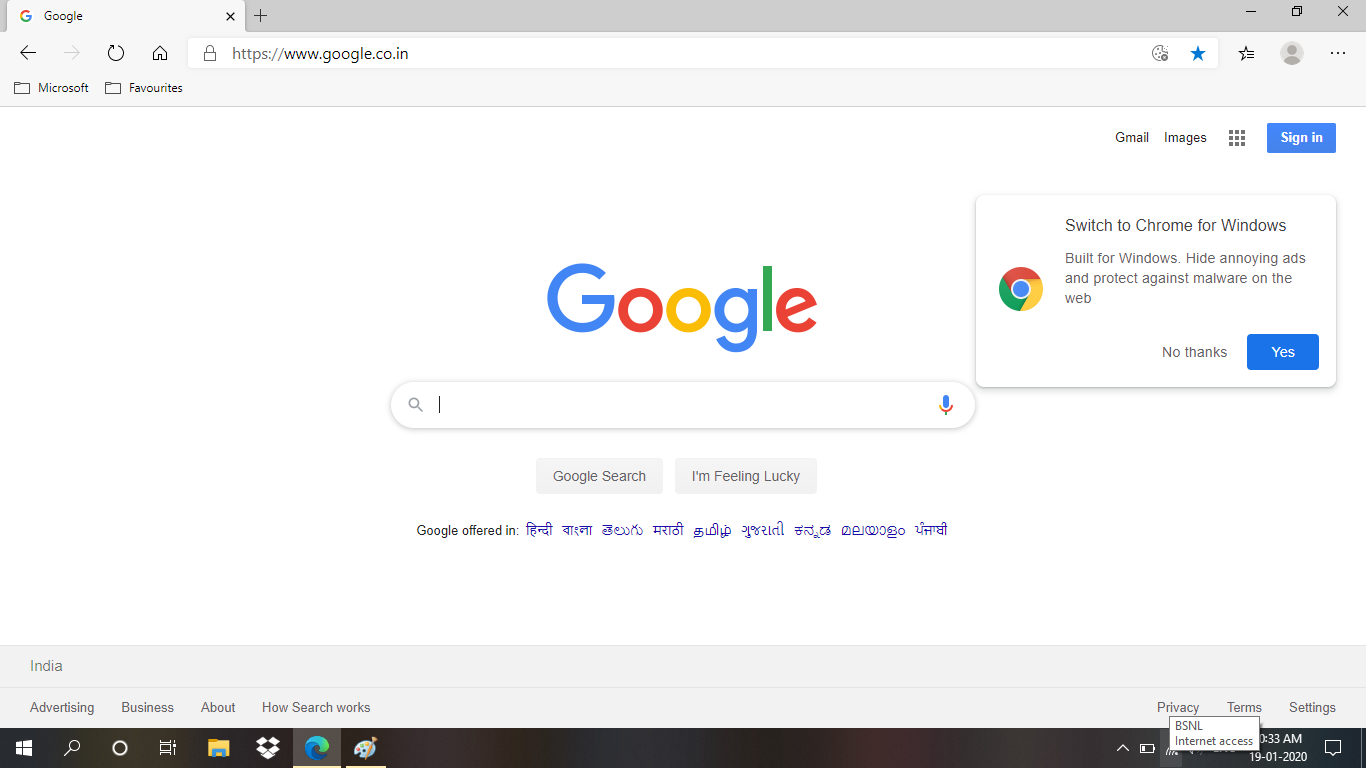
If you use the internet frequently, there are very few chances that you have not come across Google Chrome. By this statement, I can easily cover those people who have not even used this browser or their mode of internet surfing is a different one. So, even if I am on Microsoft Edge and I search for a query or open Google’s home page, I am forced just to check out this fantastic browser once:
This is a common scenario whether you have Chrome installed or not. Among all the people who have heard about it come the people who use it. Google launched its browser in 2008 to the public. Today, 14 years later, the browser is helping 3.3 billion users (more than WhatsApp) surf the internet around the globe.
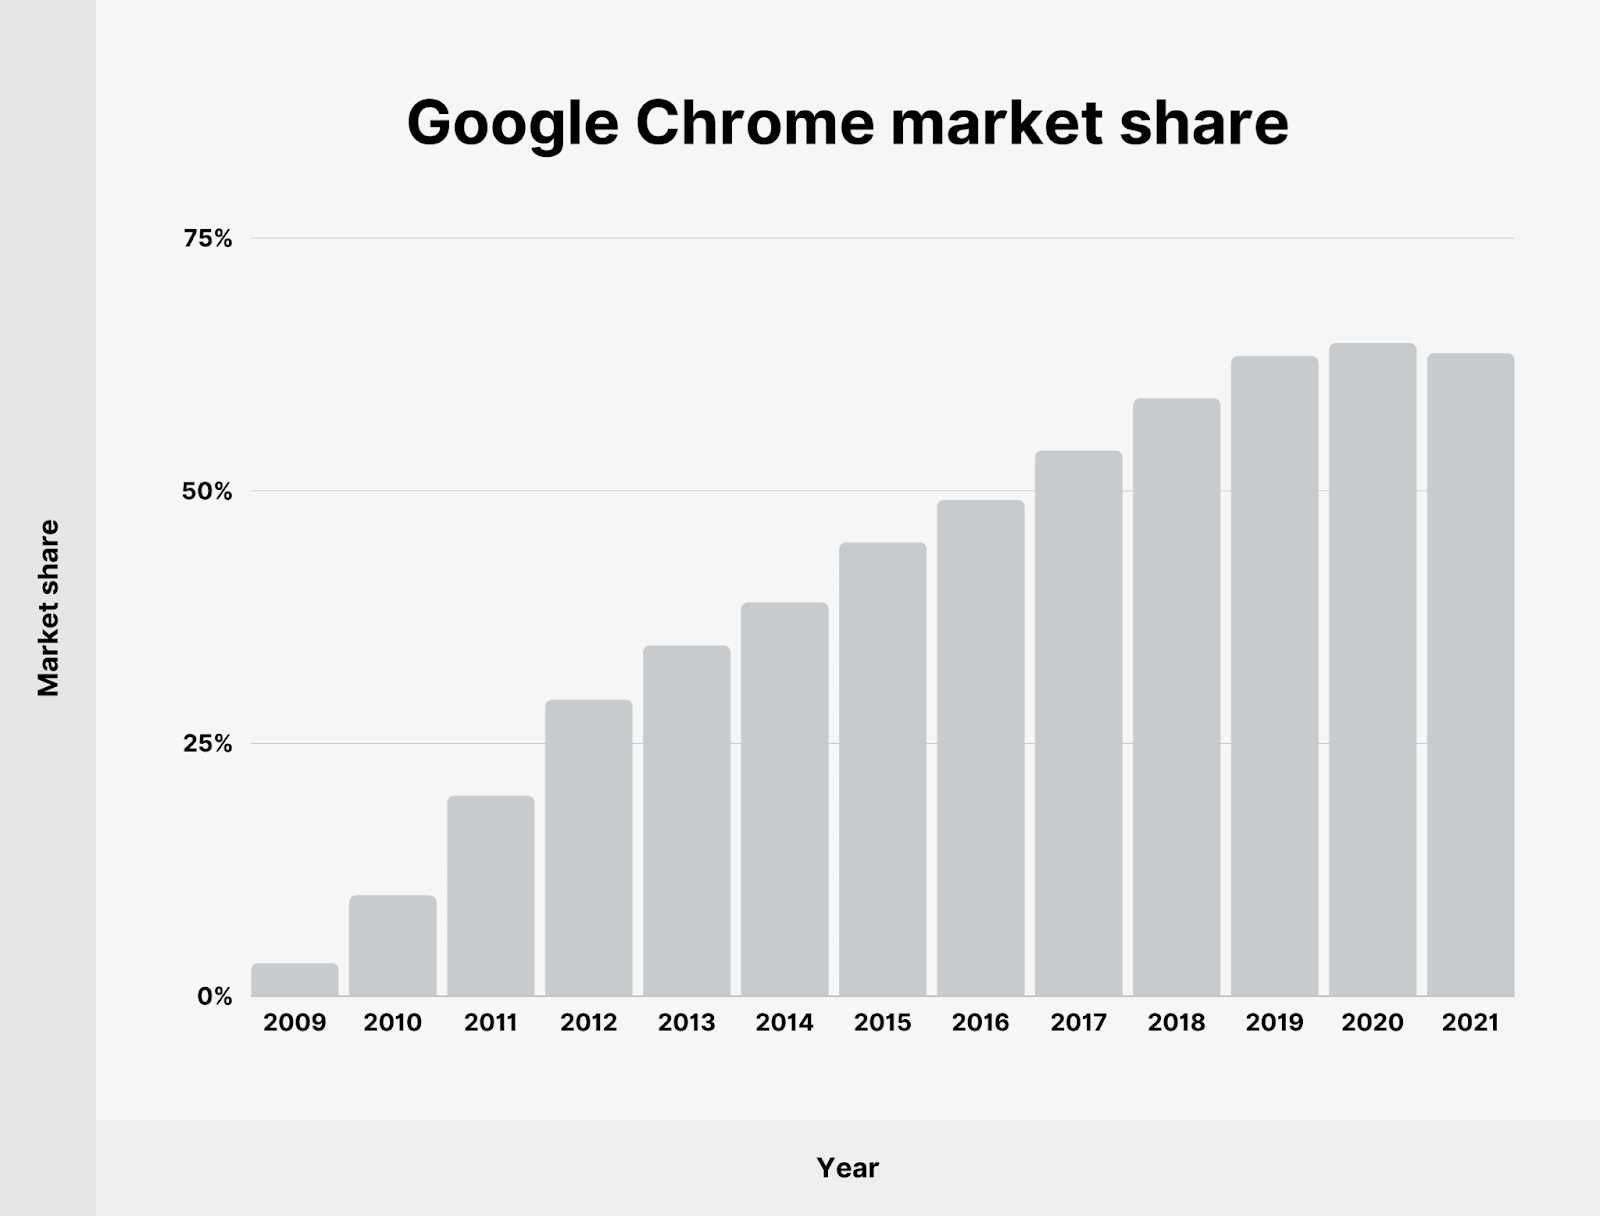
The following bar graph shows how Google Chrome reached a market share of more than 63%, which was merely 5% in 2009.
As a web developer and business owner, all these statistics point to one thing: there is a vast user base, and we need to make sure that everything is perfect when they surf our website. Google Chrome climbs to the top of the priority ladder when it’s time to test a web application for browser compatibility. This testing is a mix. For example, testing how our web application looks on a Google Chrome browser and checking if it supports all our APIs and other code. Our unsung hero is the web inspector in this way of testing practices and elements.
This post is the story of this hero, the web inspector, that may not be spoken about popularly when we talk about testing but believe me, you will use it in each type of testing, whether UI, cross-browser testing, or anything else.
Table Of Contents
What is a Web Inspector?
A web inspector is a tool (or feature) designed in the browser to let the developers and testers test the application’s front-end. Although the term “web inspector” is very generic, much like a “browser.” To specify a particular browser’s inspector, browser developers name their inspectors too. Google Chrome developers refer to their web inspector as Chrome Dev Tools, which are, in my opinion, a good choice.
Honestly, even though “inspector” looks like an outdated term, the feature itself has taken a shape that is much more profound than ever. Earlier, web inspectors could edit the code (as demonstrated later in this post) and check the value of various variables. Today, they can even tell you each request’s response time, lag time, etc. Chrome dev tools also offer network throttling which comes in handy in cross-browser testing.
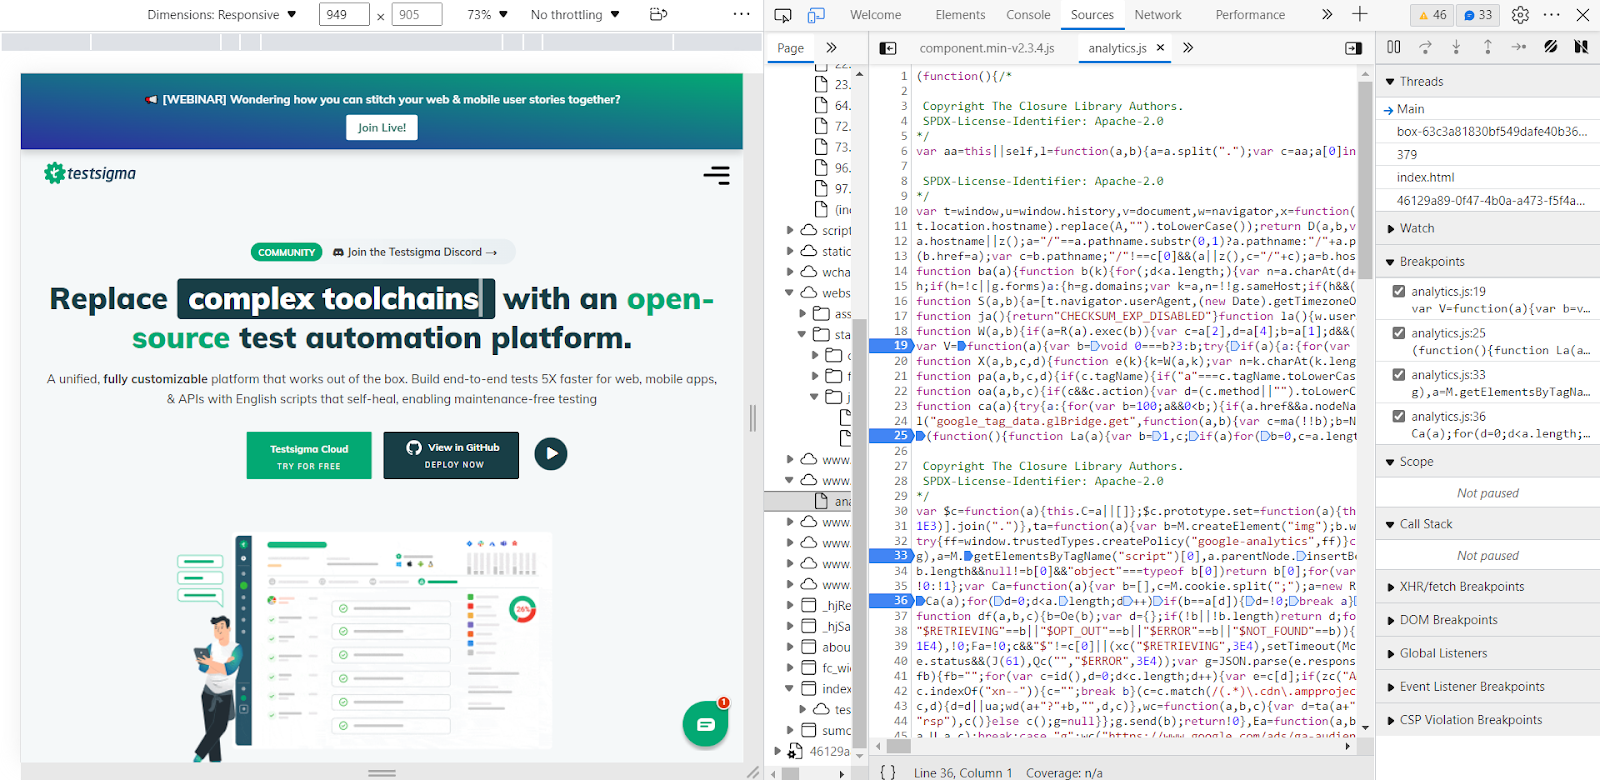
In general, a web inspector looks like this:
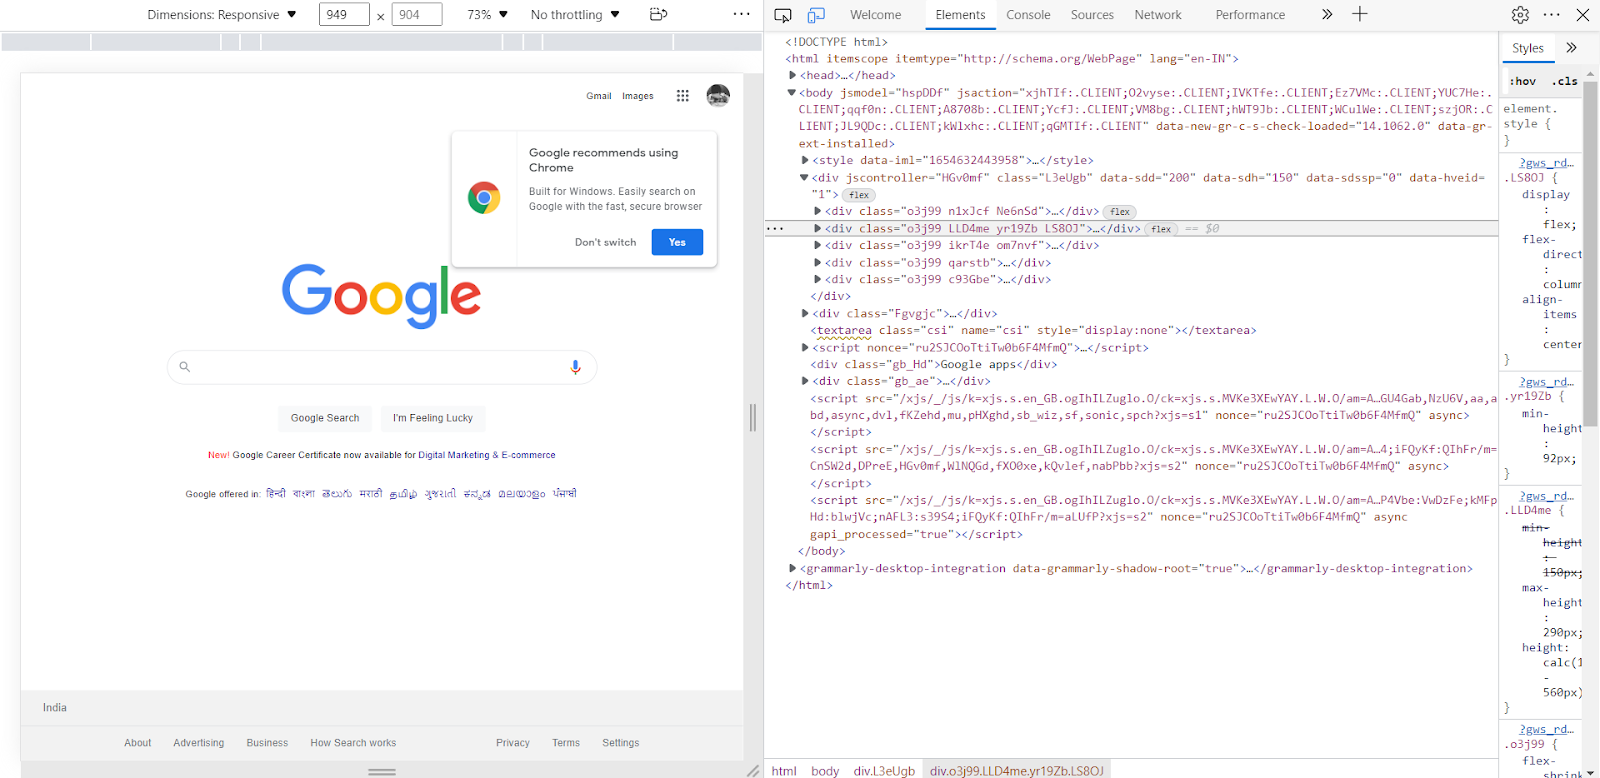
The part you see is the code under the “Elements” tab. While this code itself is a large entity to analyze, you might notice a few of the other tabs. So, in general, the meaning of these tabs is as follows:
- Elements: The base HTML code of the web page.
- Console: The developer console for log purposes.
- Sources: Describes all the files received from the server for the web page.
- Network: Describes the network-related parameters.
All these features come inside Chrome Dev Tools (which will be our pseudo-name to Google Chrome’s web inspector from here on), and we will try to work on it with a demo later in the post.
How to Use Chrome Dev Tools (Google Chrome Web Inspector)?
The use of chrome dev tools is multi-directional, and discussing their relevance at this point would not make sense until we know how to open it in our browser. There are two methods to open the dev tools if you are on a desktop:
- Through installing Chrome locally.
- Through online methods.
How to Inspect Element in Chrome?
Inspecting Elements in Chrome through Installation
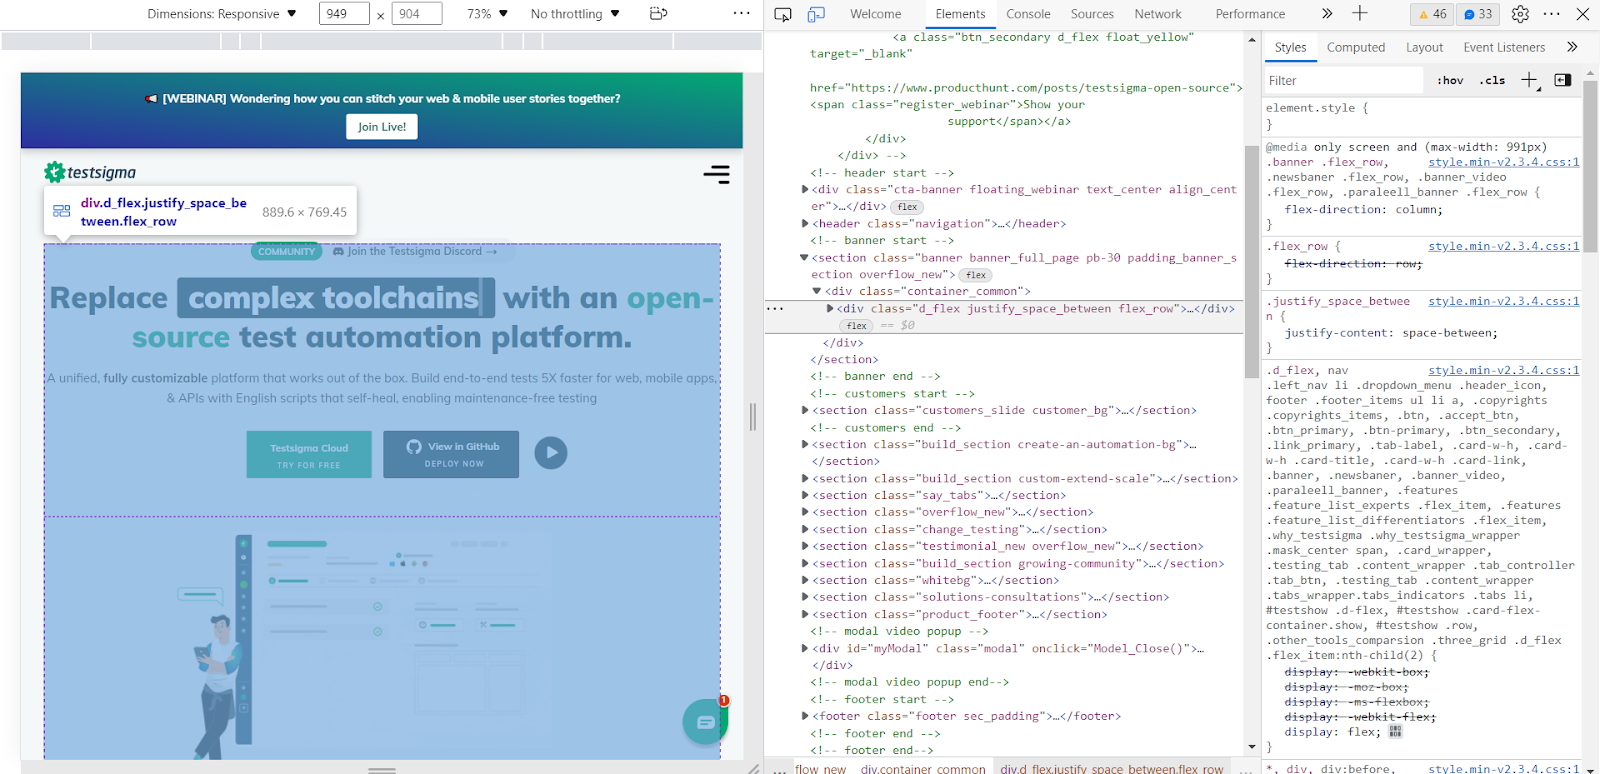
The first method to open chrome dev tools is by directly installing Google Chrome on your local system. Then, press right-click and select “Inspect” from the options.
This will open the tool panel. Alternatively, you can also press the shortcut key Ctrl + Shift + C on Windows OS or Command + Shift + C on a Mac OS.
When to Use the Method Inspect Element on Chrome through Installation?
Installing an application, running your website, and inspecting elements is an easier process when it is limited to a single or a couple of browser versions. If you are thinking of publishing a website that will serve millions of users, you need to be ready for the version people would be using which has a vast range. Installing each of them and testing manually for each version would be next to impossible.
How to Use Chrome Inspect Element with Testsigma ?
Another method that can be used to inspect elements on Google Chrome is opening the browser on an online platform. For demonstration purposes, we will be using Testsigma for the same.
Testsigma is an open-source test automation platform that hosts more than 3000+ browsers on its infrastructure. The platform uses real devices to accomplish the testing tasks and can be used for cross-browser testing, mobile app testing, automation testing, and much more. Leveraging the popularity of the English language rather than any programming language, Testsigma enables you to write test cases in English that are then converted to computer-understandable language by the platform. So, you don’t need to be a programming expert to test any application.
With Testsigma recorder you can actually individually inspect the attributes of each element without having to right click and browse. Here’s how it works:
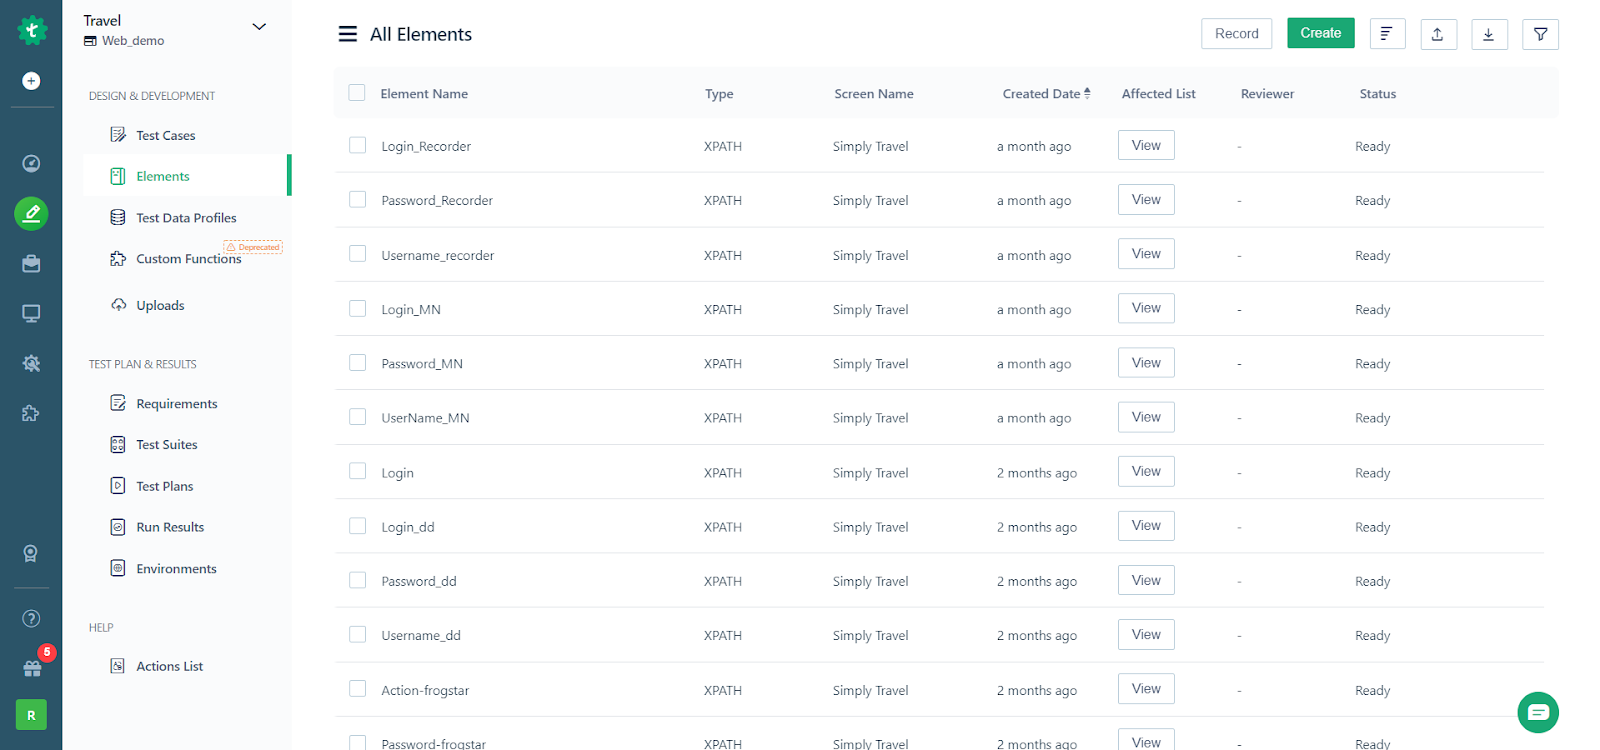
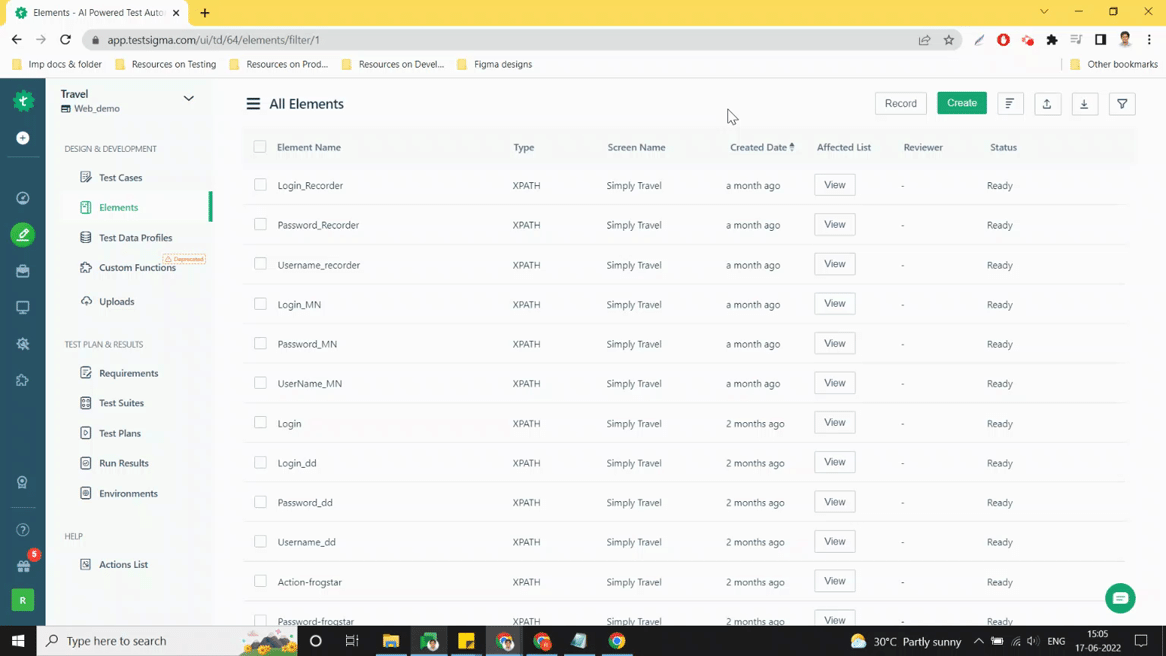
Once you’ve created your account in testsigma, navigate to the ‘Elements’ tab in your panel.
ScreenshotNext in this screen click on ‘record’ button and you’ll be able to view the following window popup. In the URL type the web page you want inspect elements in.
Screenshot(s)Next hover over and click on any specific element you want to inspect. When you click on the right hand side you;ll notice the element automatically being captured.
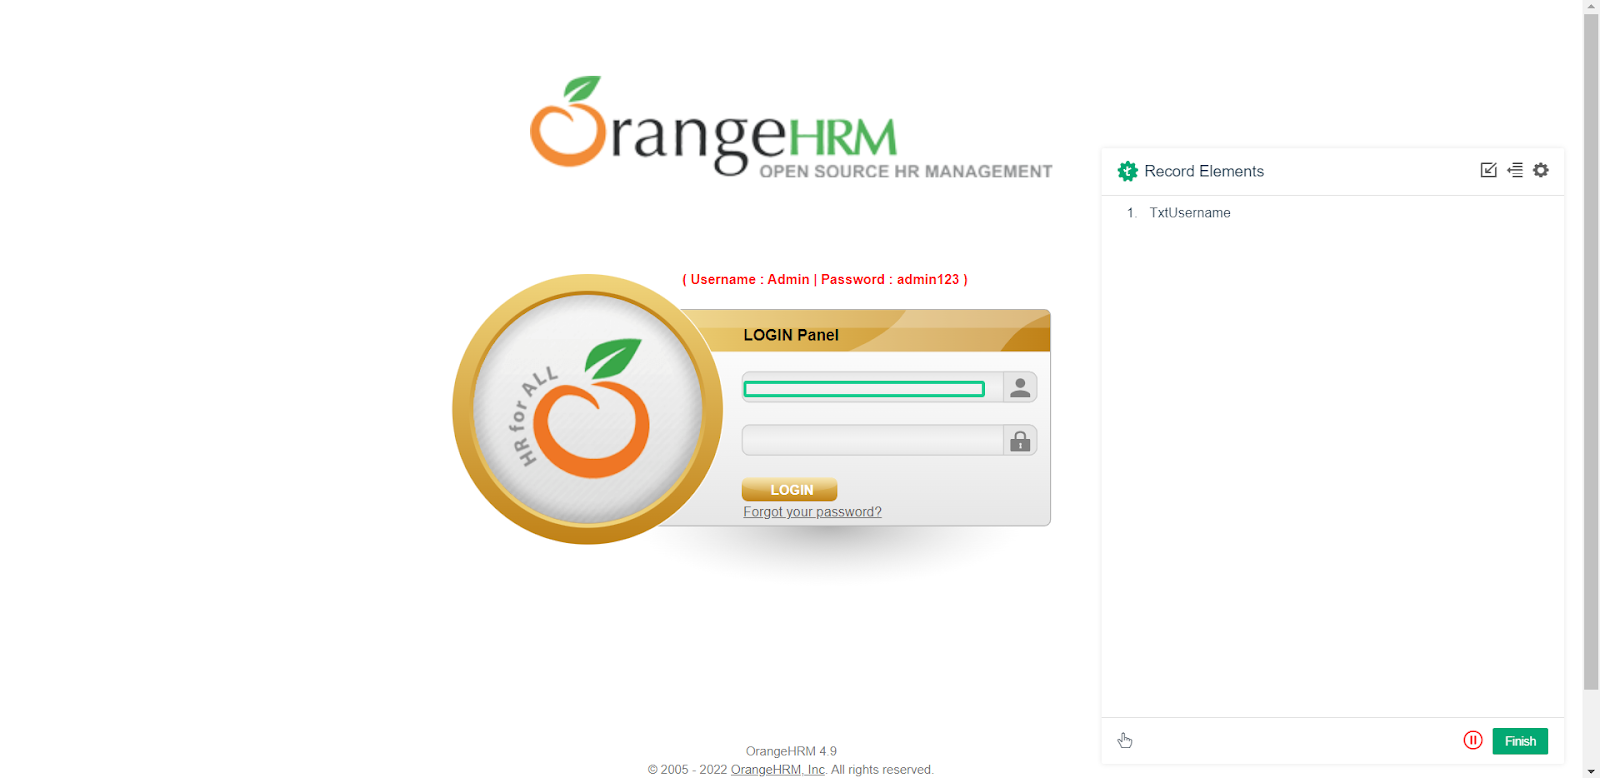
On the left you have a default name for the element. To see its details click on the edit button. Here you’l be able to switch between different attributes like ID, name and xpath and understand each locator value.
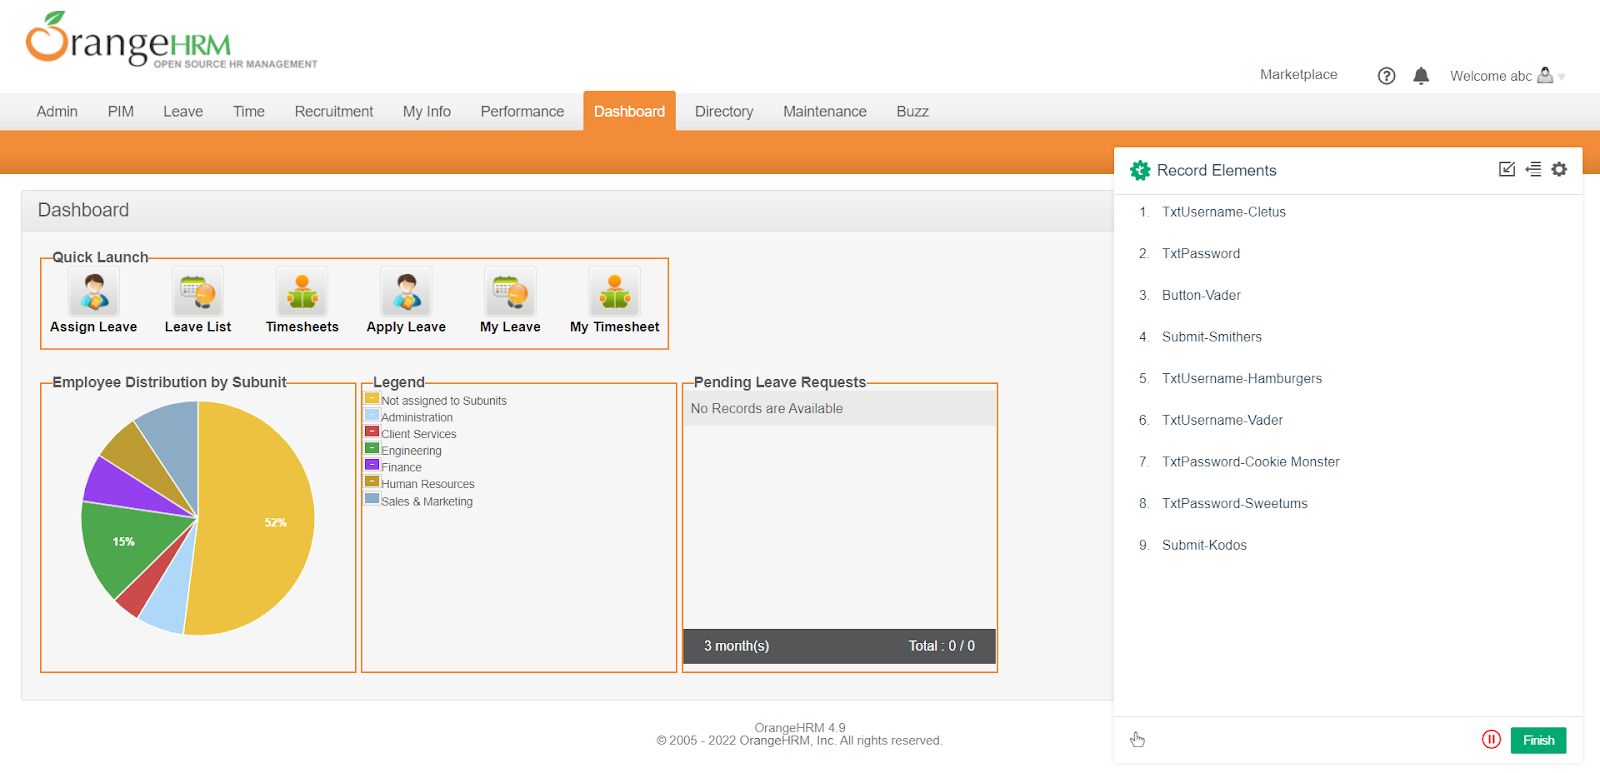
After capturing all your elements, you can go back to the ‘Elements’ screen and inspect the elements in detail.
To learn more about the Testsigma recorder you can check out our tutorial here
When to Use This Method – Inspecting Elements in Chrome through Online Platform?
The online platform method is a great choice when you need to inspect elements on various browser versions of Google Chrome. For example, if you have some version-specific rendering on the page and wish to verify the same, you need an online platform. In such scenarios, if you choose the offline method, you would have to install each version of the Google Chrome version in your local system and repeat the process. Online platforms save your local resources and the overheads included in the process. They are also very fast and help you save precious time that could be invested in performing actual work.
Inspecting Elements in a Mobile Chrome Browser
Apart from the desktop versions of your web application, you may also want to inspect elements on the mobile operating systems. Since most internet traffic comes from mobile devices, it becomes even more important to always ensure that all the data and elements flow correctly on the mobile devices.
How to Inspect Element in Mobile?
To achieve inspecting elements on a mobile chrome browser, we have the following options:
Chrome for Android
Google gives an option to inspect elements on their mobile browser using their desktop browser conveniently. Following these easy steps, you can open the inspect element panel on your desktop:
- Connect your target Android device with the PC.
- Enter the following in the address bar of Google Chrome on your PC: chrome://inspect/#devices
- Check Discover USB devices if not done already.
- The panel will then list down the devices connected via USB.
- Once the device is connected, whatever URL you open on the connected Android device’s browser will be cast on the desktop. Here, you can inspect elements as you would do on a desktop (right-click and select inspect elements).
When to Use Chrome for Android Method?
There are several flaws with this method. Firstly, it is limited to only Android devices. Hence, you can proceed with this method if your target device is just the Chrome browsers on Android (which is very rare).
Secondly, this method asks the tester to connect each device via USB to the PC. So if you have 20 target devices, you have to repeat all the steps 20 times. This could be a time-wasting process.
Thirdly, Chrome for Android is just a casting method available for Chrome browsers on Android devices. This means that even though the web application gets opened up on the mobile browser, it is the cast to the PC. This works if you are not concerned about various timings related to page load, script load, etc. Otherwise, the numbers could be misleading.
If none of the above flaws concerns you, you can choose this method of work.
Android Native Applications
Another method to inspect elements on a Chrome browser on mobile is by installing native Android applications developed just for this process. These applications can help you edit HTML and view codes on the mobile itself. By editing the codes, you can verify the functionality on any version of the chrome browser.
When to Use Android Native Application Method?
Android applications developed for inspecting elements are not “a complete solution” to what we are looking for here. These applications are restricted in the editing part and the parameters that we wish to control while inspecting elements on a browser—for example, setting up breakpoints in Javascript to understand the flow of data in between the page render. Among all the solutions discussed in this post, this is the least recommended due to its inability to accomplish the tasks.
Using Online Platforms
Like the “online platforms” solution discussed in the desktop browser part, we can use the same concept with mobile browsers.
Demonstrating the same with Testsigma, repeat the following easy step to inspect elements on a Chrome browser on mobile:
- Sign up for free on the Testsigma platform.
- Enter a URL in the address bar.
- Select the target browser version and mobile operating system (Android or iOS).
- Launch the browser on the selected systems.
- Then, go to Right-click->inspect and then select the mobile icon located in the corner.This will enable the free resizing of the window that can help you inspect elements according to the screen size.
You may also come across platforms that can connect to your mobile device remotely through an IP connection. However, they suffer from the same flaws of connecting each device and installing various browsers on them for testing.
Why Do We Need Chrome Dev Tools?
At this point in this post, we are aware of the different methods to inspect elements on a Chrome browser irrespective of the operating system. But we are still not sure about the reasons we are doing so. Since the knowledge of inspecting elements is required to understand where to use them, this seems to be the best point to discuss various use cases in the same direction.
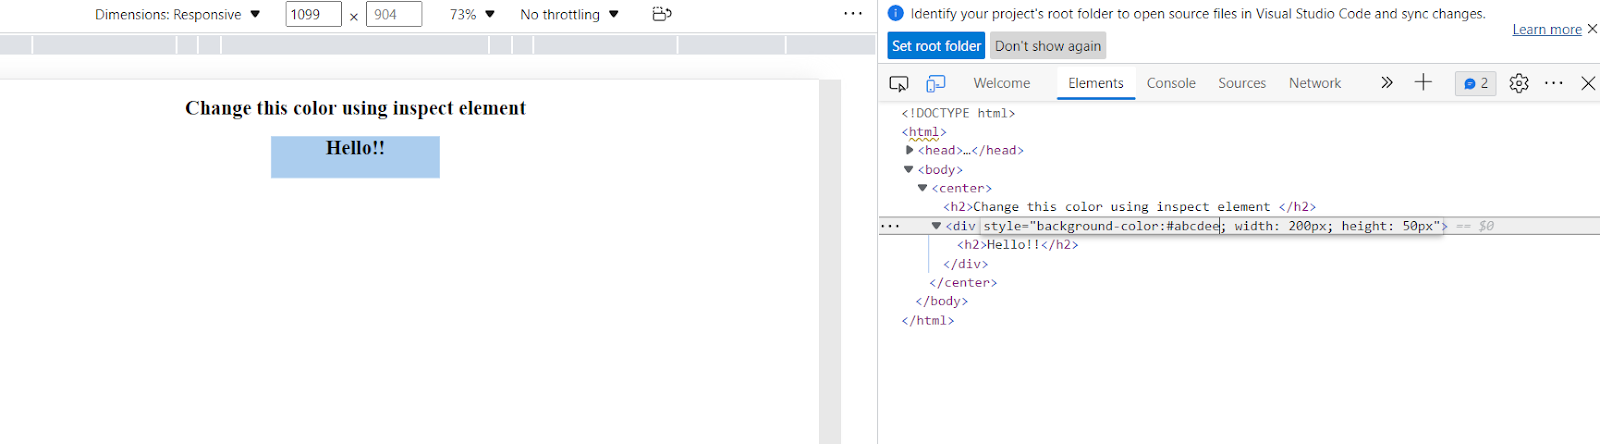
Use Case 1: Changing the Color of an Element
One of the most common use cases that I find myself regularly stuck while finding a perfect color for any element on the web page. If you are someone who is not aware of inspecting elements or the power it holds, you follow these steps:
- Write code in the editor.
- Look for color in a color picker.
- Change the code again and save.
- Check the result in a browser.
- Again repeat if not found satisfactory.
The following steps can easily be simplified using inspect elements function on a browser.
- Write code in the editor.
- Look for color in a color picker.
- Change the value instantly from the inspect element and view the result on the left.
- Change the color value finally when satisfied.
Use Case 2: Setting Breakpoints in the Javascript
Setting the breakpoints in the JavaScript code halts the code execution so that we can check the values precisely at that point in time. This becomes essential when AJAX is applied in the code. If you are unaware of this feature in “inspect elements,” you need to do console.log each time you want to check a value and then analyze it. However, this can be simplified by opening the Chrome Dev Tools.
Use Case 3: Testing for Element’s Dimensions
Finding a perfect dimension for an element on the web page sometimes becomes challenging. A small change in one element’s dimension may result in a mismanaged web page with elements overlapping or going out of viewport altogether. Again, as discussed in the color change section (use case 1), we can perform hit and trial by repeatedly changing code values, saving them, and rendering again. With inspect elements, we can edit the code or directly take advantage of its feature where hovering over the element shows its dimensions.
In addition to these, you may find a lot of use cases when you start working with HTML and inspect elements. We would love to hear them in the comment section if you do.
Conclusion
Inspecting elements is a versatile option in different browsers, including Google Chrome. The browser tries to put as many features for the developers and testers for a faster testing experience. This includes editing HTML, setting up breakpoints, and much more. In this post, we explored the methods by which we can take advantage of this feature on our browser. In conclusion, it is safe to say that the best option is to use an online method, whether you are working on a desktop browser or a mobile browser. Online platforms give you access to tens of browser versions with just a couple of clicks. You don’t need to install anything to open your website on the operating system and browser version of your choice. One such platform that we discussed in this post for reference is Testsigma. To start your journey in web test automation, starting with inspecting elements on Testsigma is the easiest way to go. I hope this blog enlightened you with the concept.
Frequently Asked Questions
Can I Edit Website From Inspect?
No, a website can’t be edited using inspect. To edit a website permanently you have to make changes to the website original source code. Using the browser inspector you can only edit a web page temporarily which will come back to normal after refreshing the website.
How Do I Open Inspect Browser?
To inspect a website you have to navigate to the website URL, and you have to right-click the mouse button, and then click on inspect menu. After clicking on inspect a new window will open on the screen by using this you can navigate to the DOM elements of the websites.
How Do I Open Inspect without Right Click?
To open the inspector without right-clicking you use the keyboard shortcut which is even faster and easier. Shortcut to open the inspector in windows, Mac, and Linux are the following:
- Mac: ⌘ + Shift + C
- Windows/Linux: F12 or Ctrl + Shift + C

