- copilot
 Introduction: Copilot
- Key Capabilities
- Launch Copilot
- Record Test Steps
- Copilot Debug Toolbar
- manage test steps
- Add Test Steps
- Edit and Update Steps
- Delete Test Steps
- Reorder Test Steps
- Bulk Actions
- FAQs on Testsigma Copilot
- troubleshooting for copilot
- Unable to Login to Testsigma Terminal?
- Unable to Download the Terminal Files?
- Unable to Extract the Terminal Files?
- Unable to Start the Terminal Due to Port Unavailability?
- Unable to Start the Agent?
- Unable to Auto-Register Your Device Using Testsigma Terminal?
- Unable to Download the Packages Required to Start the Agent?
- Unable to Update the Packages Required to Start the Agent?
- Unable to Reestablish Connection to Agent?
Copilot Debug Toolbar
The Copilot debug toolbar is a global toolbar that gives you control over a running test. It lets you pause, resume, step over, skip, or restart a run from the same session, so you can iterate on a test case without starting over from scratch.
The toolbar activates whenever execution pauses, either at a debug point you have set or when a step fails during a run. A debug point is a checkpoint you set at a specific step in a test case to pause execution there during a run. When a debug point is hit, test execution pauses so you can inspect the application state and decide how to proceed. You can add debug points through Copilot, either before you start a session or directly on steps during a run.
This article explains how to set up debug points using Copilot and the controls available in the toolbar.
Prerequisites
Before you begin, ensure that:
- You have created a test case.
- You have installed and configured the Testsigma Terminal.
- You have referred to the documentation on Launch Copilot.
Setting Up Debug Points
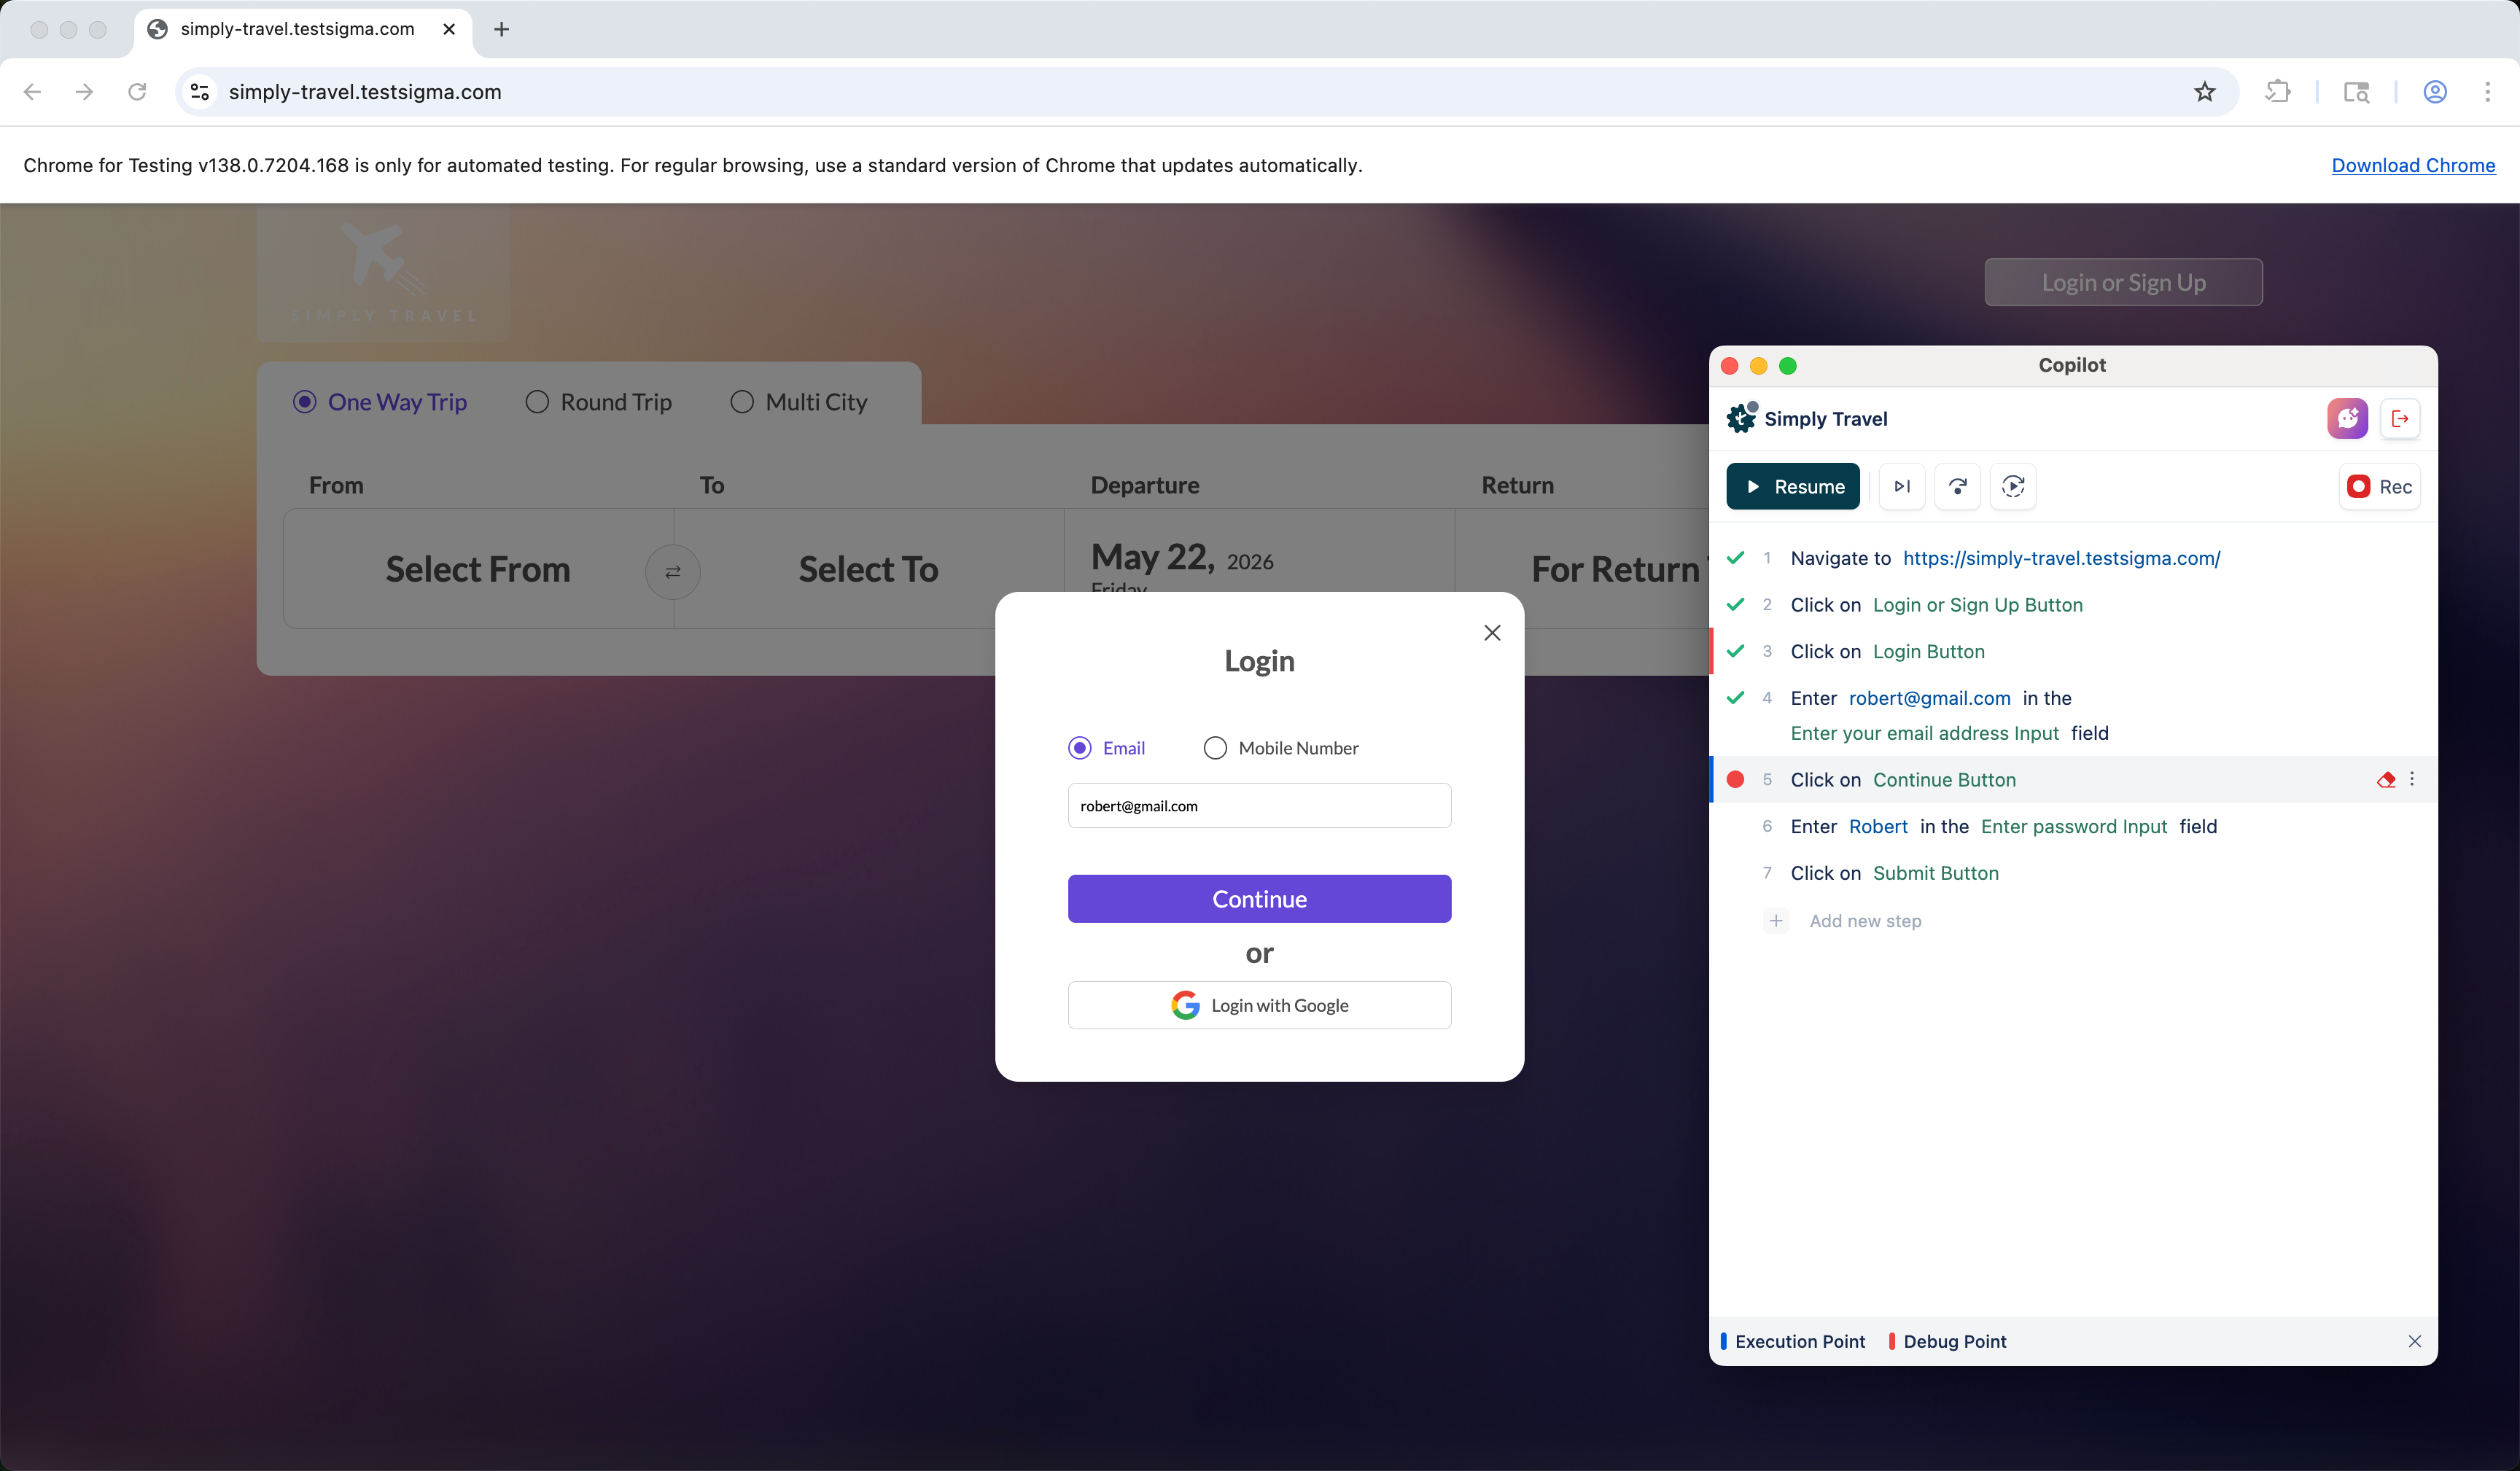
- In the Copilot dialog, hover over a test step where you want to add a debug point and click the circle to set a debug point.

- To remove the debug point, click the red dot again. The debug point is cleared, and execution continues.
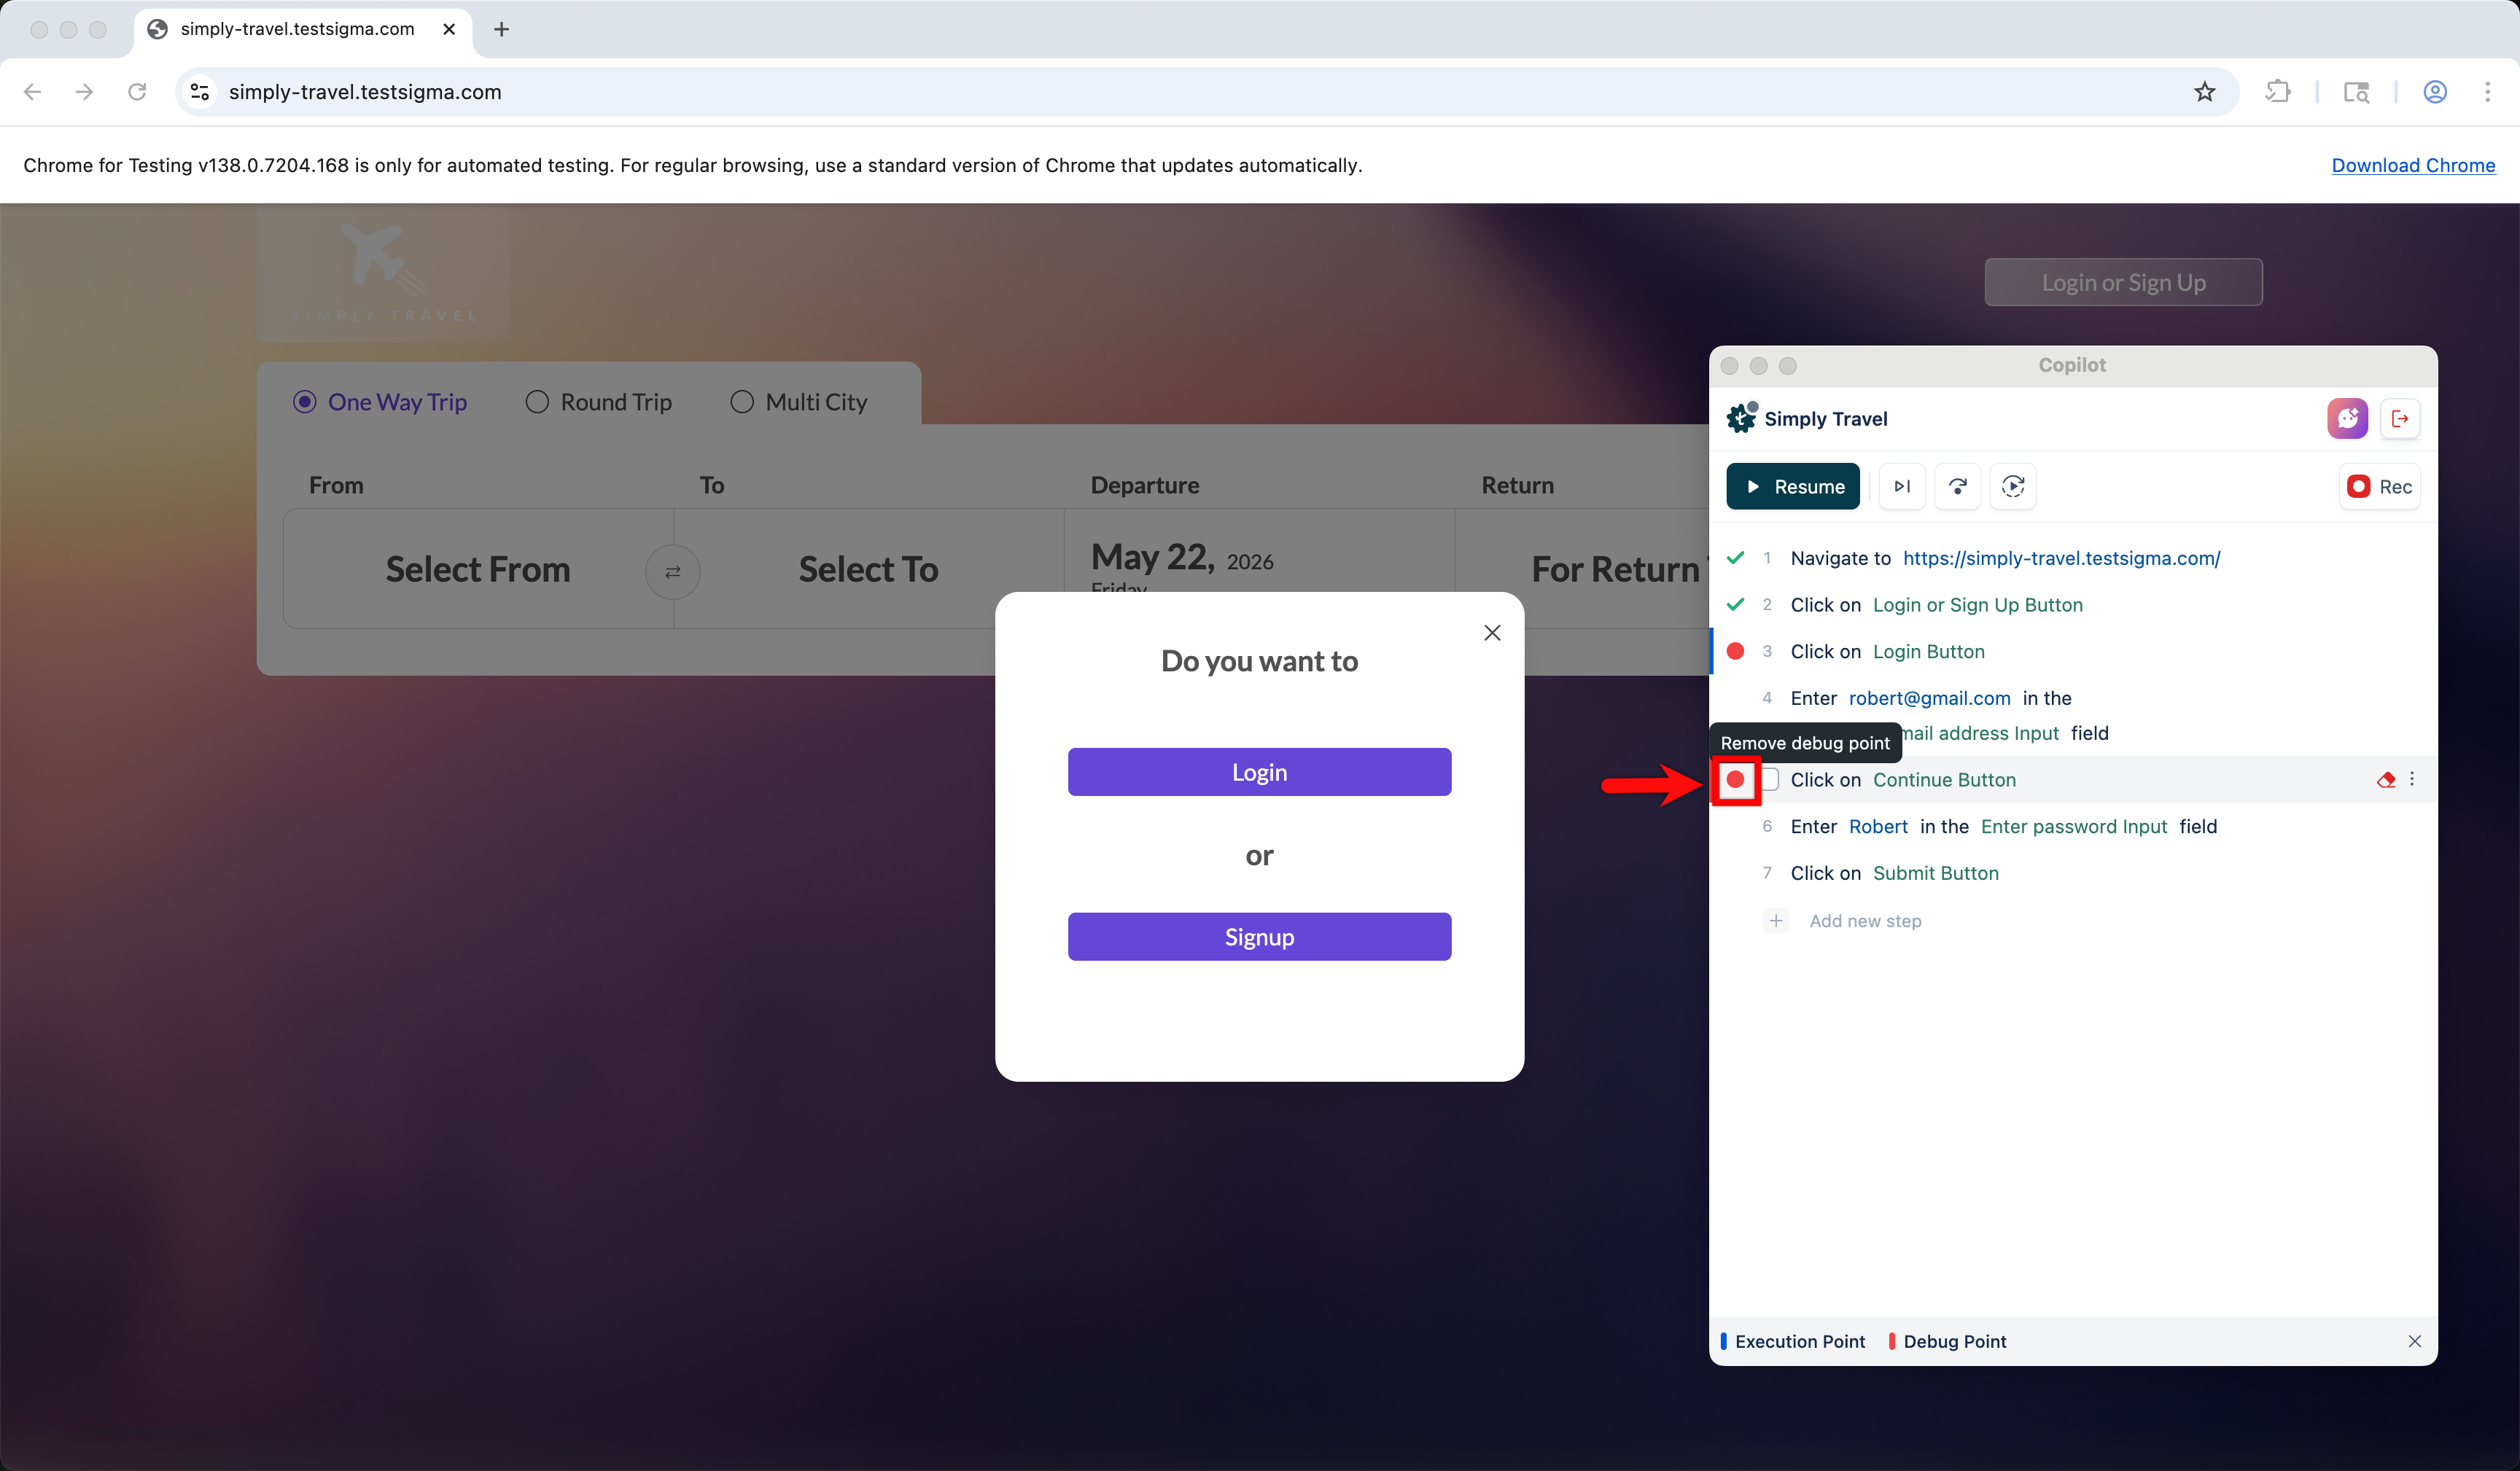
- The test case widget contains a signifier for the debug and execution point. When execution reaches this step, it pauses for the user to interact or iterate over the test case/step.
Using Execution Controls
The debug toolbar contains an exhaustive set of debugging controls available globally, and they are enabled when the test is paused at a debug point or on a failure. Using the toolbar, you can:
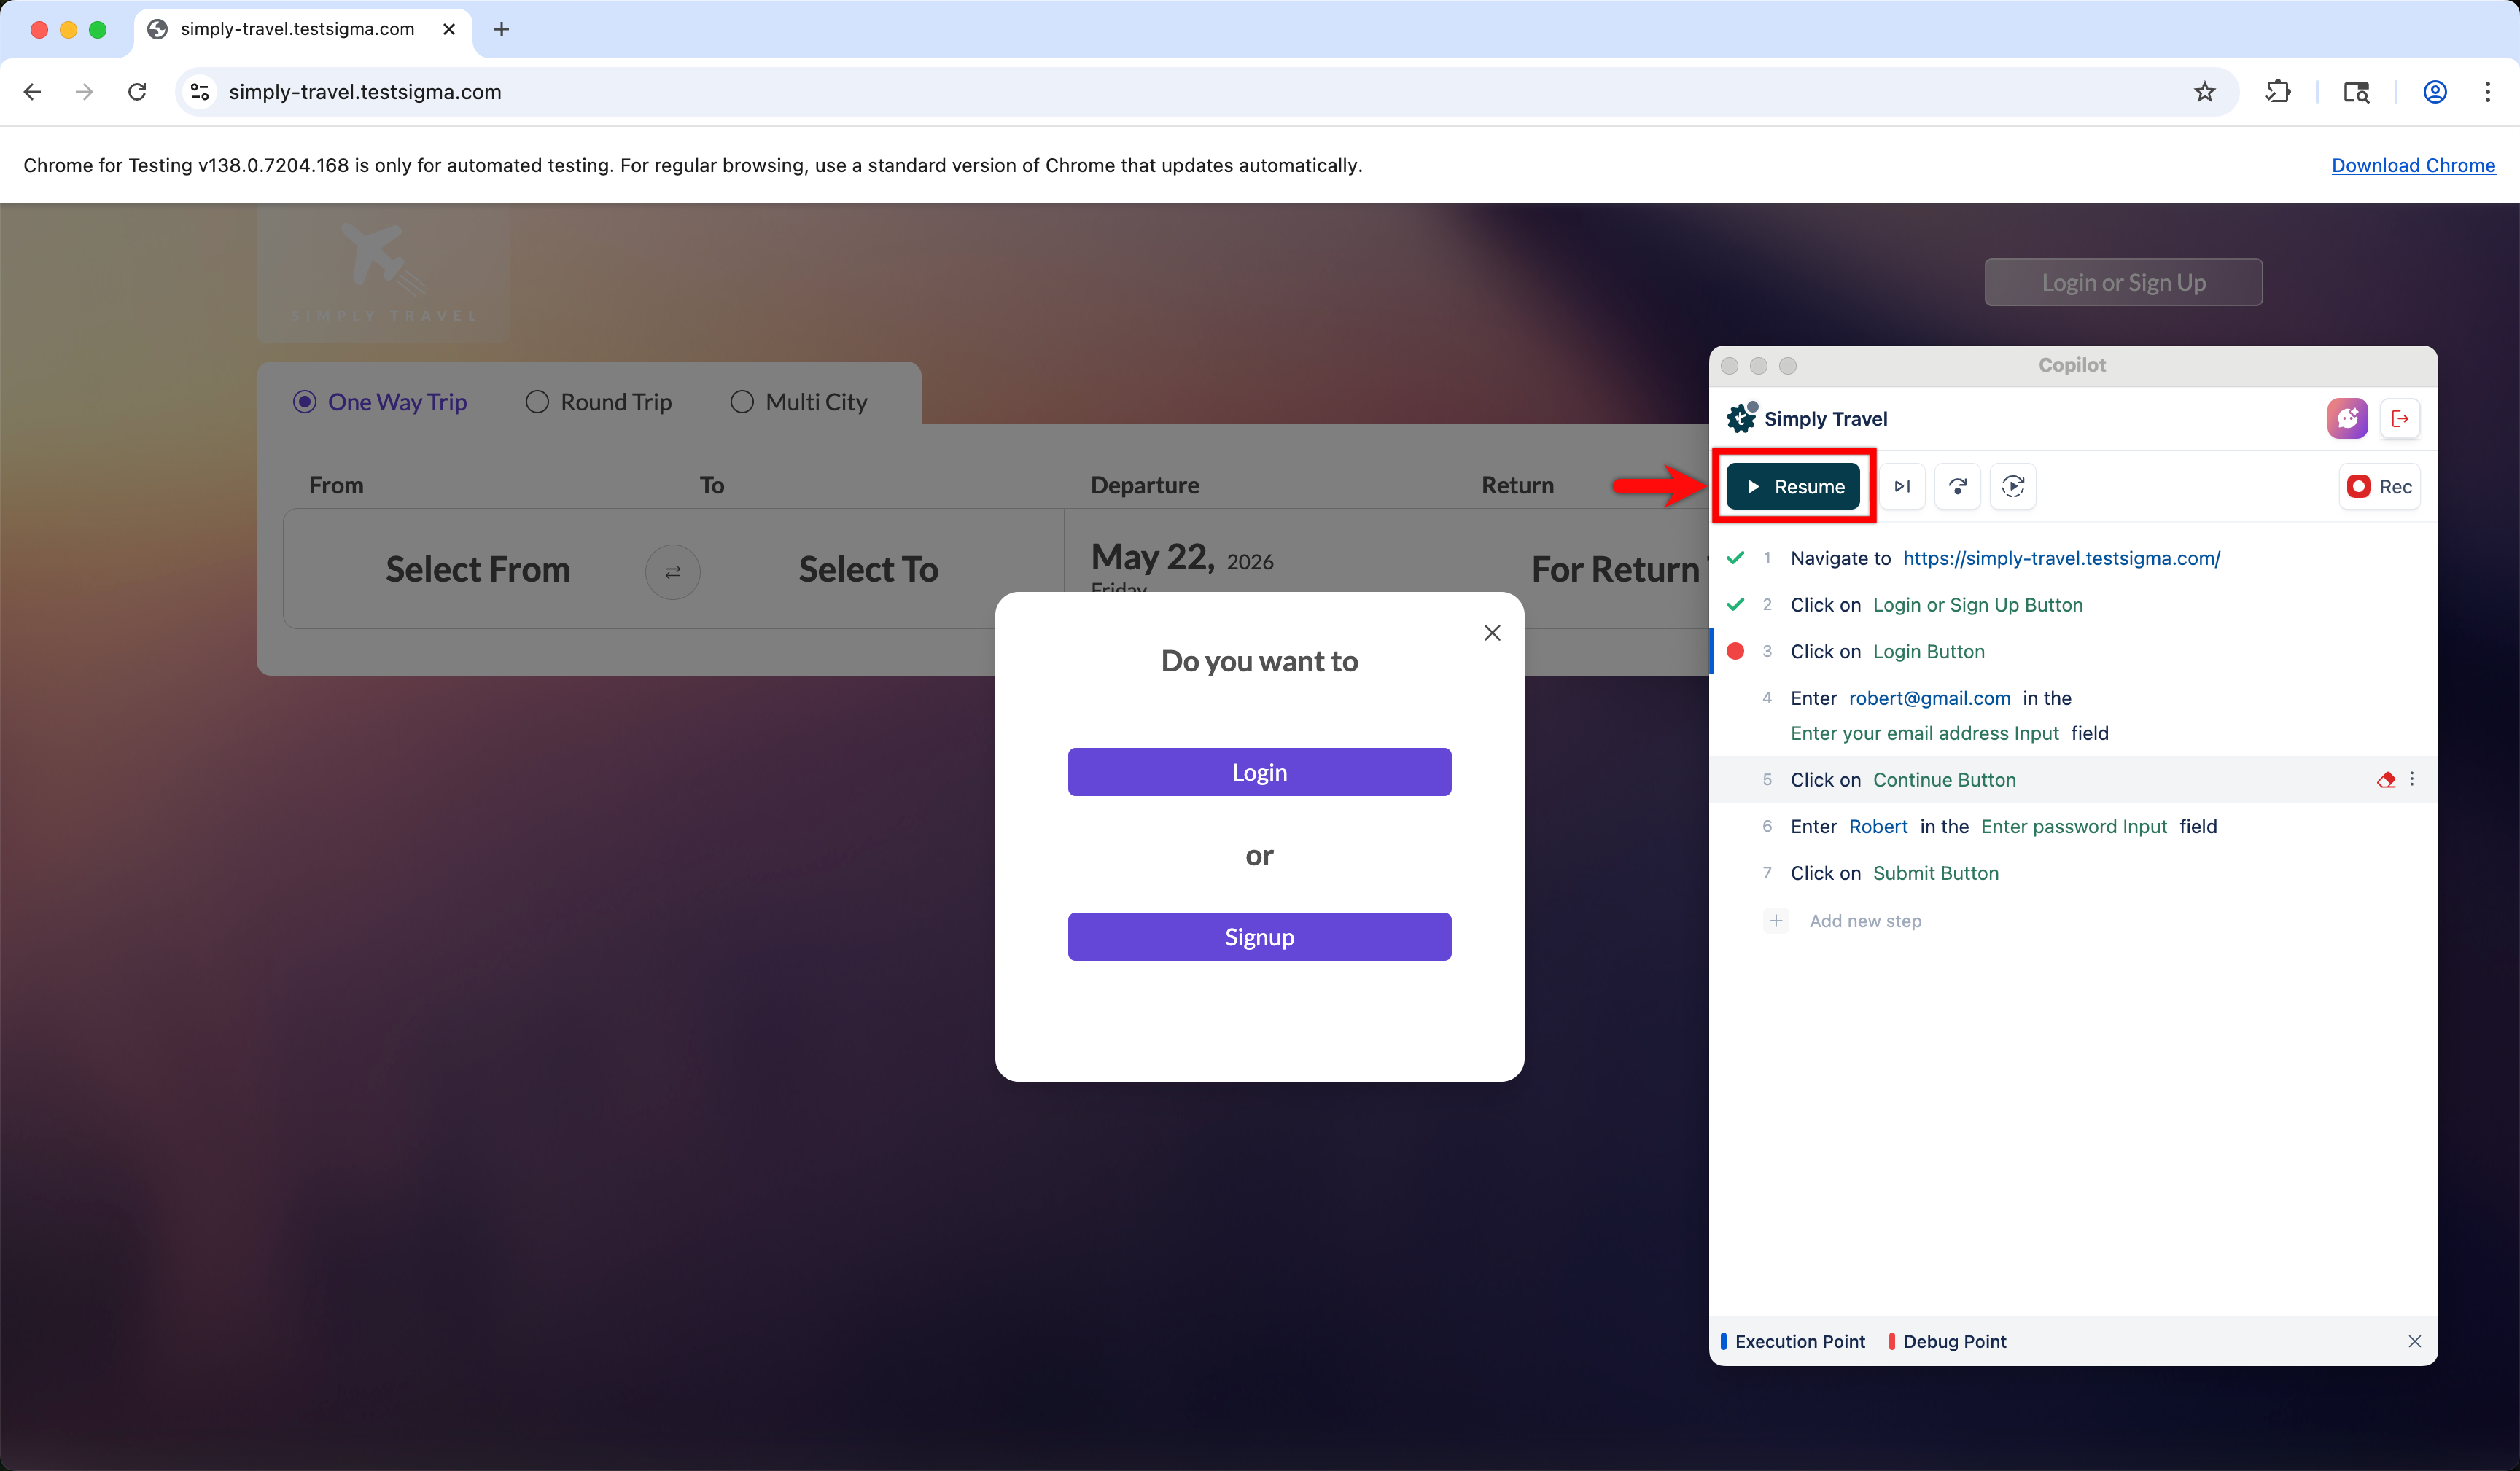
- Resume — Continues the test from the next execution step without restarting from the beginning. Use Resume when execution has paused at a debug point after you've inspected the application state and made any necessary changes to the test case. Resume moves execution forward so you can validate what you've changed.
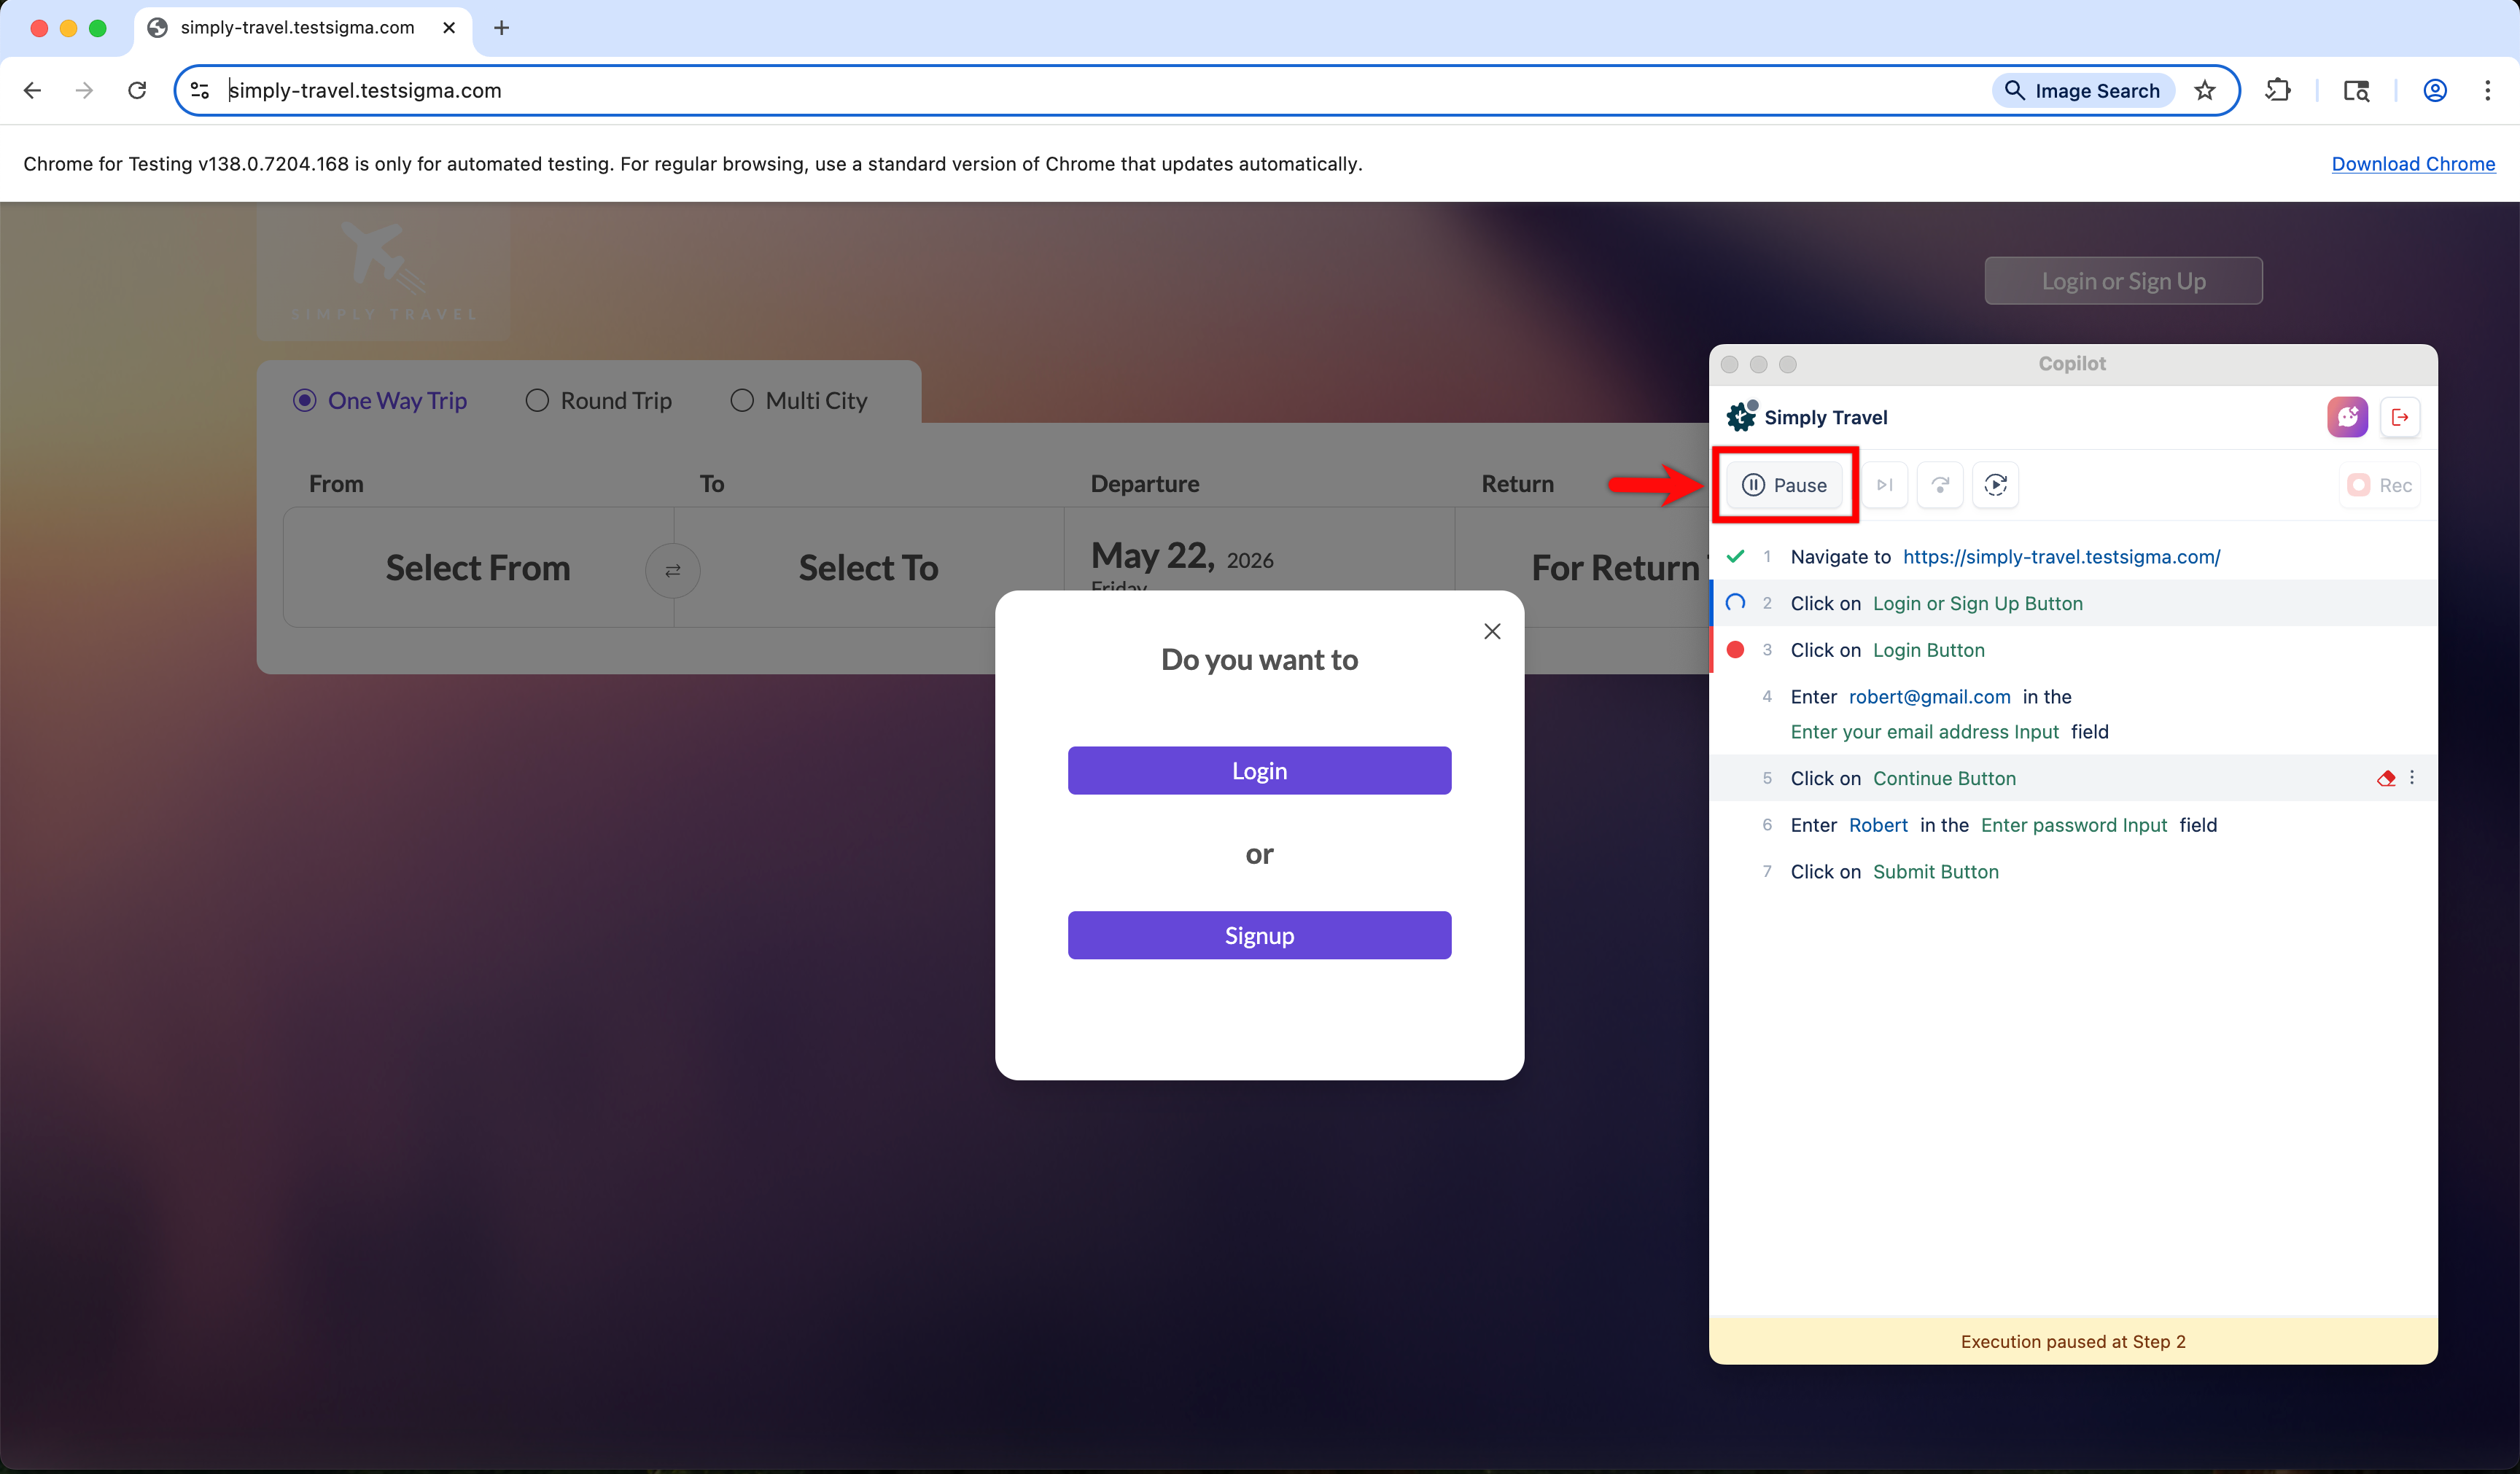
- Pause — Stops the run after the current step completes. Use Pause when you notice something unexpected during a run and need a moment to review the application state before deciding what to do next.
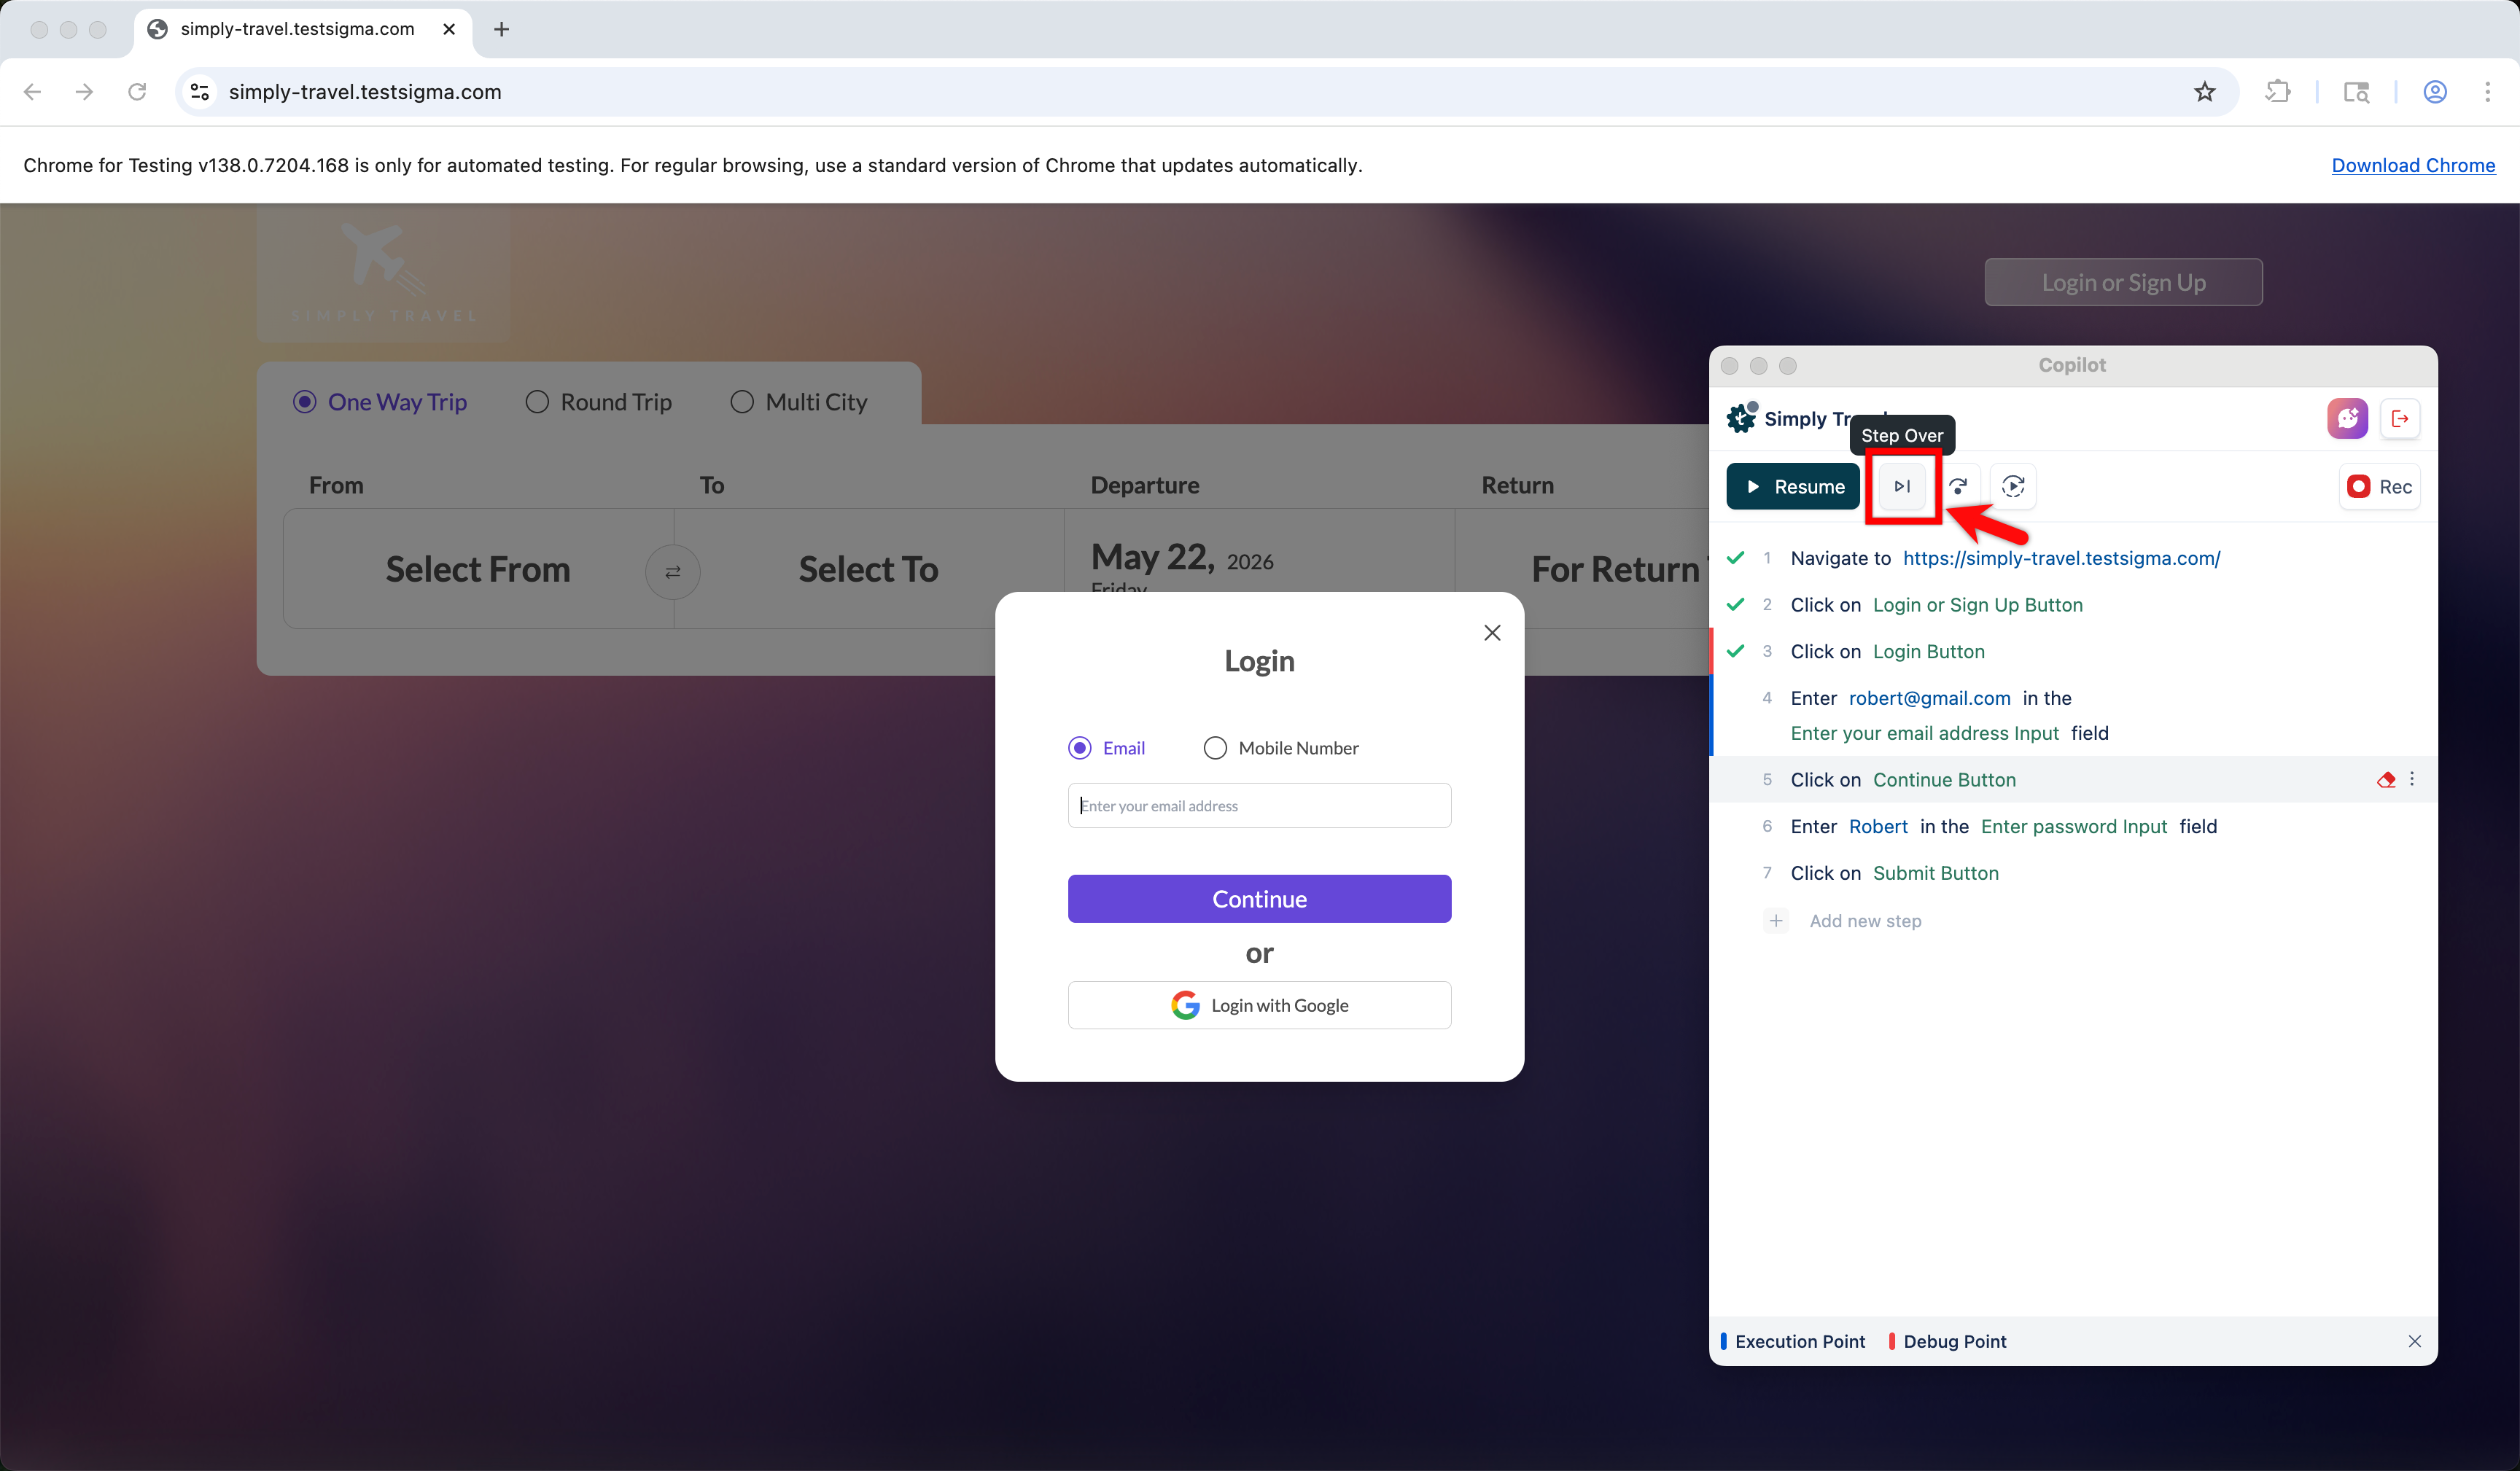
- Step Over — Runs the current step where execution is paused, then pauses again on the next step. Use Step Over when you want to move through the test one step at a time and observe how the application responds to each action.
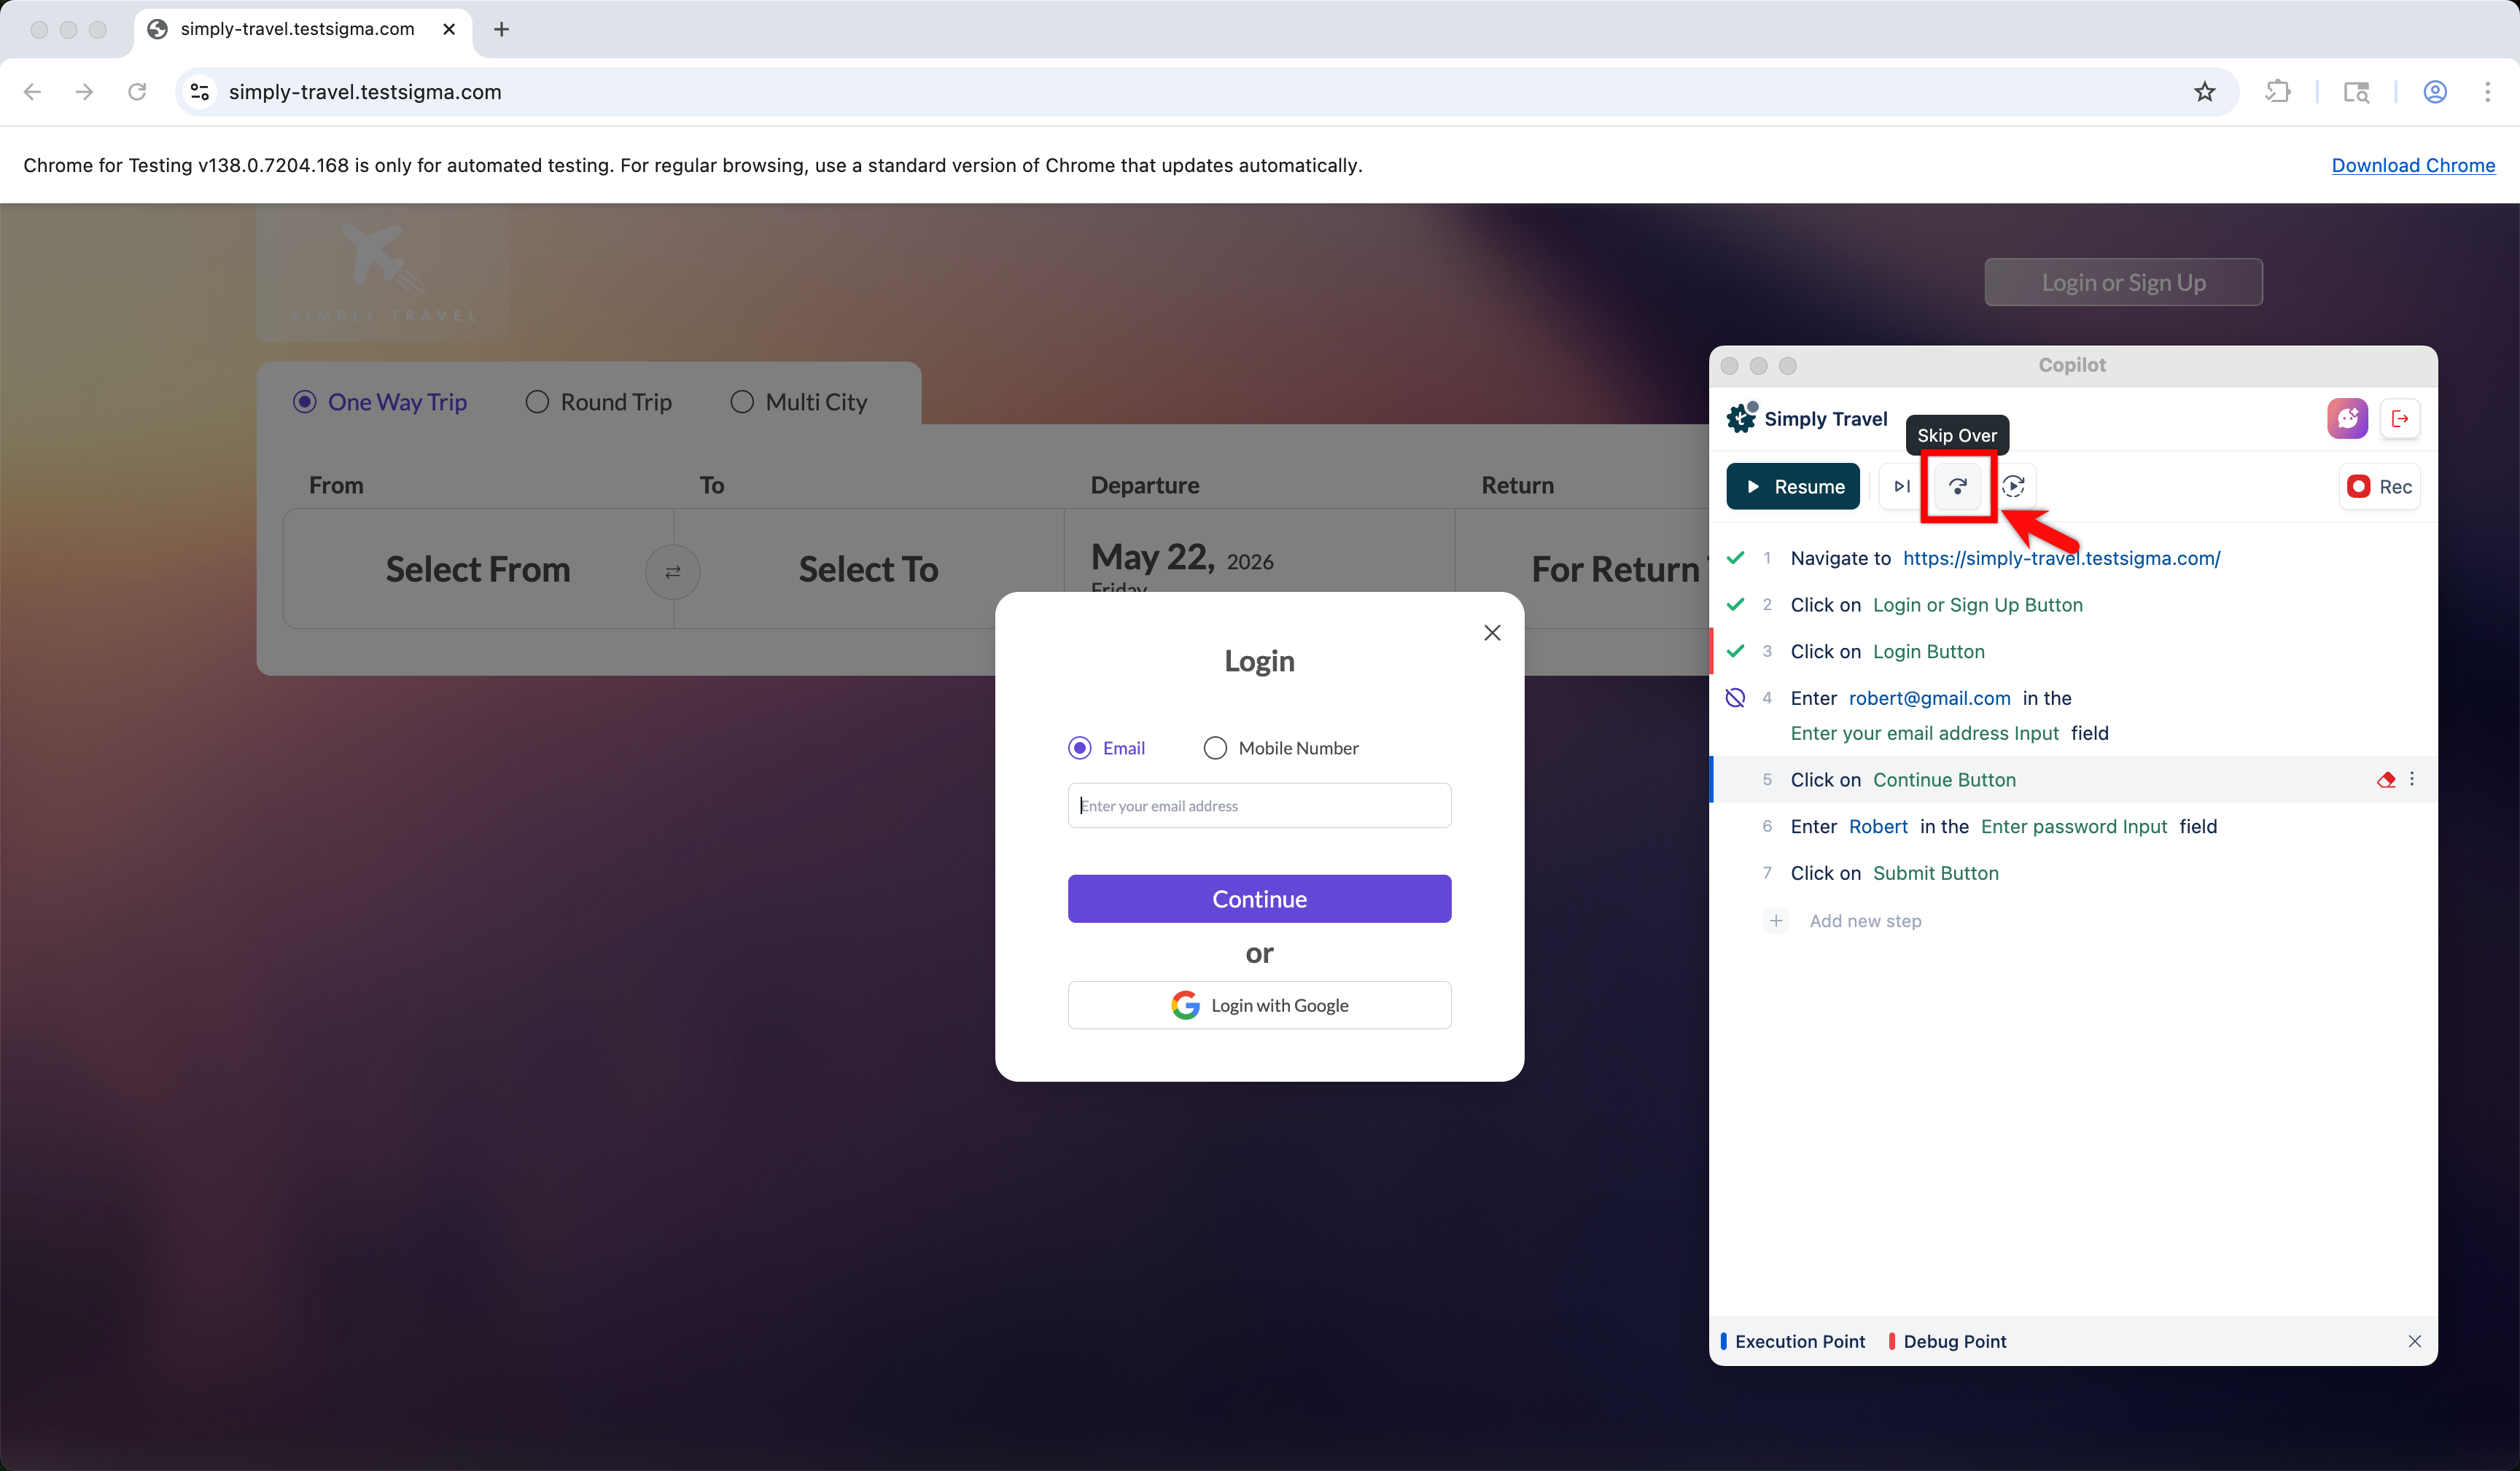
- Skip Over — Skips the current step where execution is paused and stops on the next one. Use Skip Over when a step is failing and you want the run to proceed past it, instead of fixing the step immediately or restarting the session.
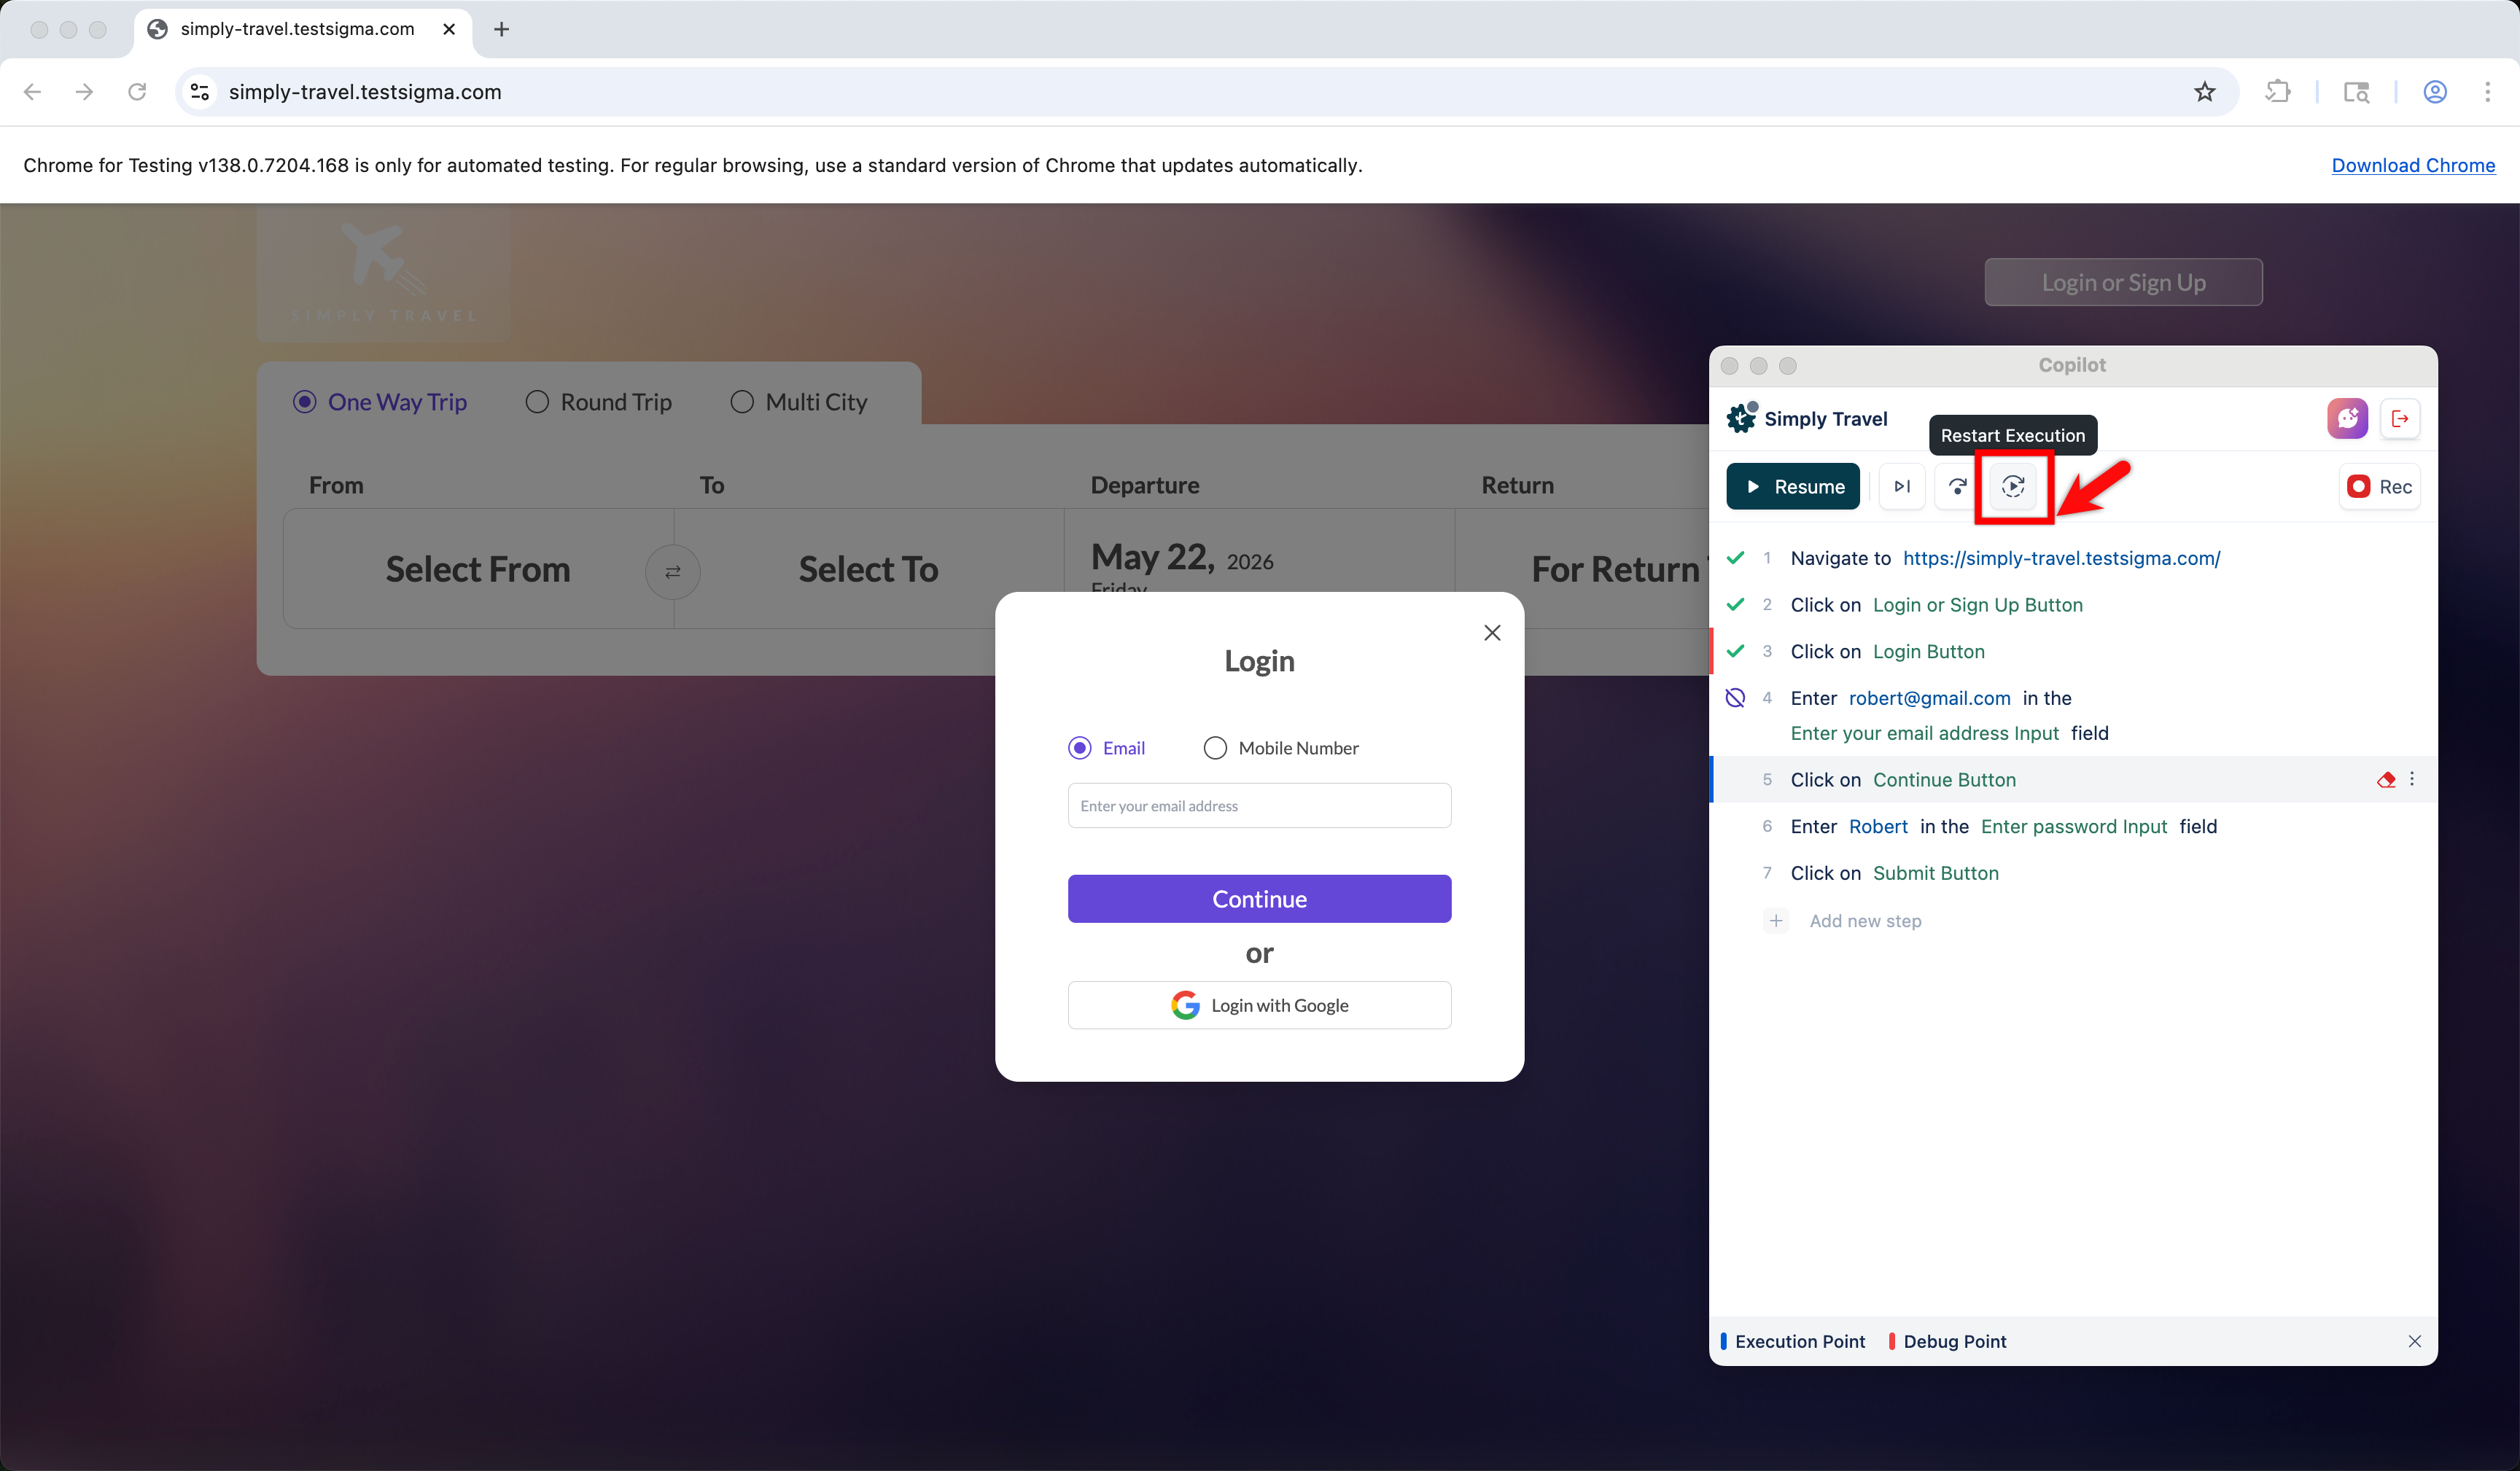
- Restart Execution — Clears the current session and starts a fresh session from the first step. Use Restart Execution after you have made larger changes to the test case and want a clean run from the beginning, rather than continuing with the state from the paused session.
Want to contribute or report missing content?