- testsigma terminal
 Introduction: Testsigma Terminal
- Installing Testsigma Terminal
- Installing Testsigma Terminal on Linux
- Installing Testsigma Terminal on Windows
- Components of Testsigma Terminal
Components of Testsigma Terminal
Testsigma Terminal consists of five core components that enable seamless test automation execution, comprehensive logging, and efficient troubleshooting capabilities.
The Terminal provides a centralized interface for running automated tests, monitoring execution activity, and managing your testing environment. Understanding each component ensures optimal utilization of the platform's capabilities.
Core Components
-
Copilot: The Copilot serves as the primary execution engine for automated tests across Web, Desktop, and Salesforce applications.
Key Features:
- Automatically downloads and configures all required dependencies during initial setup.
- Provides real-time execution status through visual indicators (green status indicates active test execution).
- Supports multiple application types within a unified interface.
-
Agentic: The Agentic component powers Atto (Agentic Copilot), an advanced automation capability available exclusively to enterprise users.
Key Features:
- Manages dedicated dependency downloads for Atto Copilot functionality.
- Operates independently from the standard Copilot component.
- Provides enhanced automation capabilities for enterprise-level testing scenarios.
-
Active Sessions: The Active Sessions component provides real-time visibility into all ongoing local test executions.
Key Features:
- Displays live execution status directly within the Terminal when a local agent is involved.
- Automatically refreshes once a test run completes or stops.
- Shows execution details such as run ID, test name, execution type, and session owner.
- Indicates agent readiness for Mobile local executions within Copilot.
- Displays API local executions under Active Sessions.
- Eliminates the need for manual dashboard refresh during local test runs.
-
Logs: The Logs component provides comprehensive debugging and monitoring capabilities through three distinct log categories:
- Terminal Logs – System-level operations and terminal activity.
- Agent Logs – Agent-specific execution data and communication records.
- Execution Logs – Detailed test run information and step-by-step execution data.
-
Settings: The Settings component enables configuration of the Terminal environment to align with system, security, and infrastructure requirements.
Key Features:
- Enable automatic package and Terminal updates.
- Configure Trust Store Type (JKS or PKCS12).
- Manage SSL validation settings.
- Configure network proxy for restricted environments.
- Customize JVM arguments and memory allocation.
-
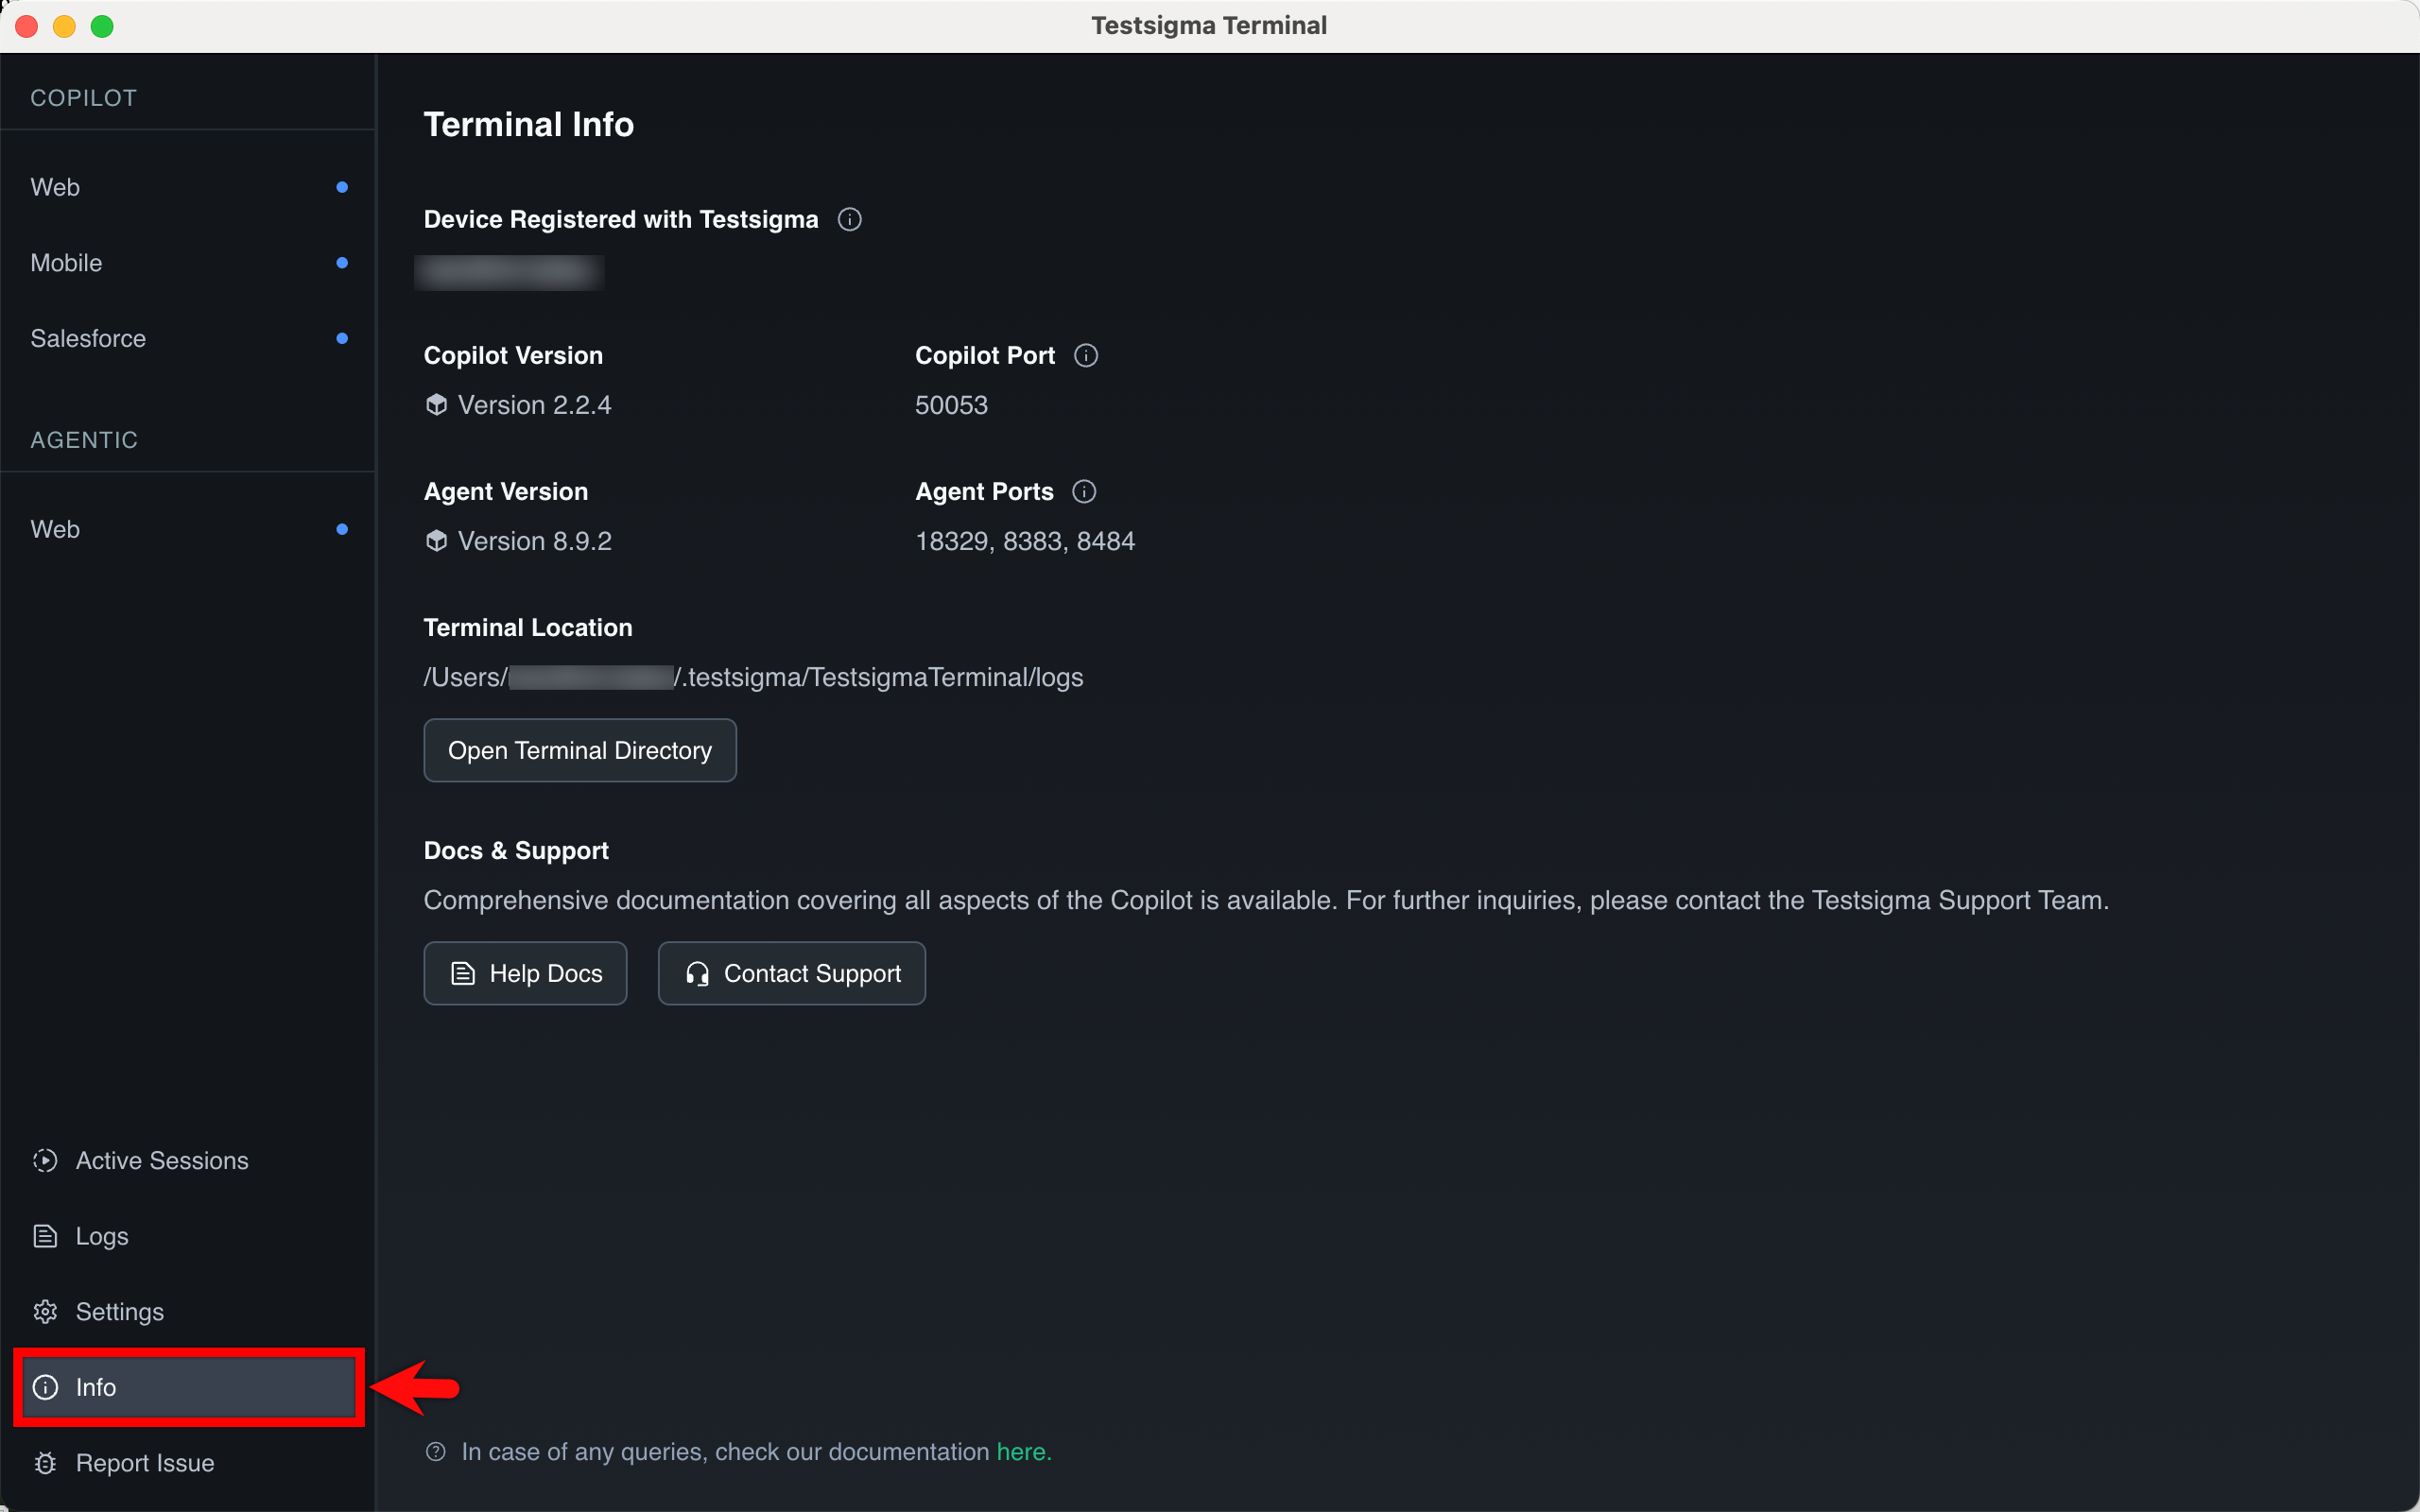
Info: The Info component displays critical system and configuration information:
- Device specifications and hardware details.
- Current version and port configuration.
- Terminal directory file path.
- Quick access to help documentation and support resources.
-
Report Issue: The Report Issue feature streamlines the support process by enabling direct issue submission from the Terminal.
Key Features:
- One-click issue reporting.
- Automatic attachment of relevant log files.
- Accelerated resolution through comprehensive diagnostic data.
This article discusses how to navigate and engage with the five essential components that drive the Testsigma Terminal environment.
Prerequisites
Before you begin, ensure that the Testsigma Terminal is installed on your device.
Navigating the Left Panel
-
On the Testsigma Terminal, review the left navigation panel, which contains two sections:
- Copilot – supports execution for web, Salesforce, and desktop applications.
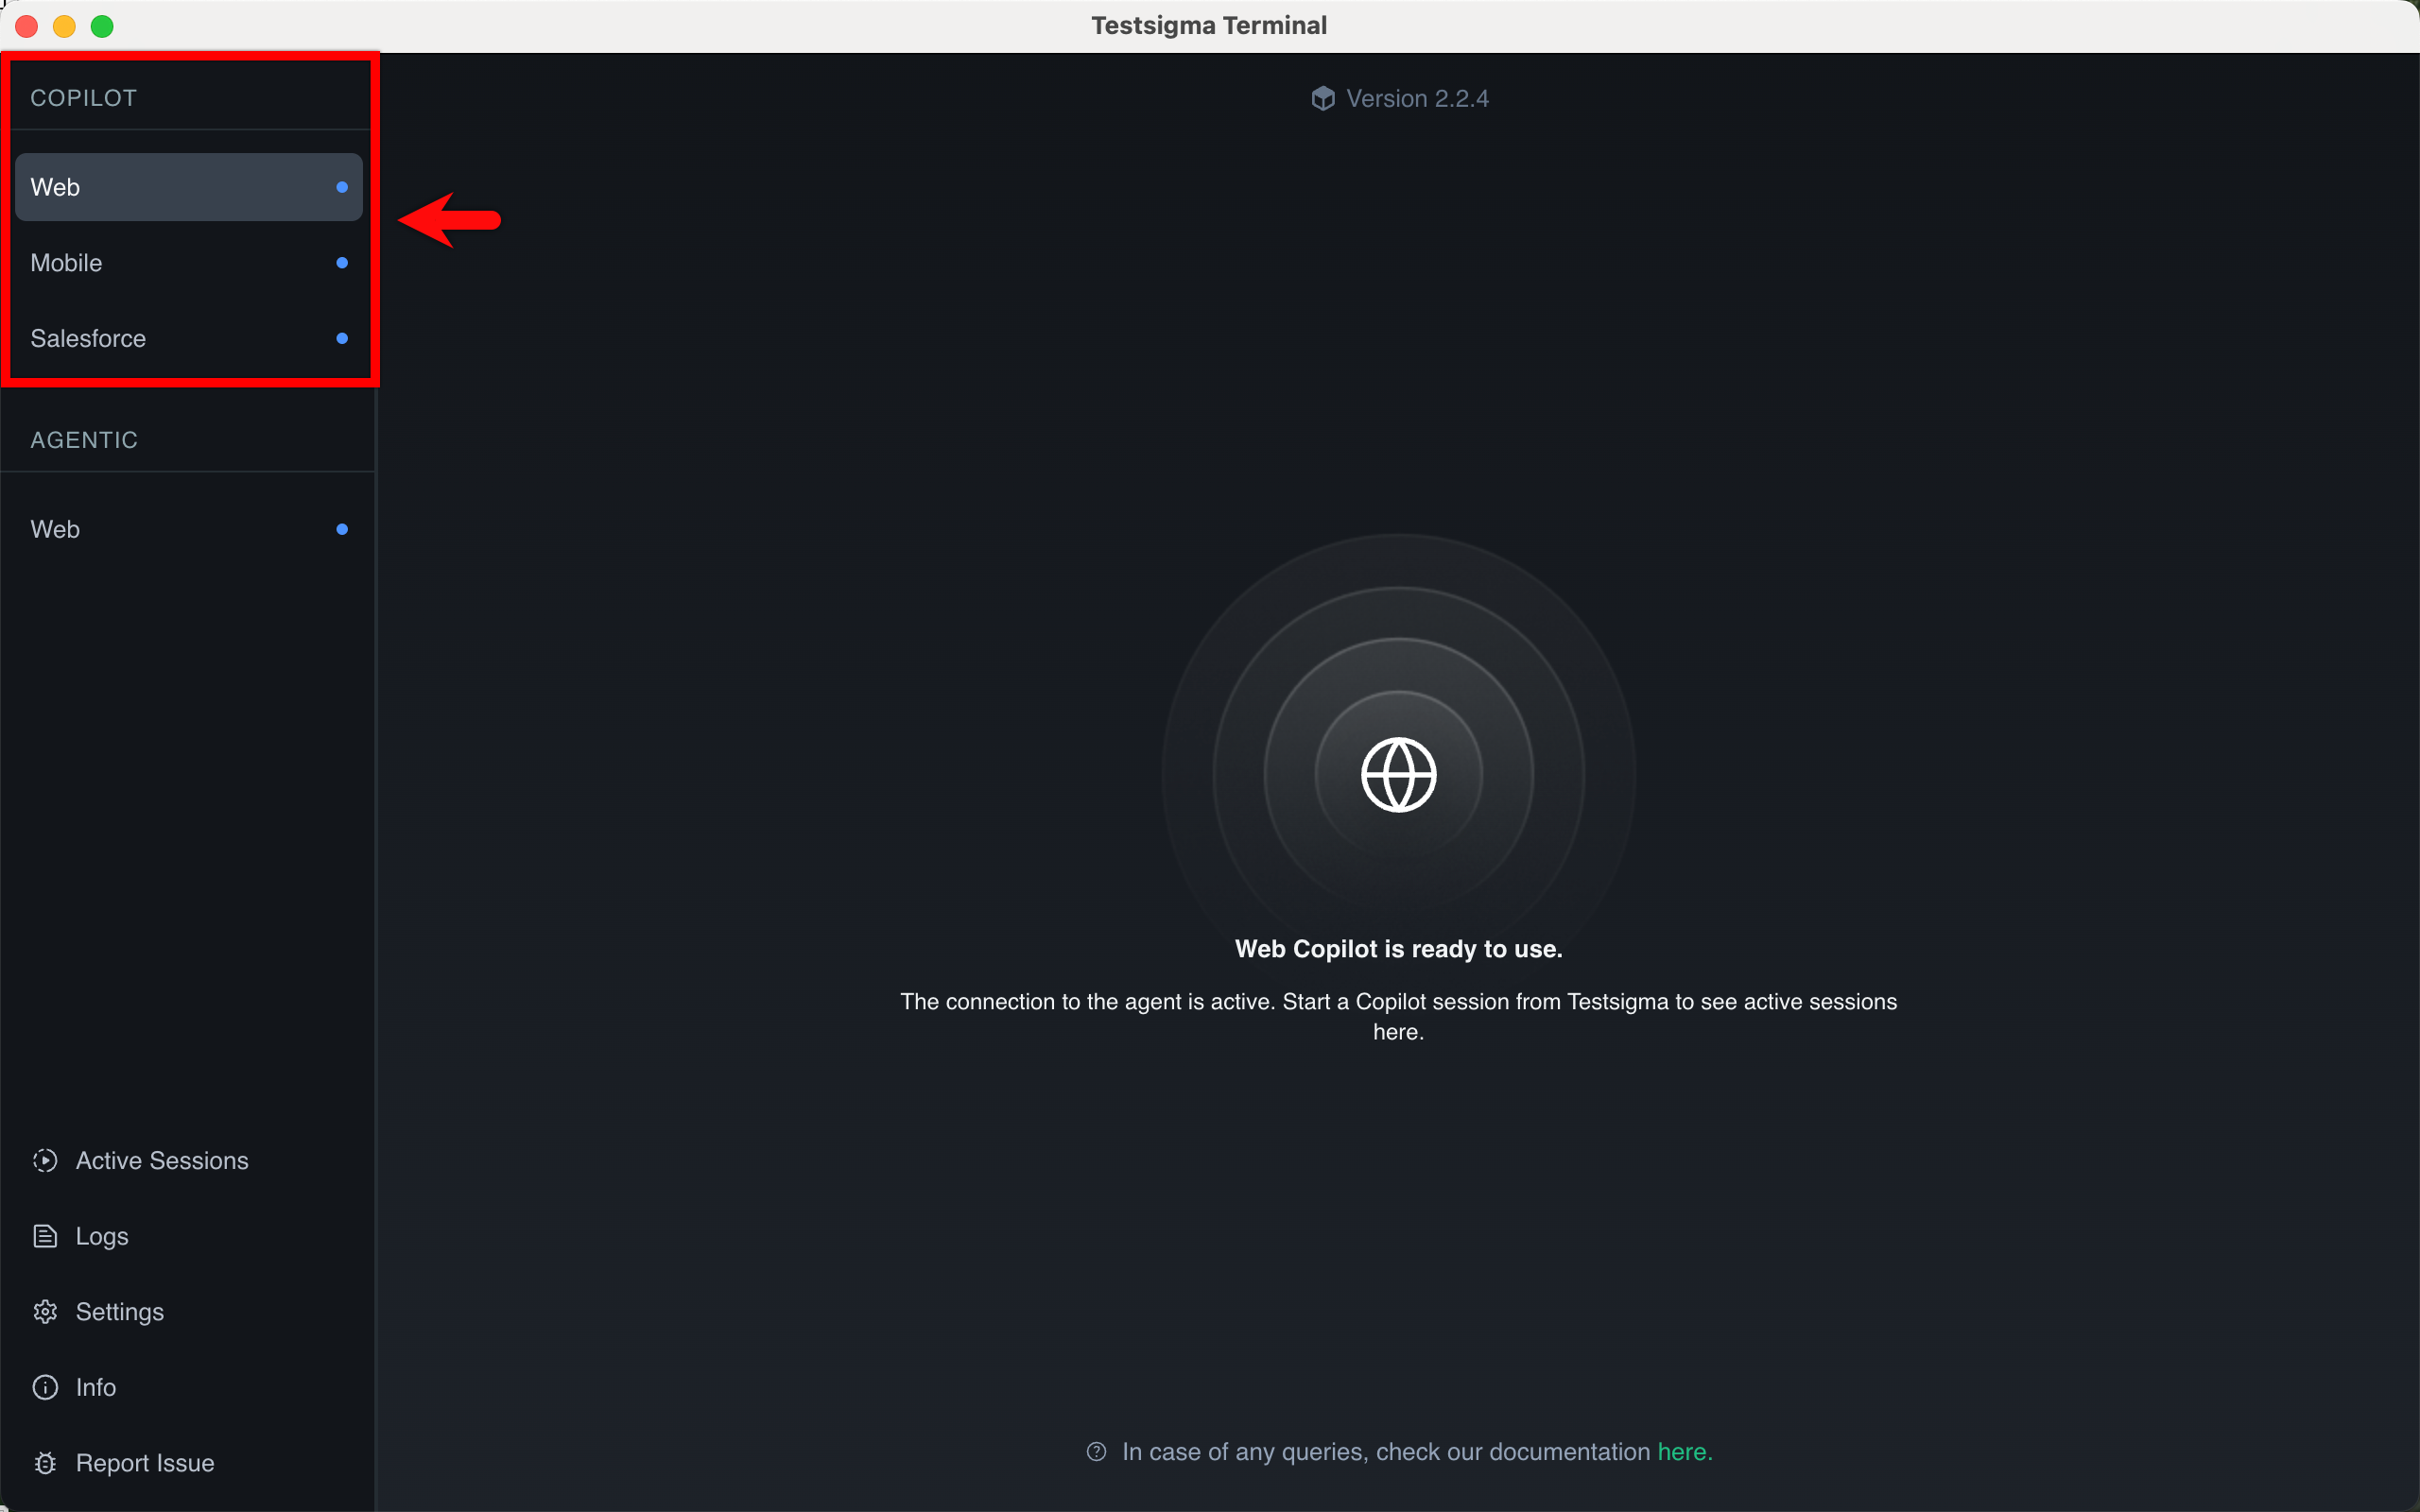
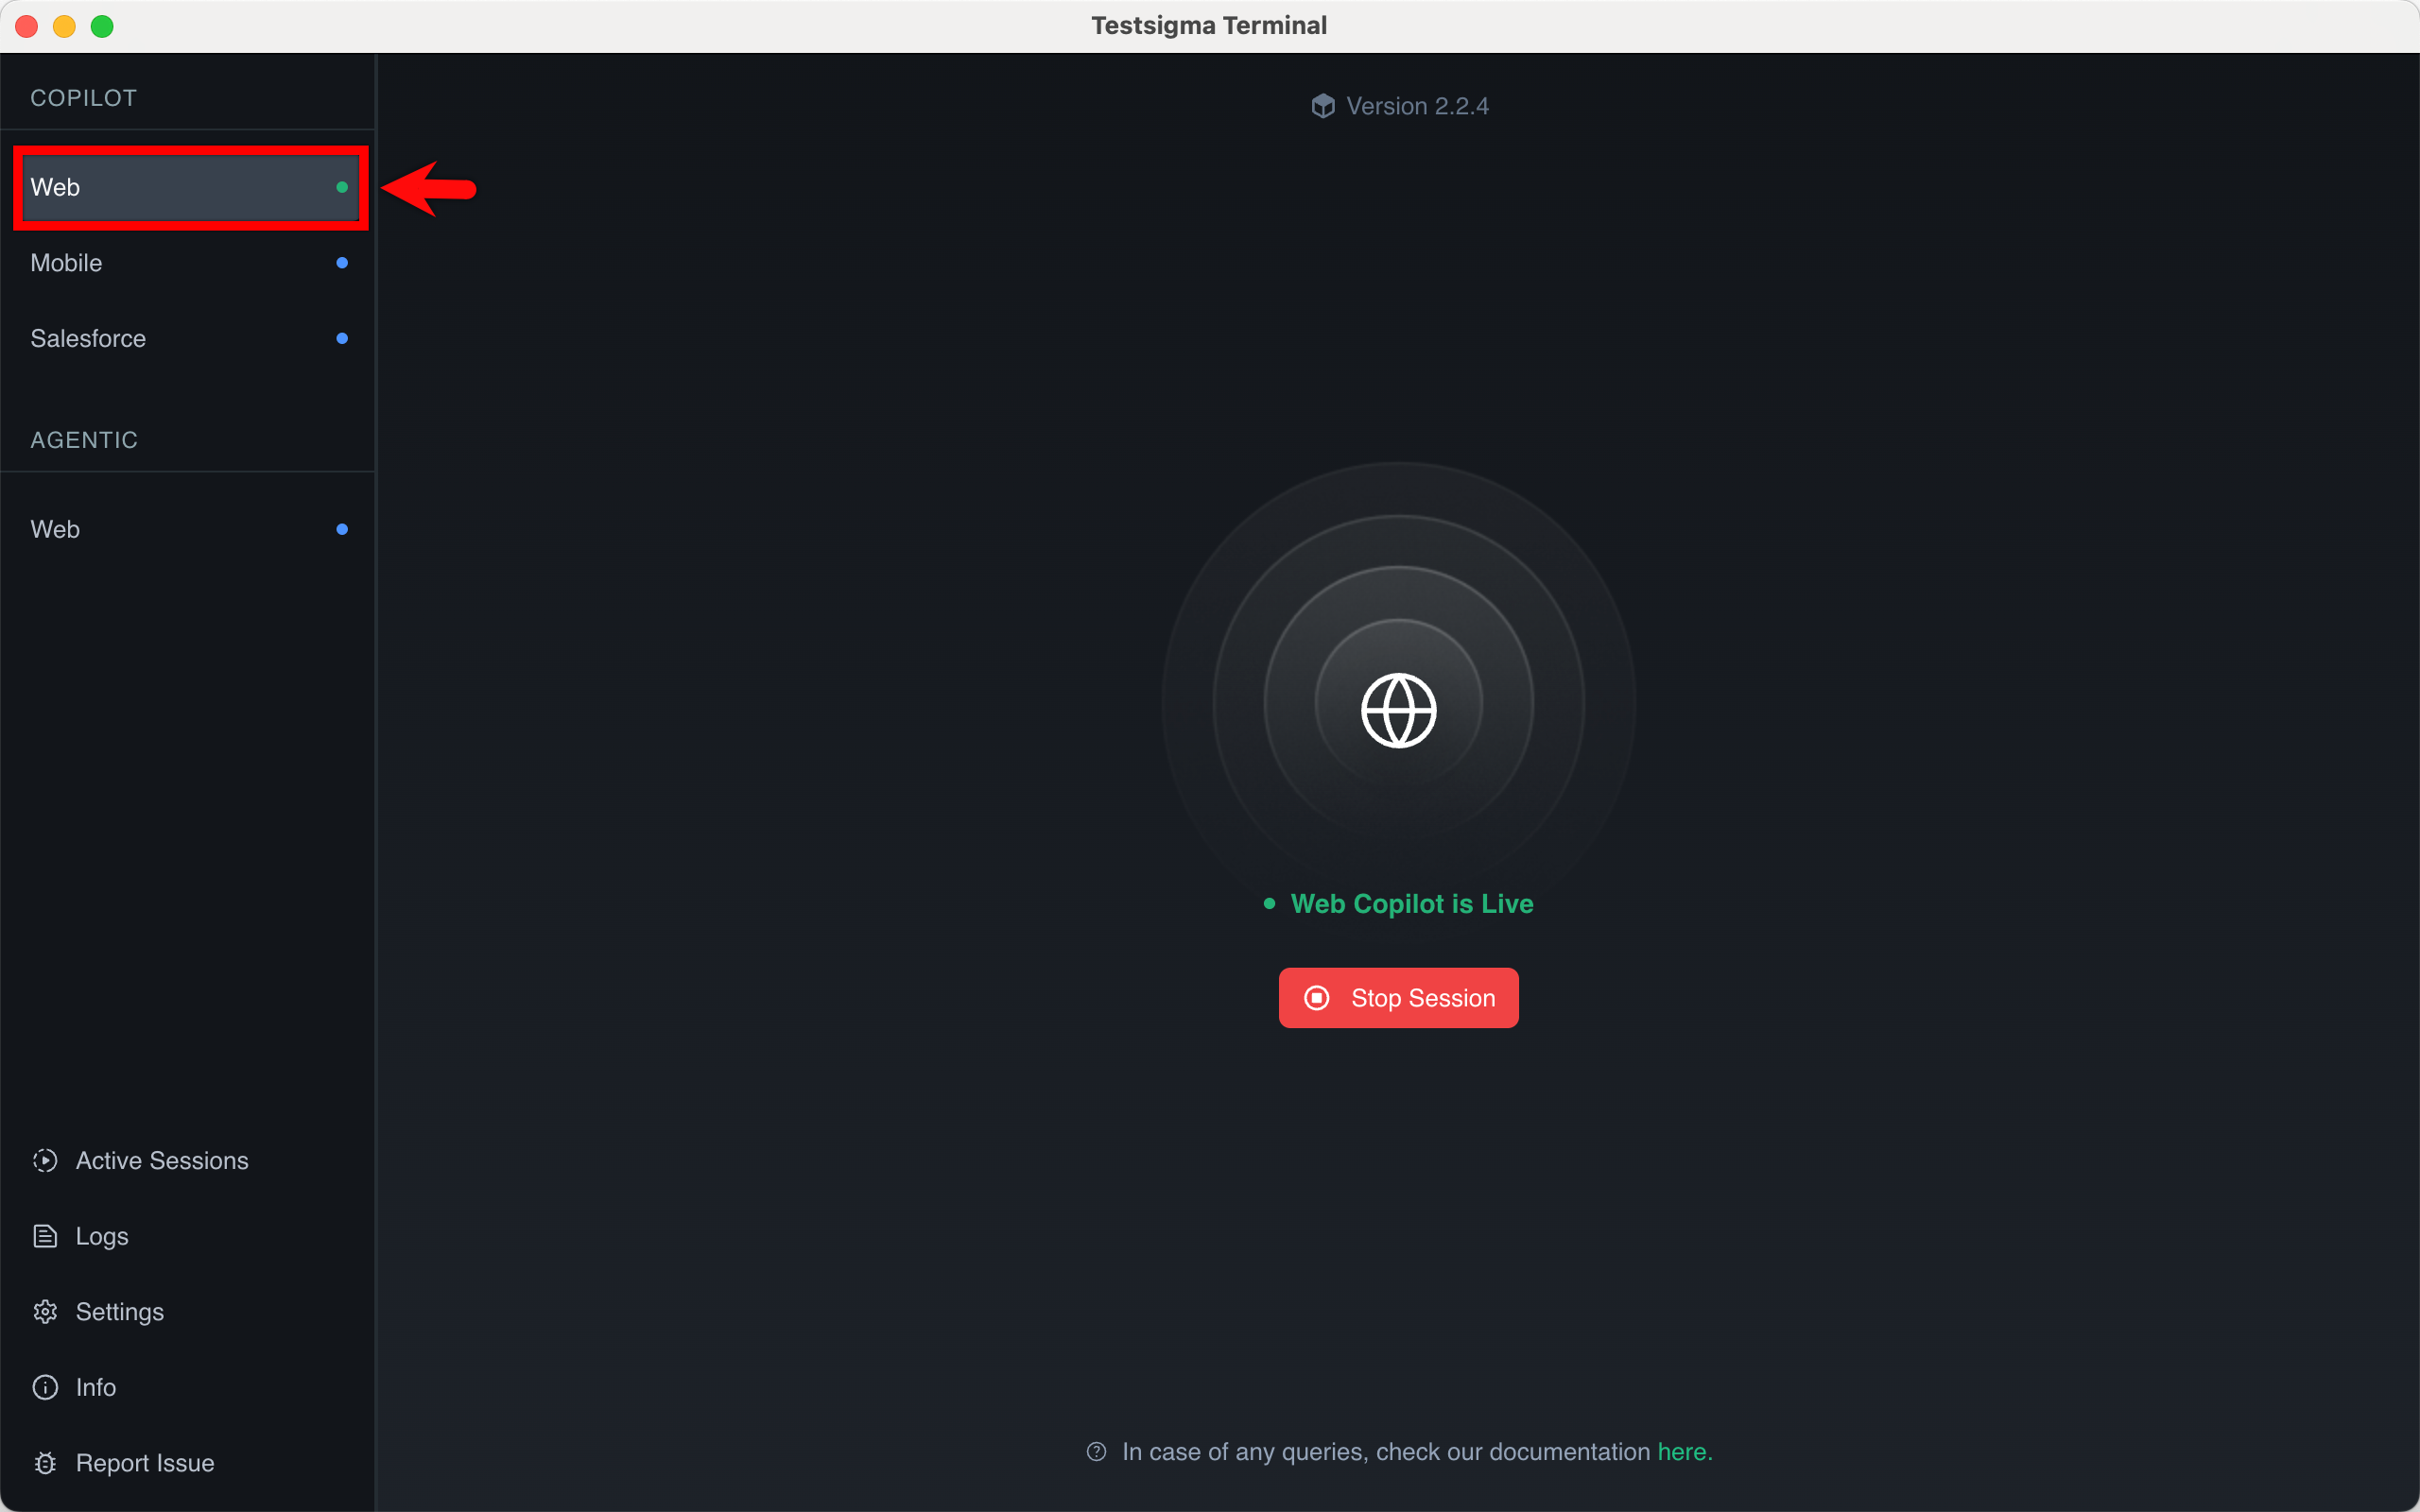
NOTE:When you execute a test case, whether it’s Web, Desktop, or Salesforce, the corresponding application listed under Copilot changes its status indicator from blue to green to show that an active session is running.
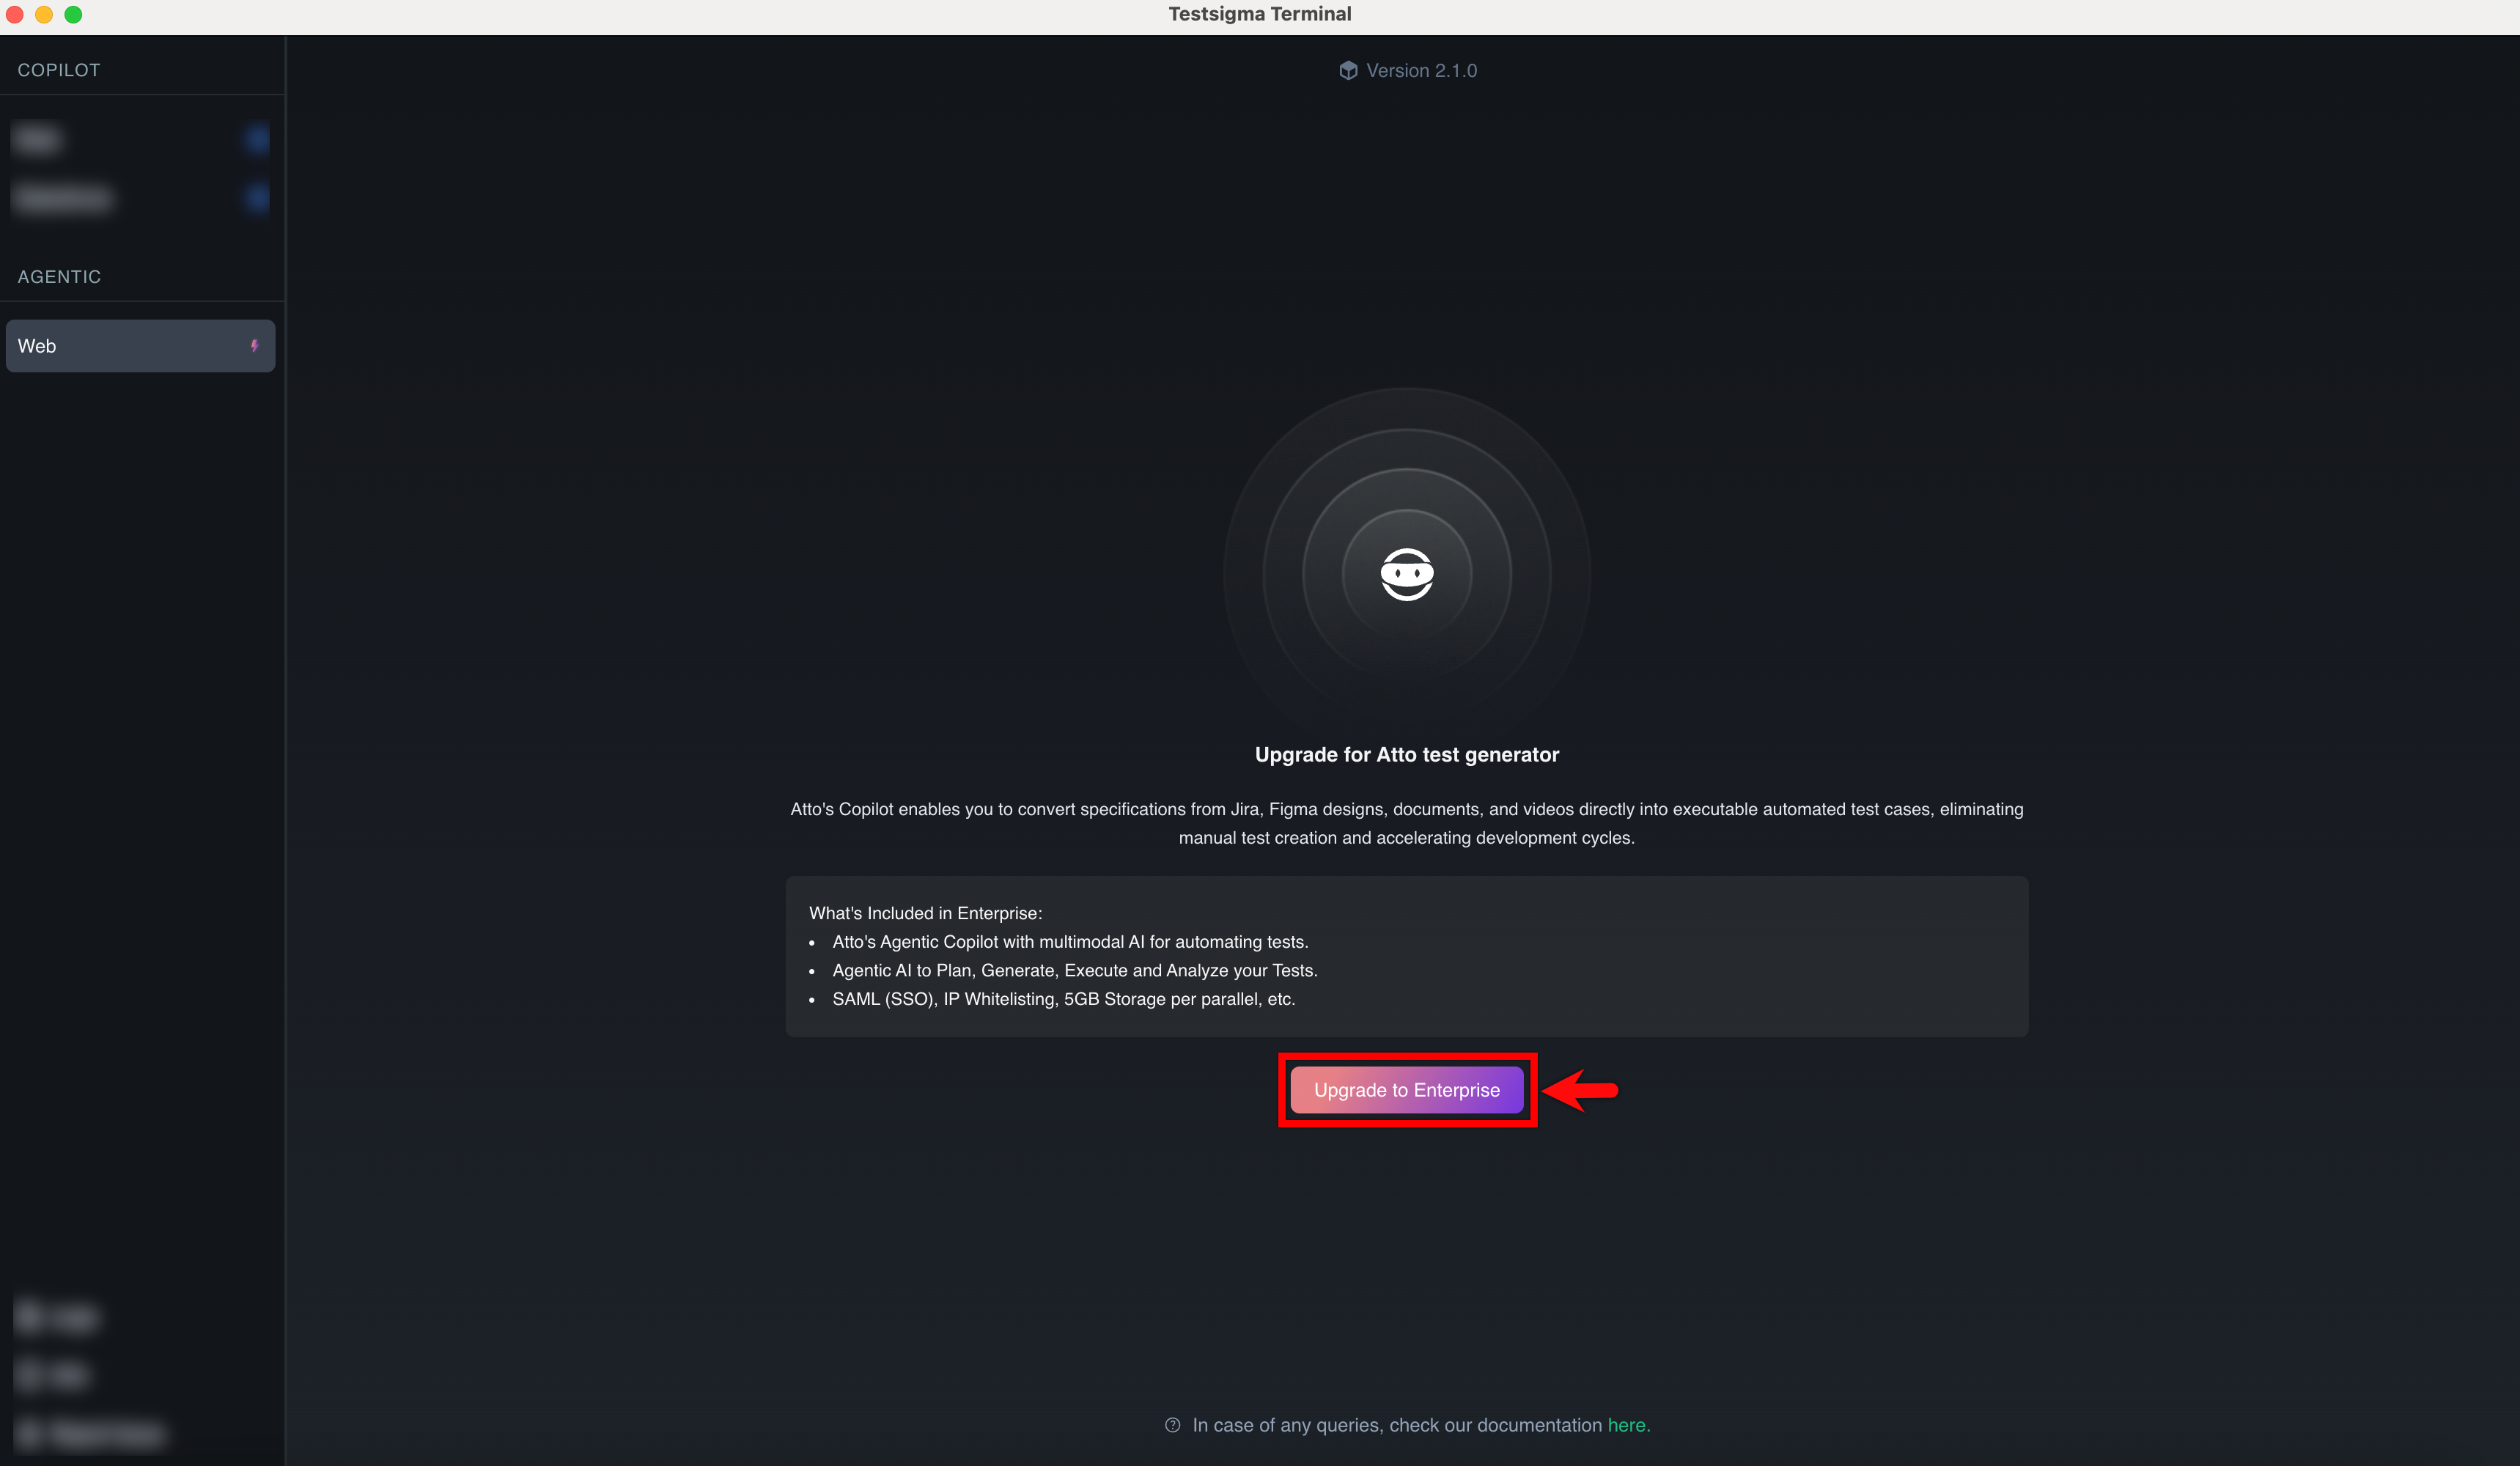
- Agentic – displays upgrade availability for Web, Salesforce, and Desktop applications.
Click Upgrade to Enterprise to enable enterprise-level Agentic features for the selected application.
- Copilot – supports execution for web, Salesforce, and desktop applications.
-
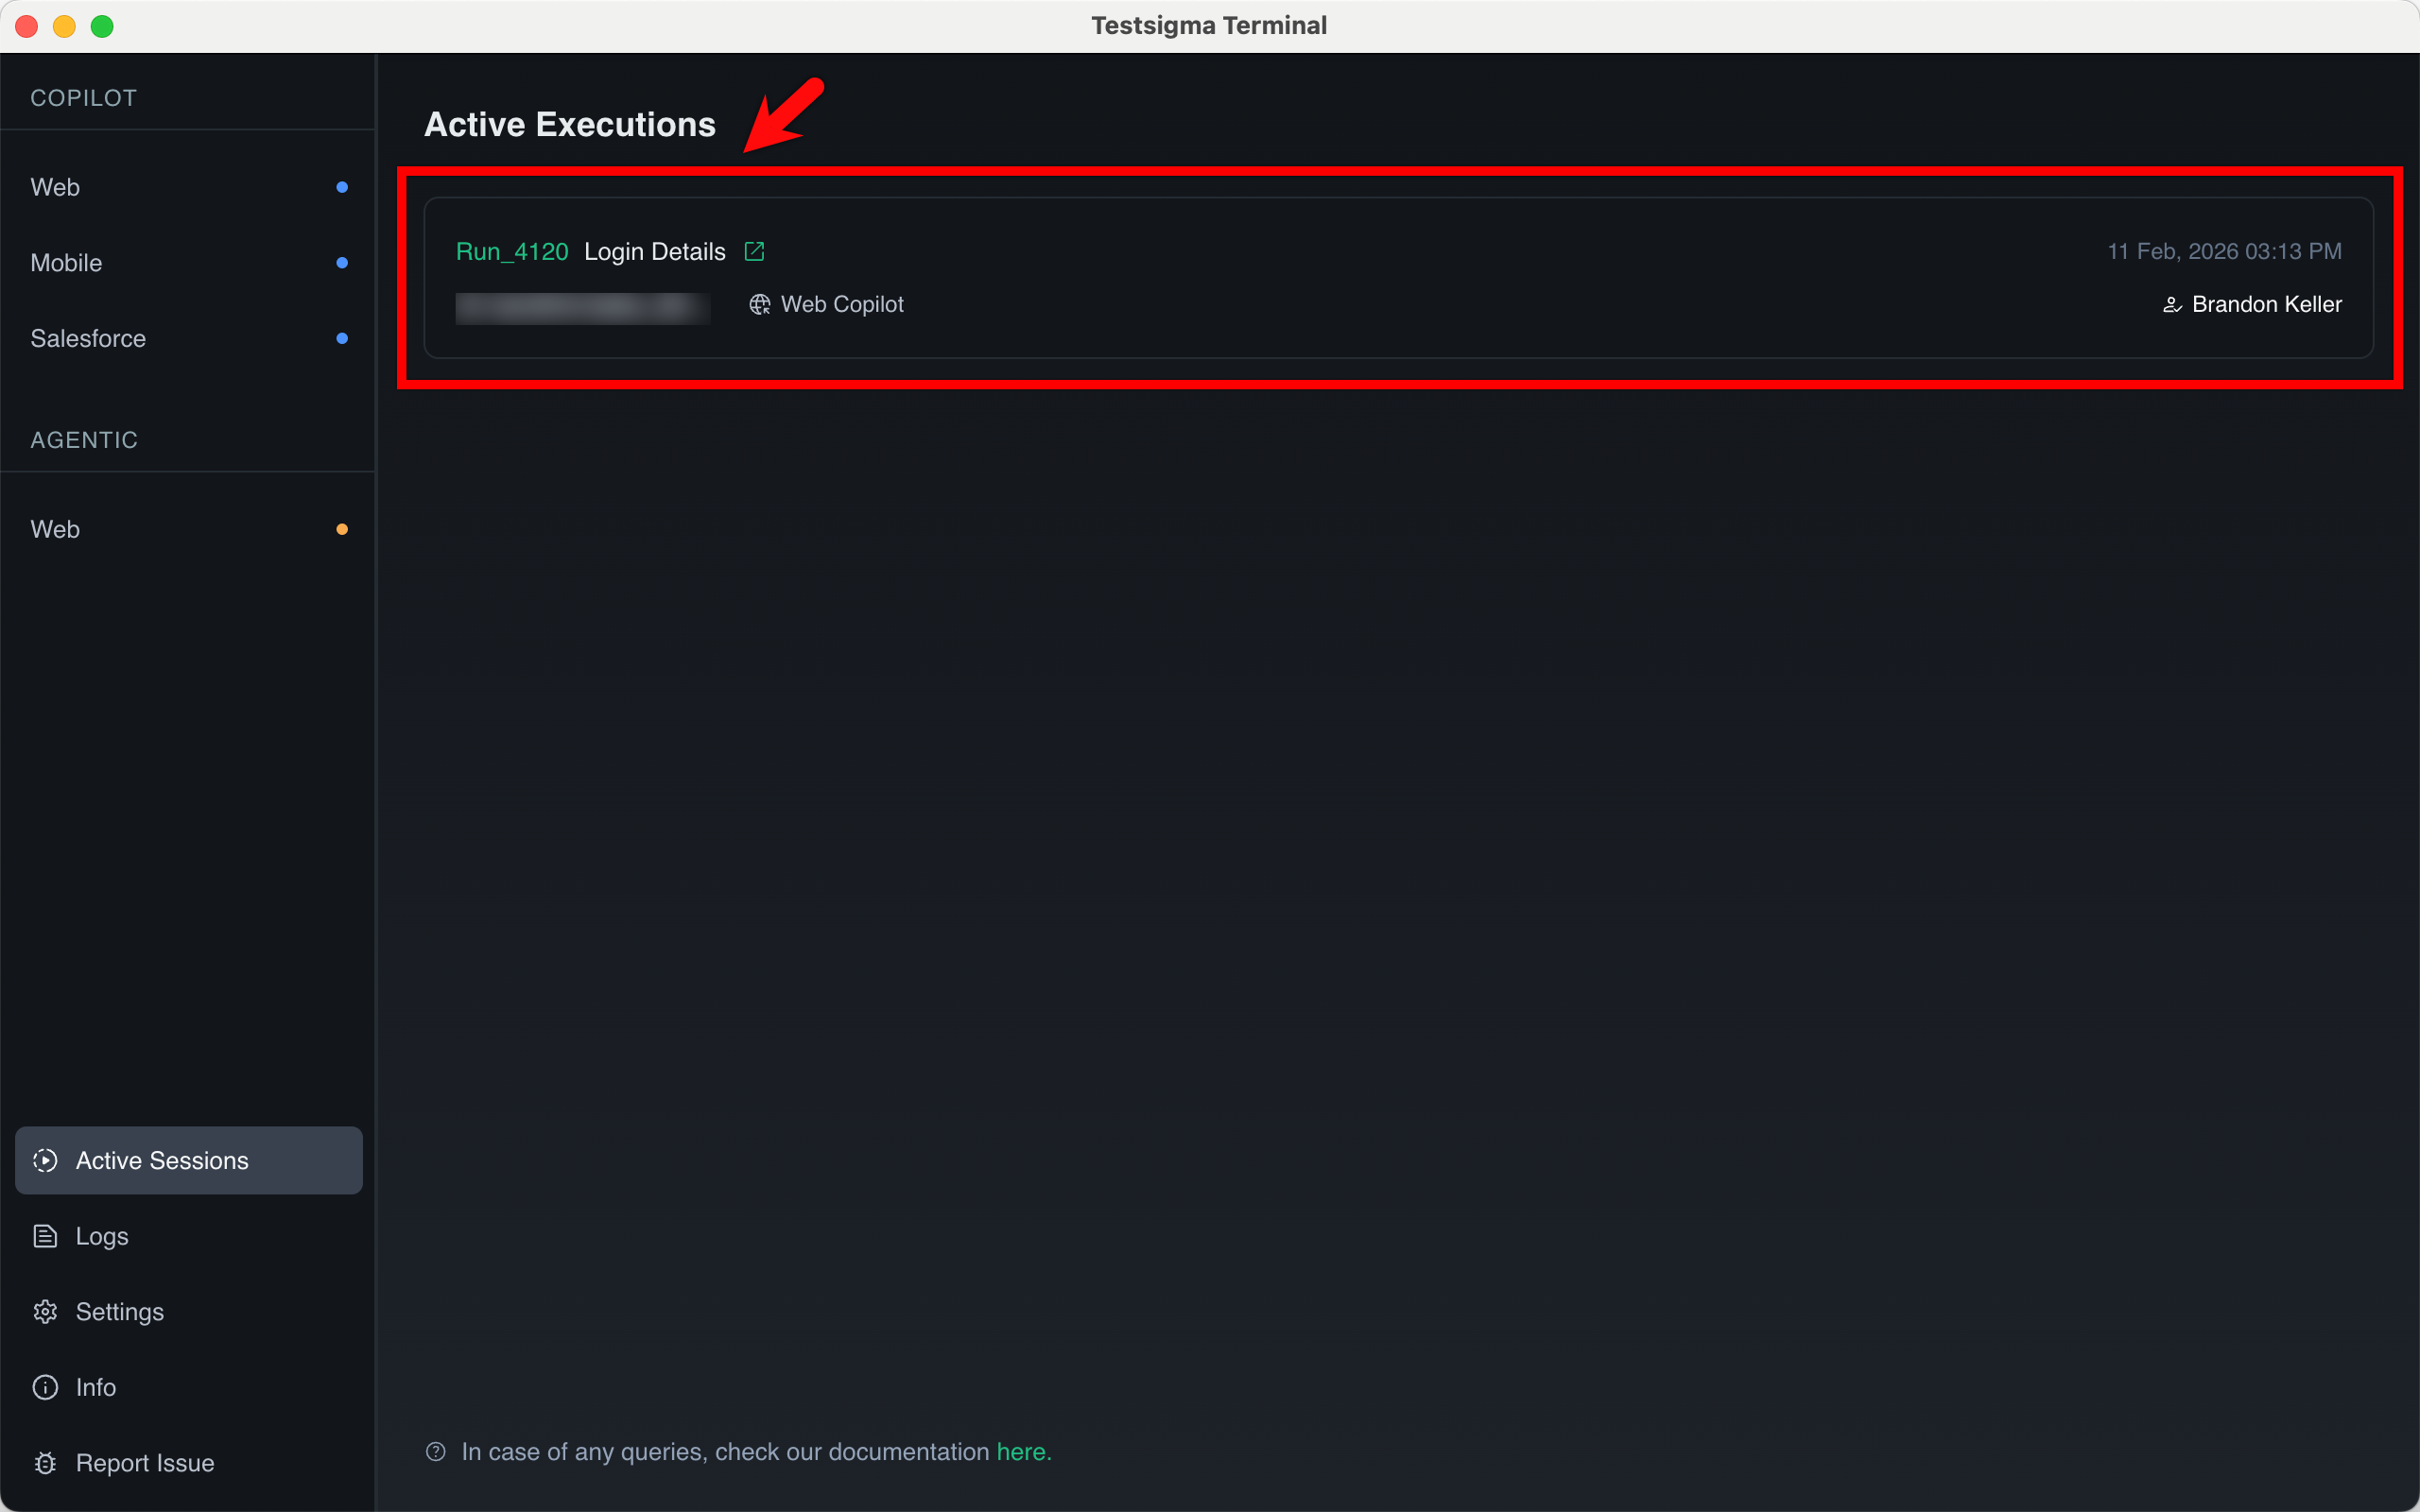
Click Active Sessions from the left navigation panel to monitor ongoing local executions.
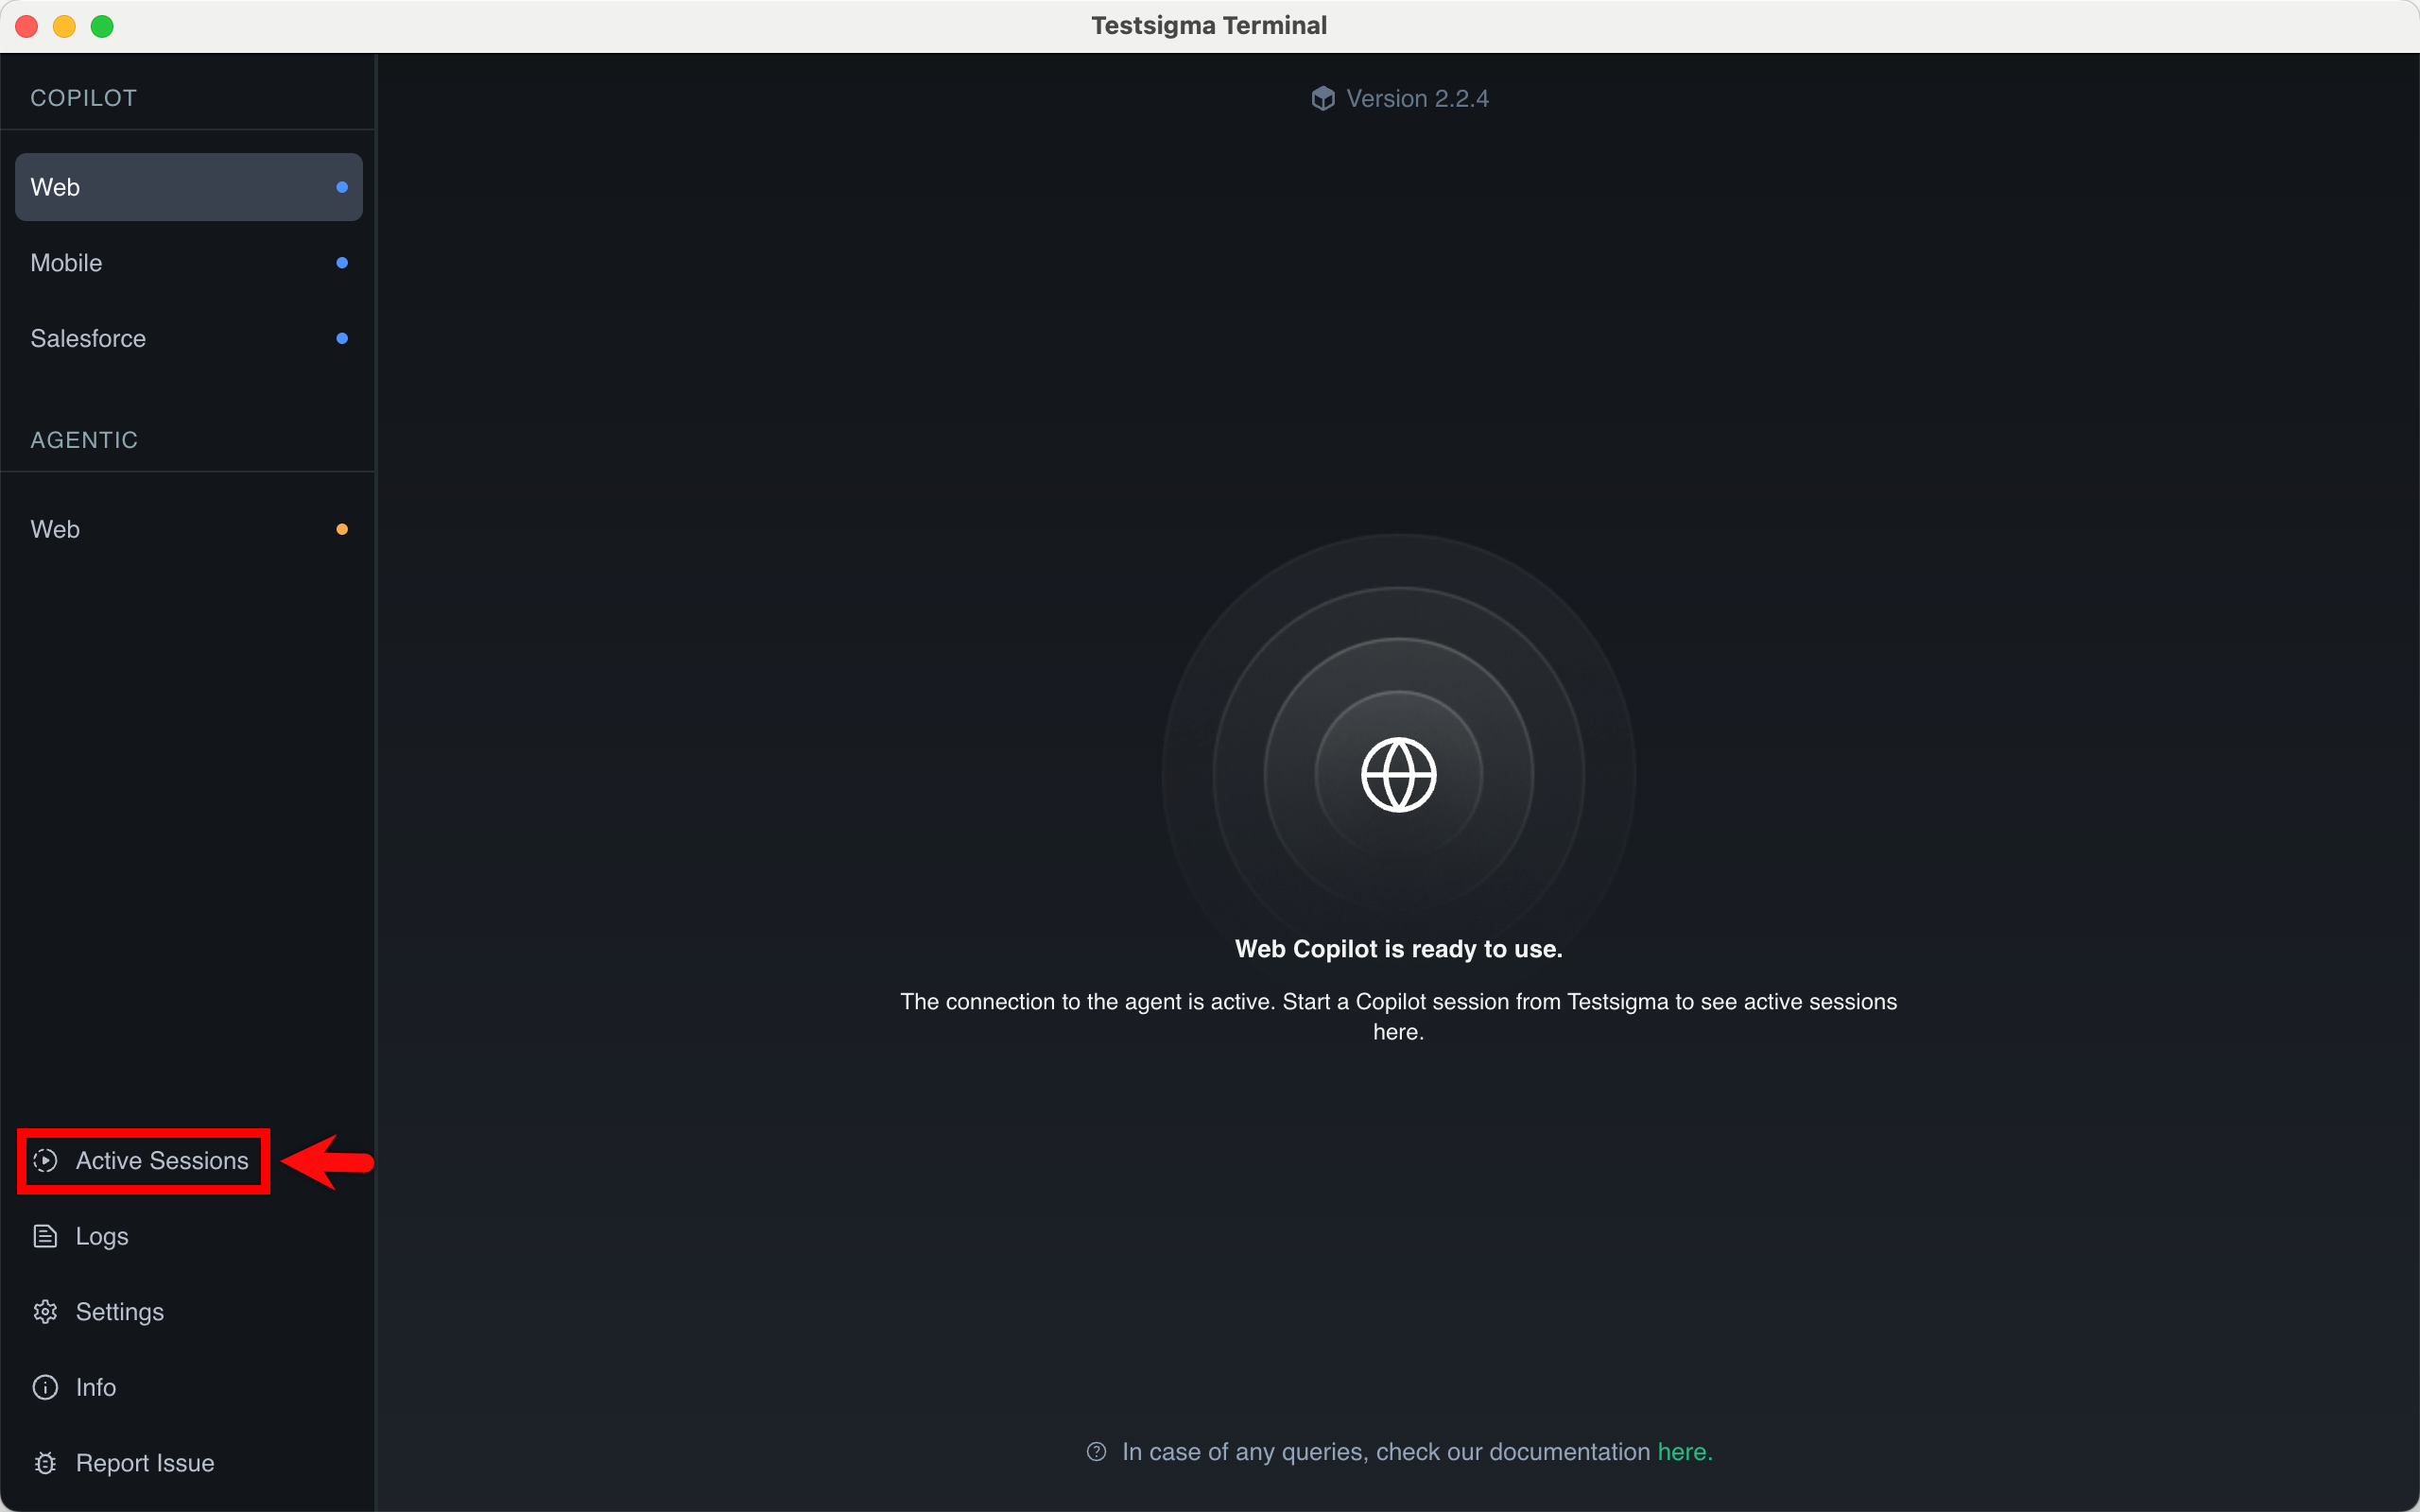
The Active Sessions page provides real-time visibility into all test runs executed through the local agent.
On this page, you can:
- View the Run ID and test name.
- Identify the execution type (for example, Web Copilot).
- See the user who triggered the execution.
- Check the timestamp of the active run.
- Monitor execution status without navigating back to the Testsigma dashboard.
-
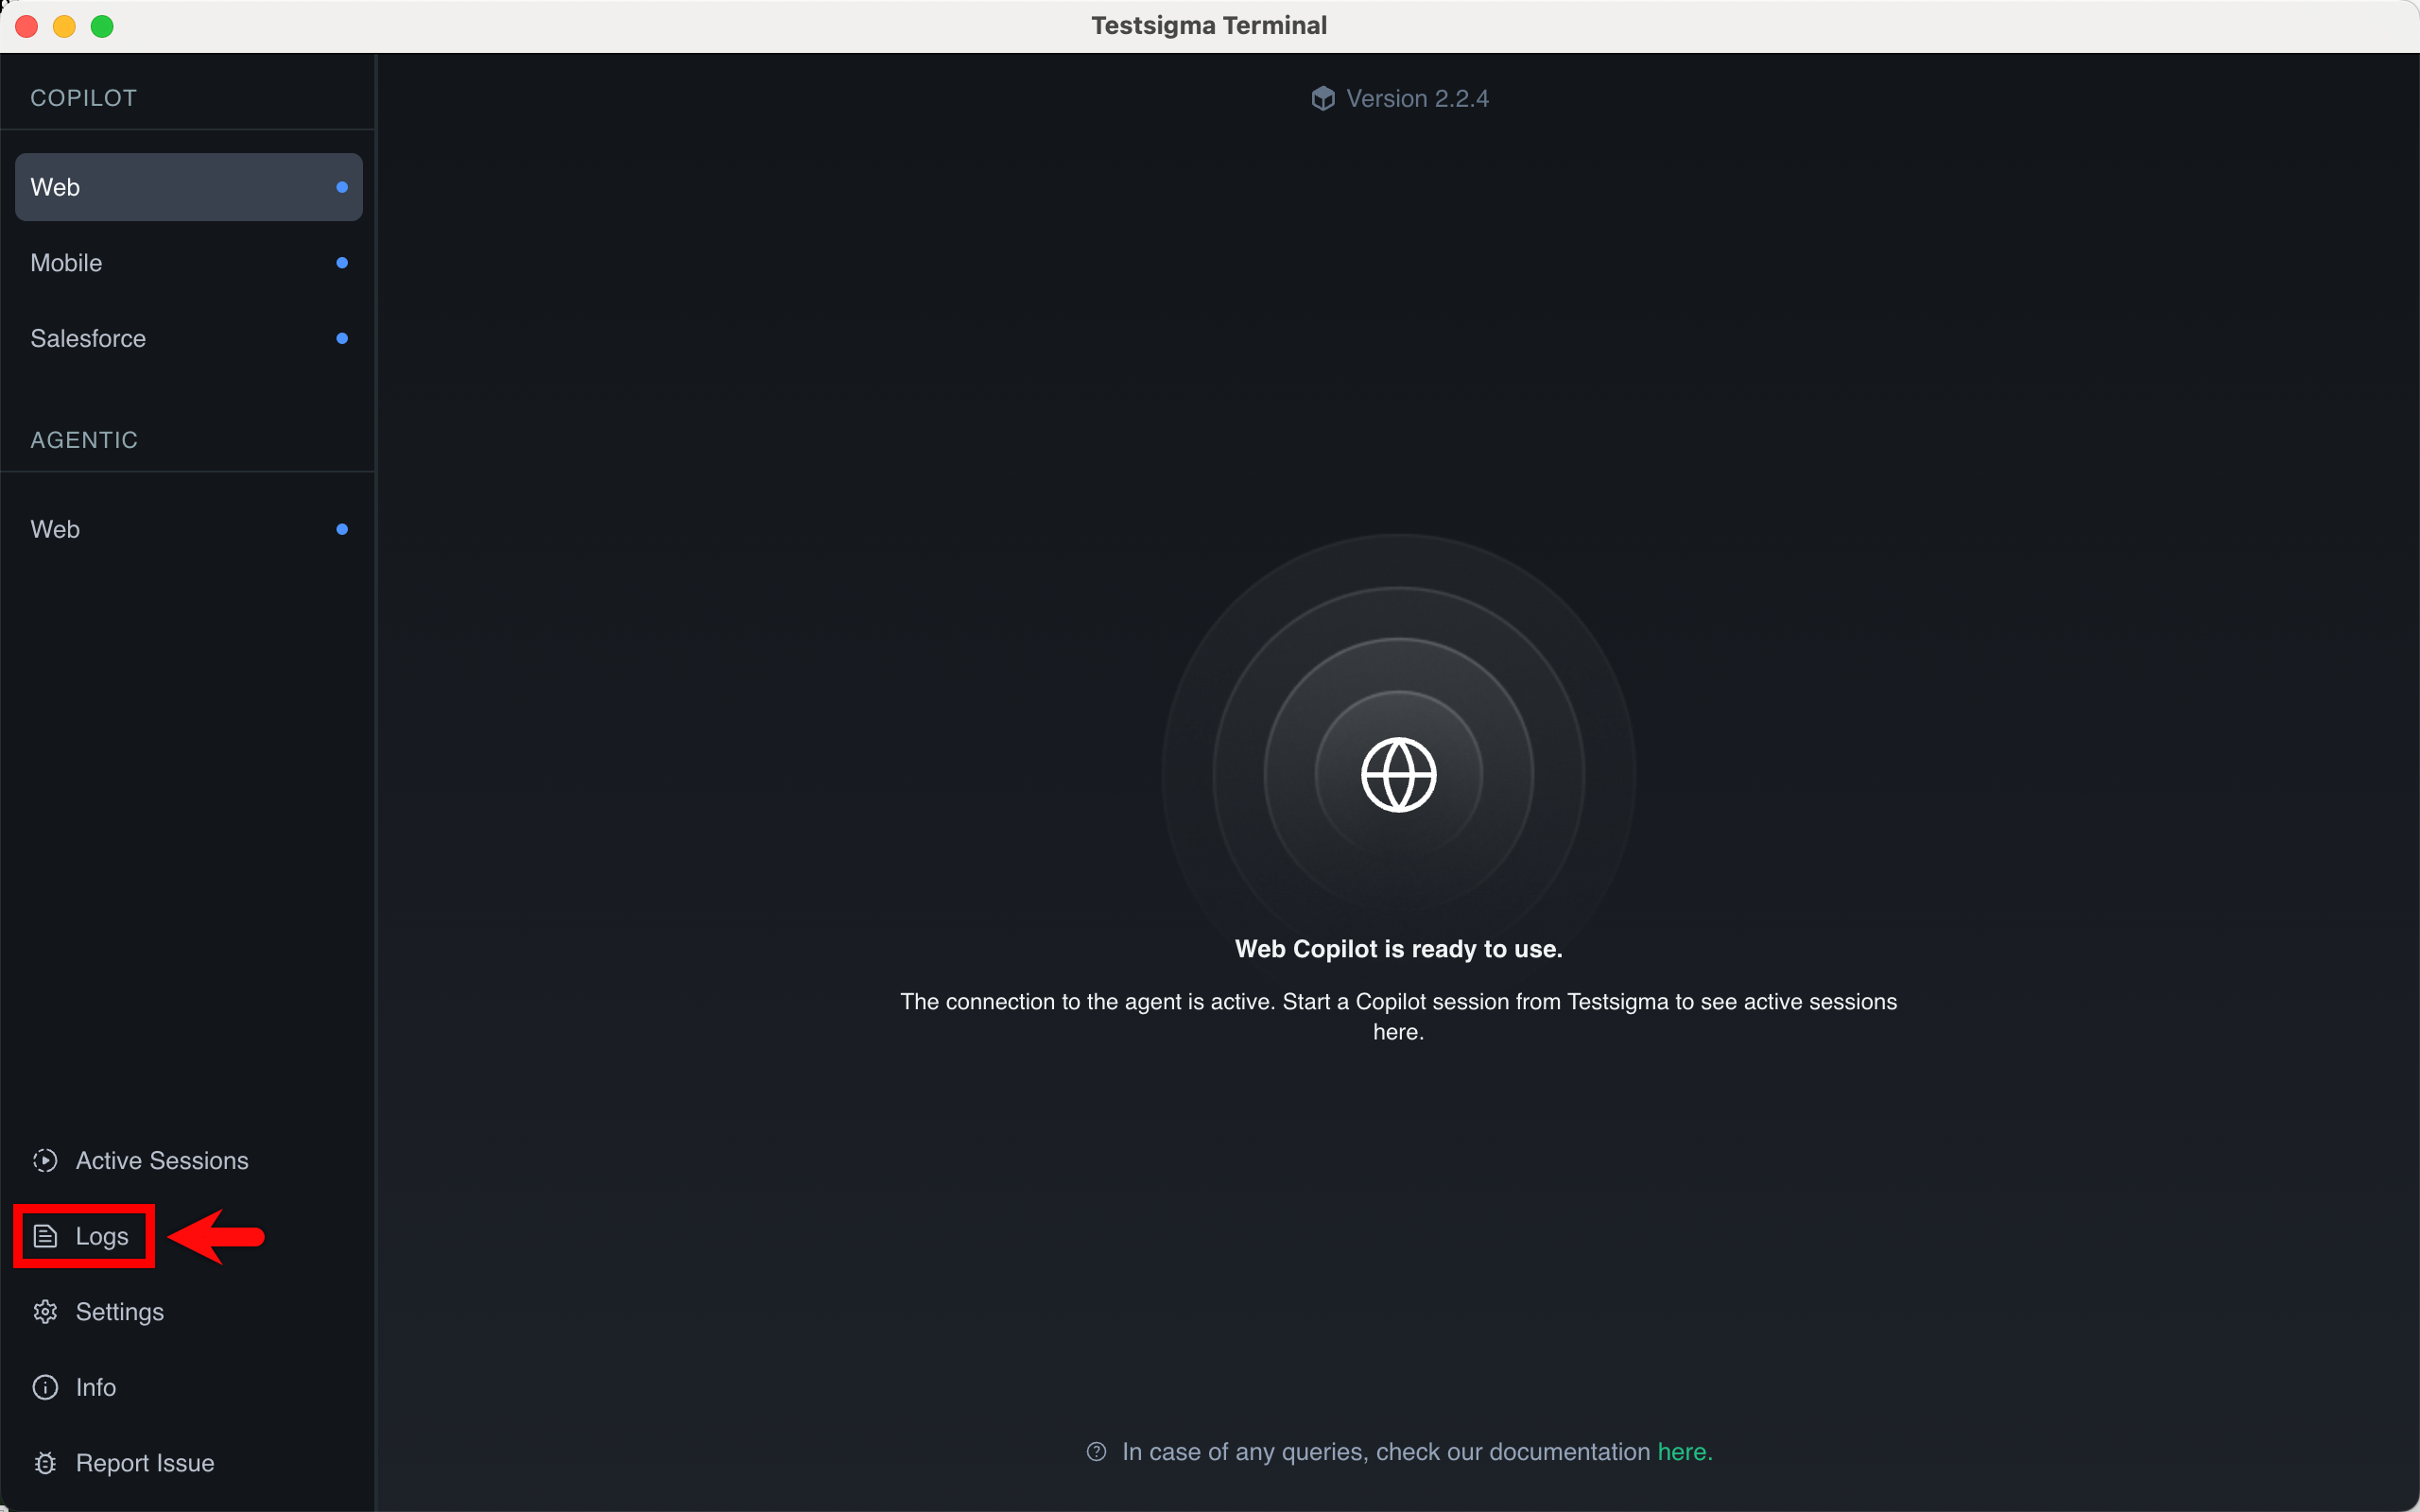
To view logs, click Logs from the left panel. The Logs page provides a complete overview of debugging information, organized across three tabs for easy access and analysis.
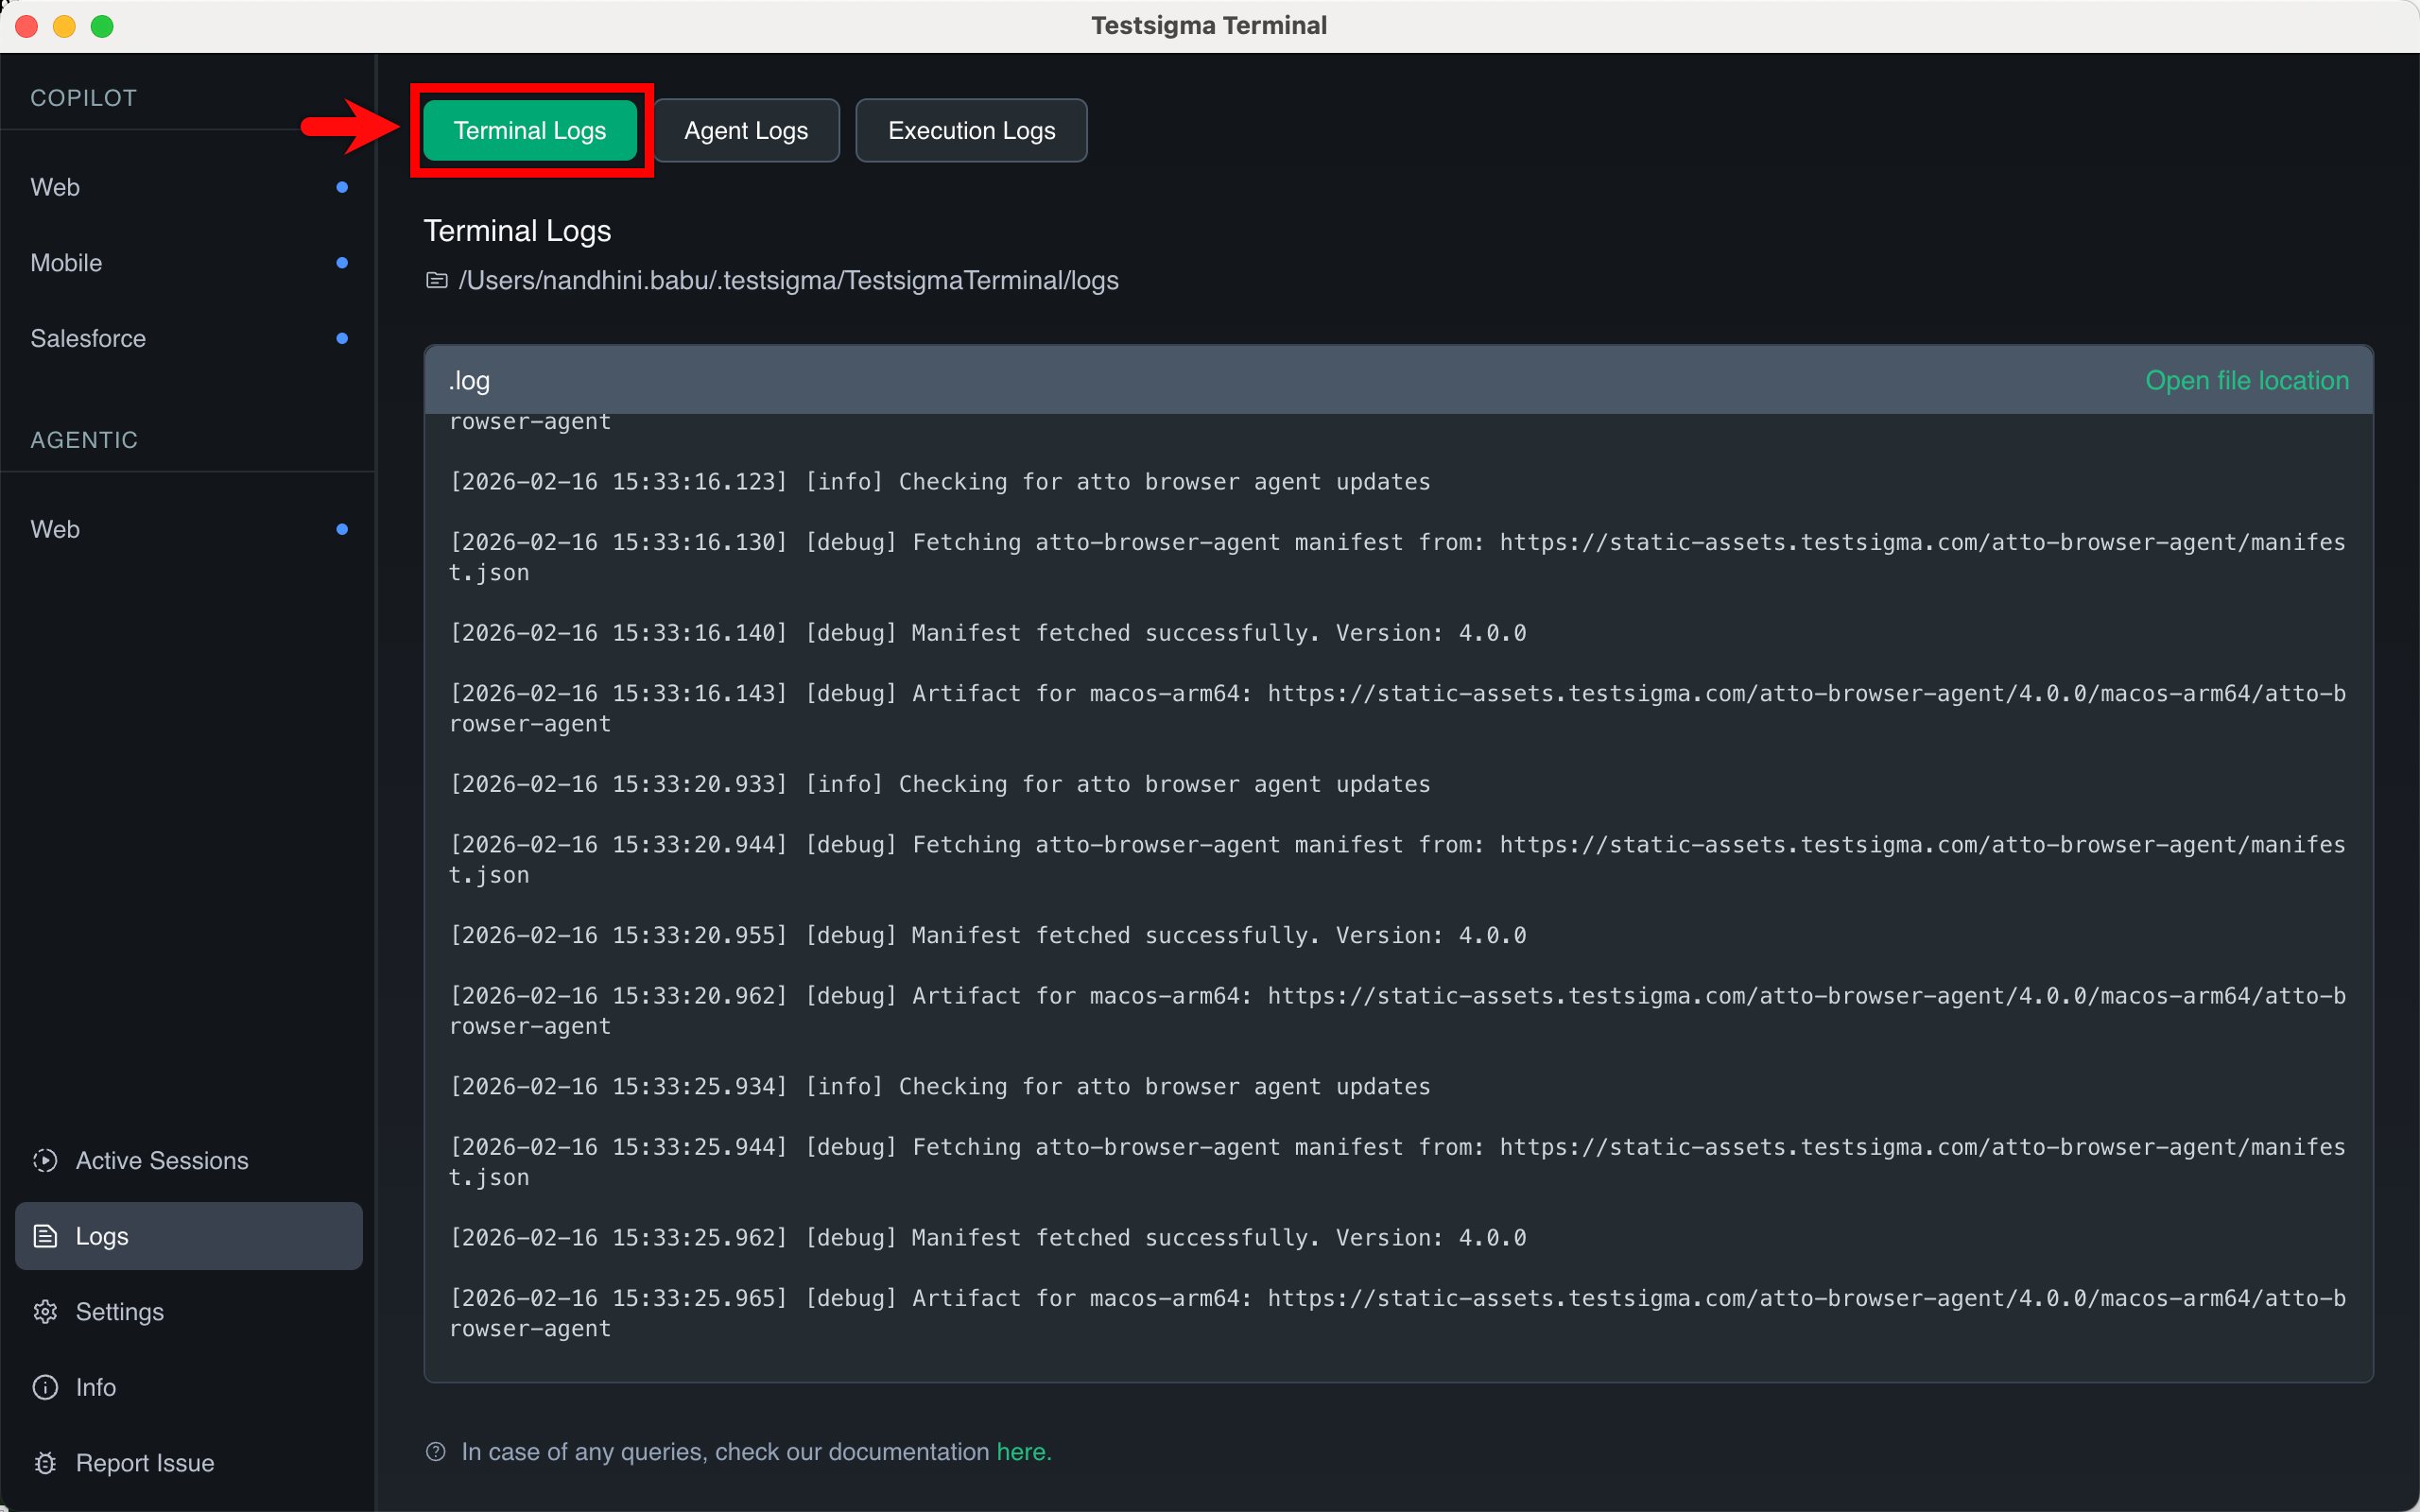
- Terminal Logs – These logs show the status and setup of the Testsigma Terminal app.You will find information about agent and packages installation, system configuration, and the communication status between the Terminal and the Copilot agent.
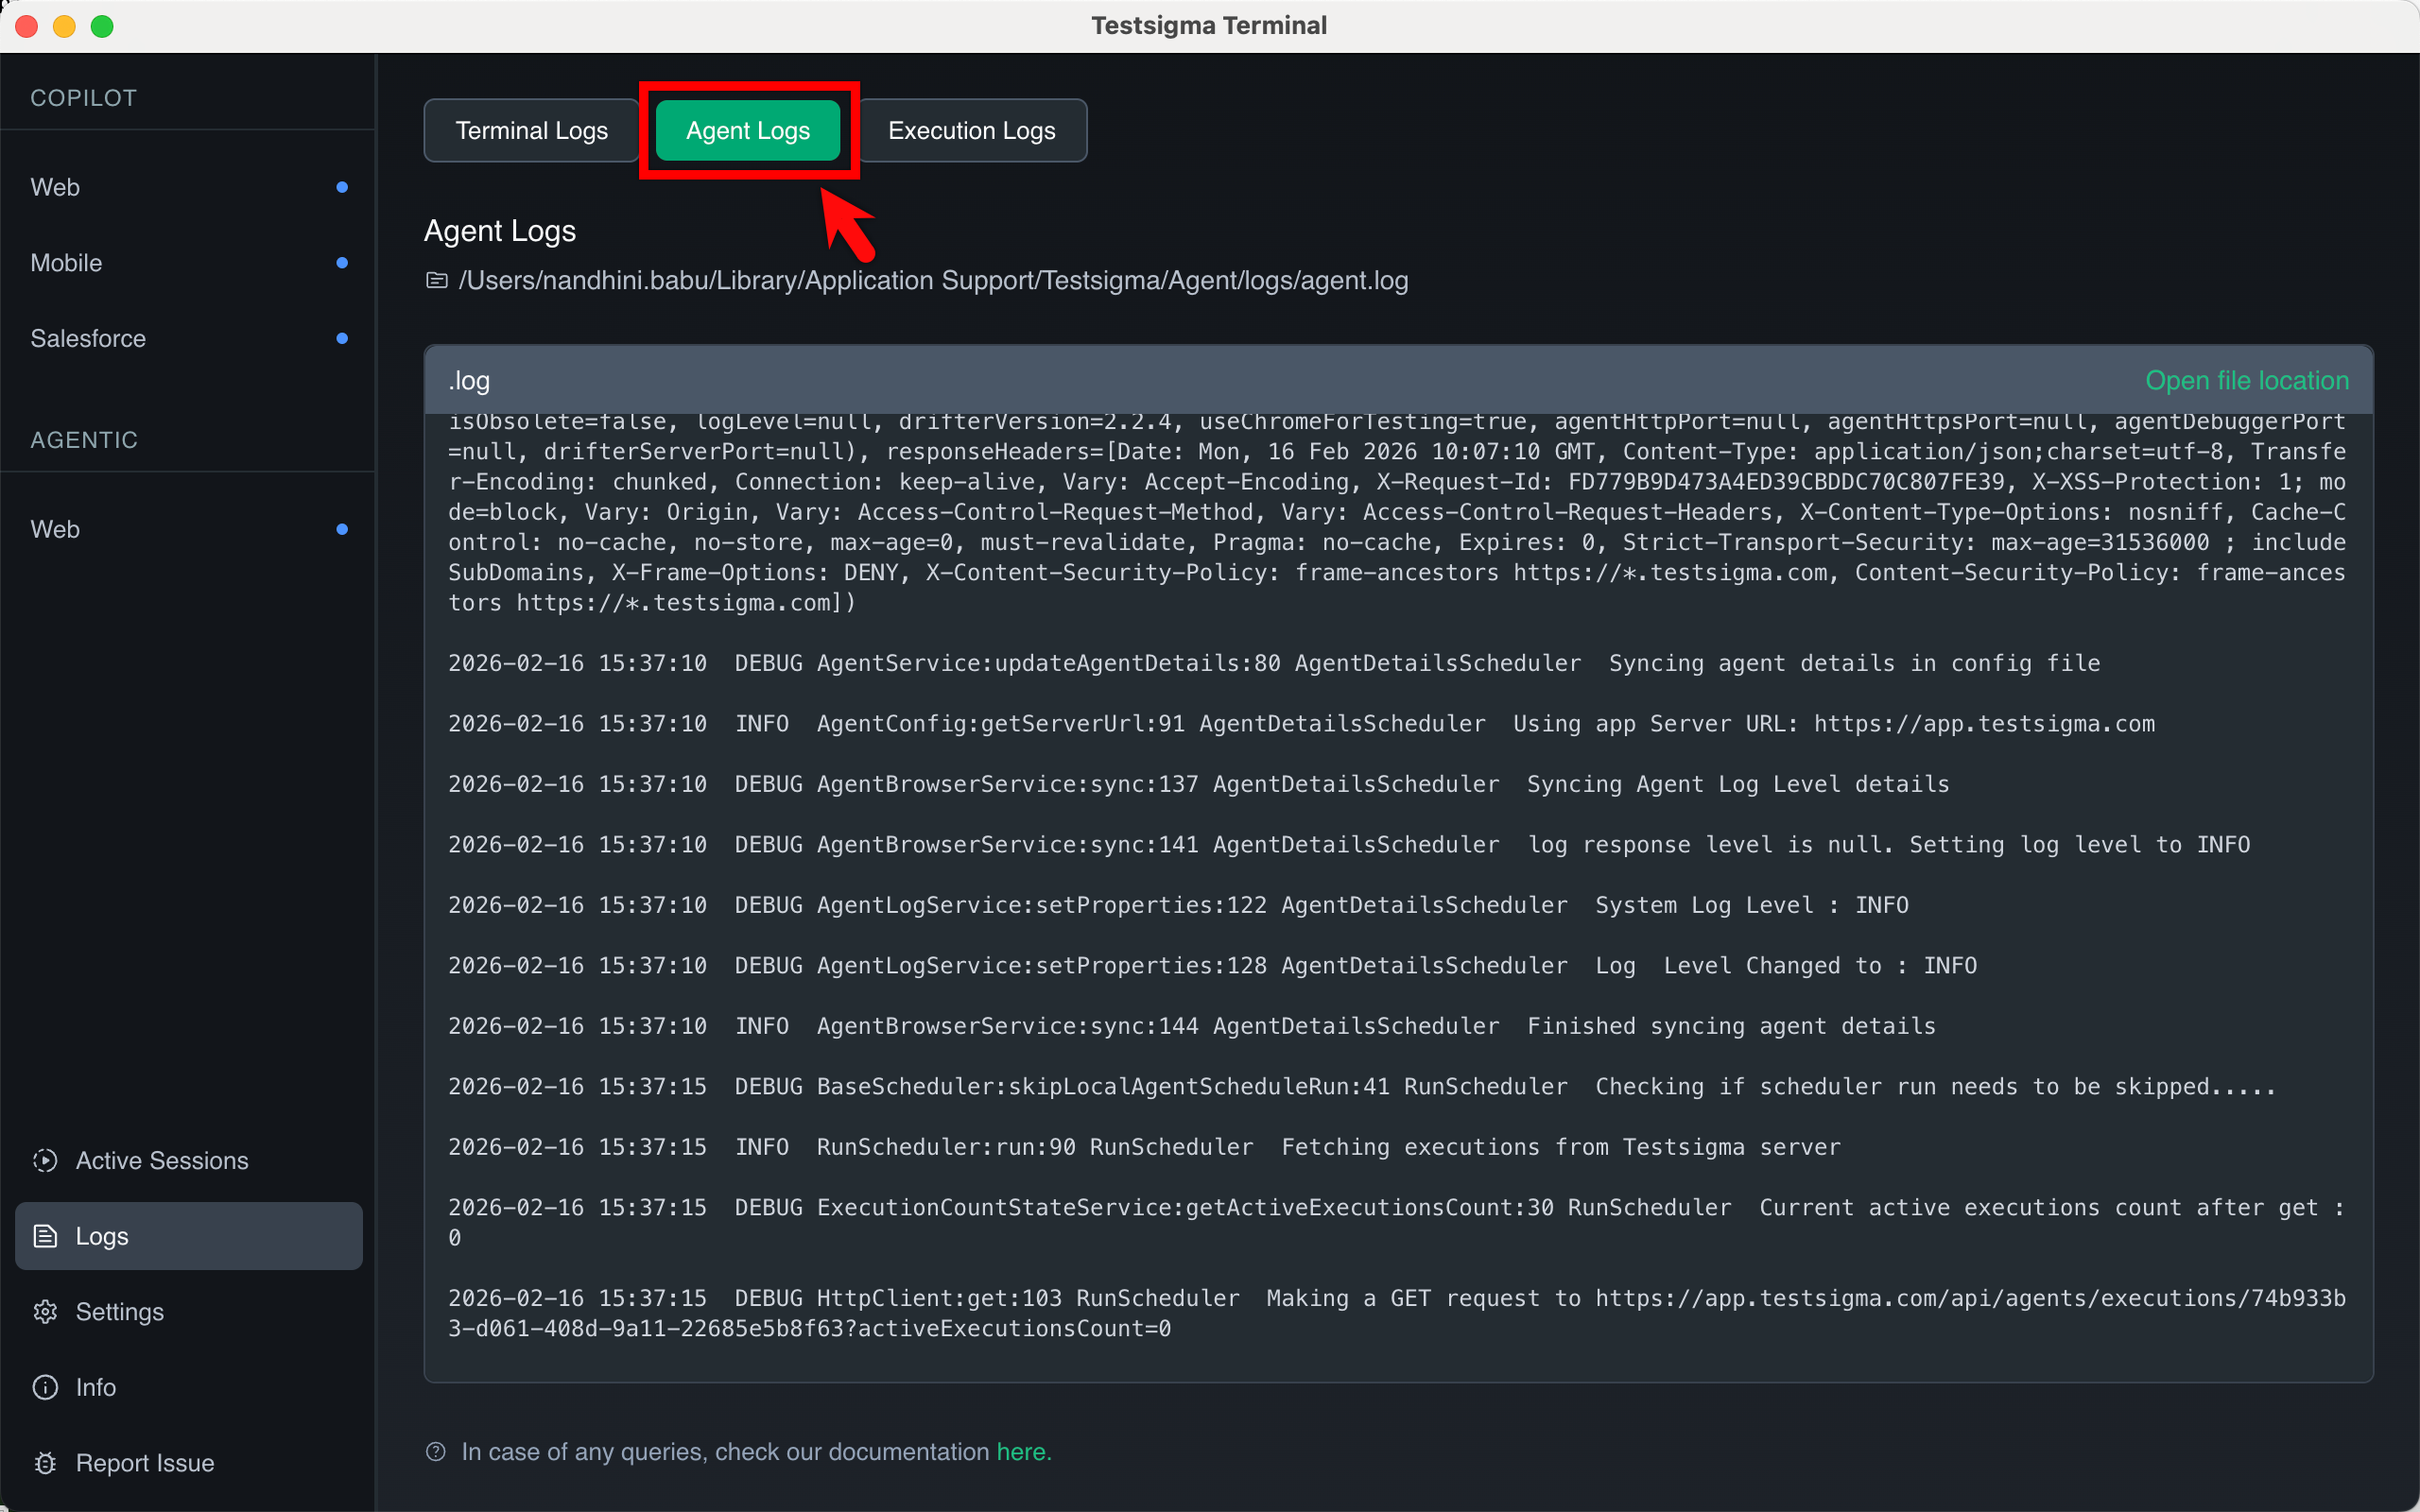
- Agent Logs – These logs show everything that happens inside the execution agent (Copilot) while it is running a test. This includes the communication records and all the steps taken during test execution.
- Execution Logs – These logs show the real-time activity for the test you are currently running. You will find specific information related to the execution active in the Copilot.
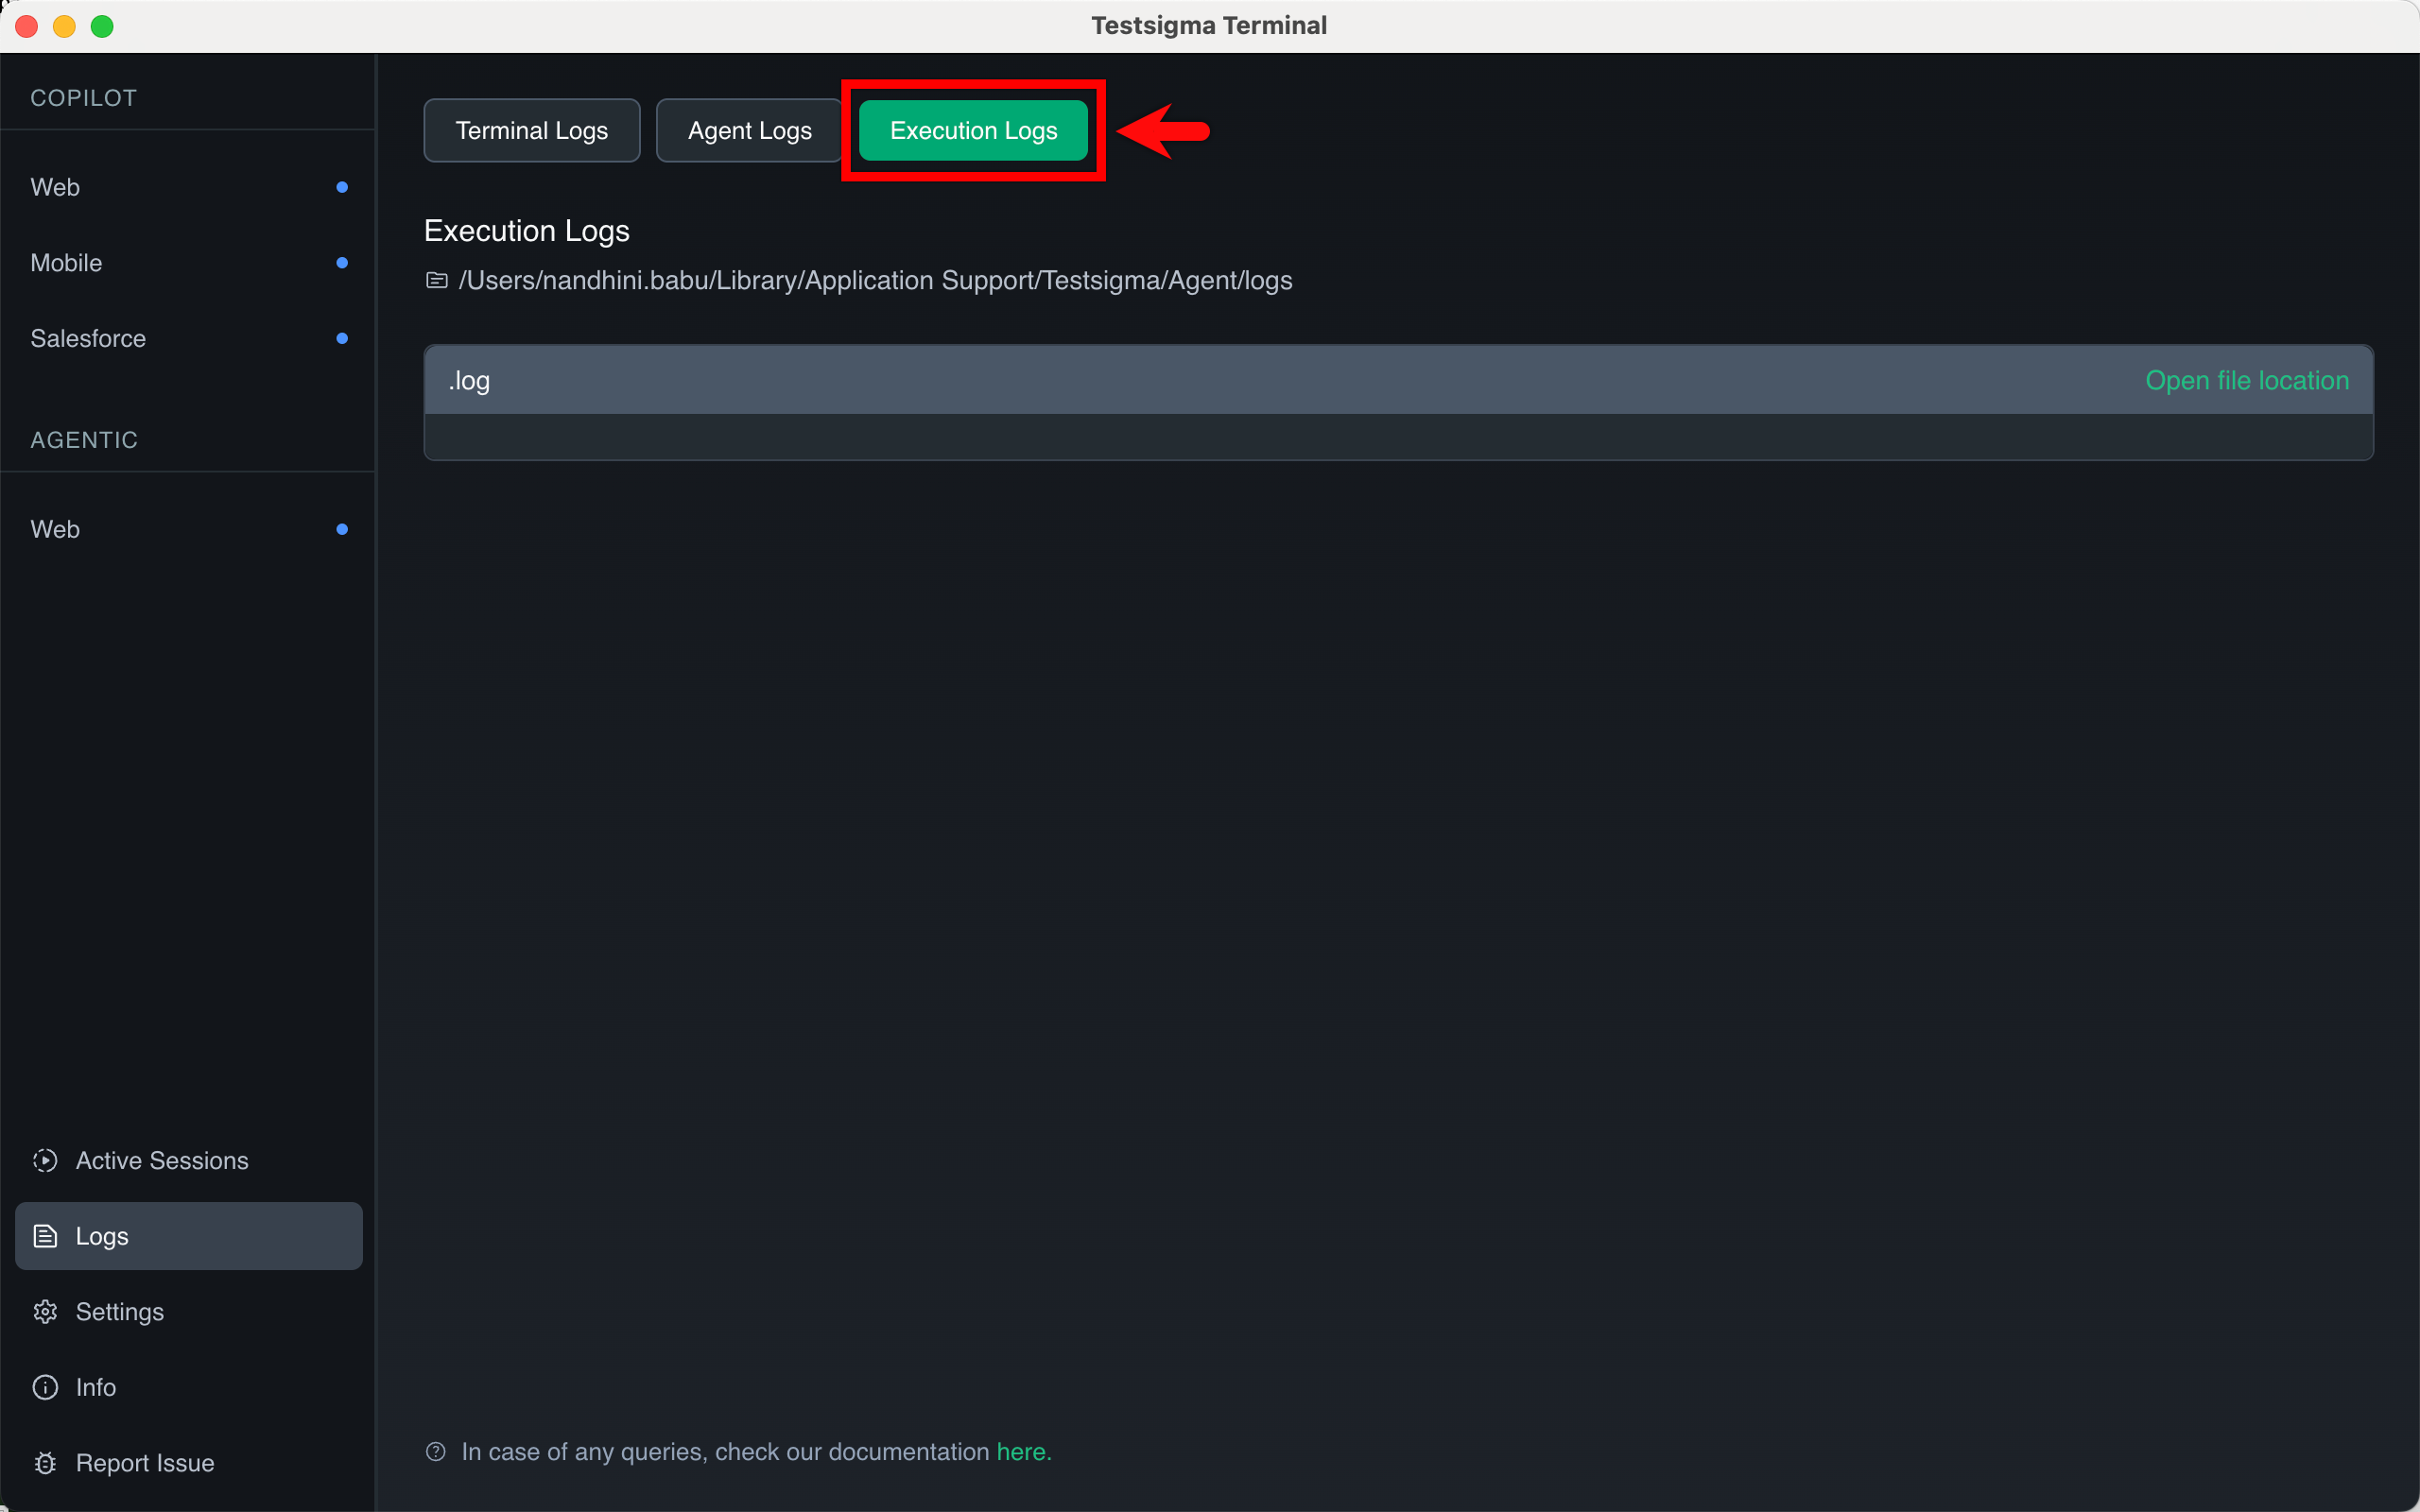
- Terminal Logs – These logs show the status and setup of the Testsigma Terminal app.You will find information about agent and packages installation, system configuration, and the communication status between the Terminal and the Copilot agent.
-
To customize the terminal behavior, click Settings from the left panel.
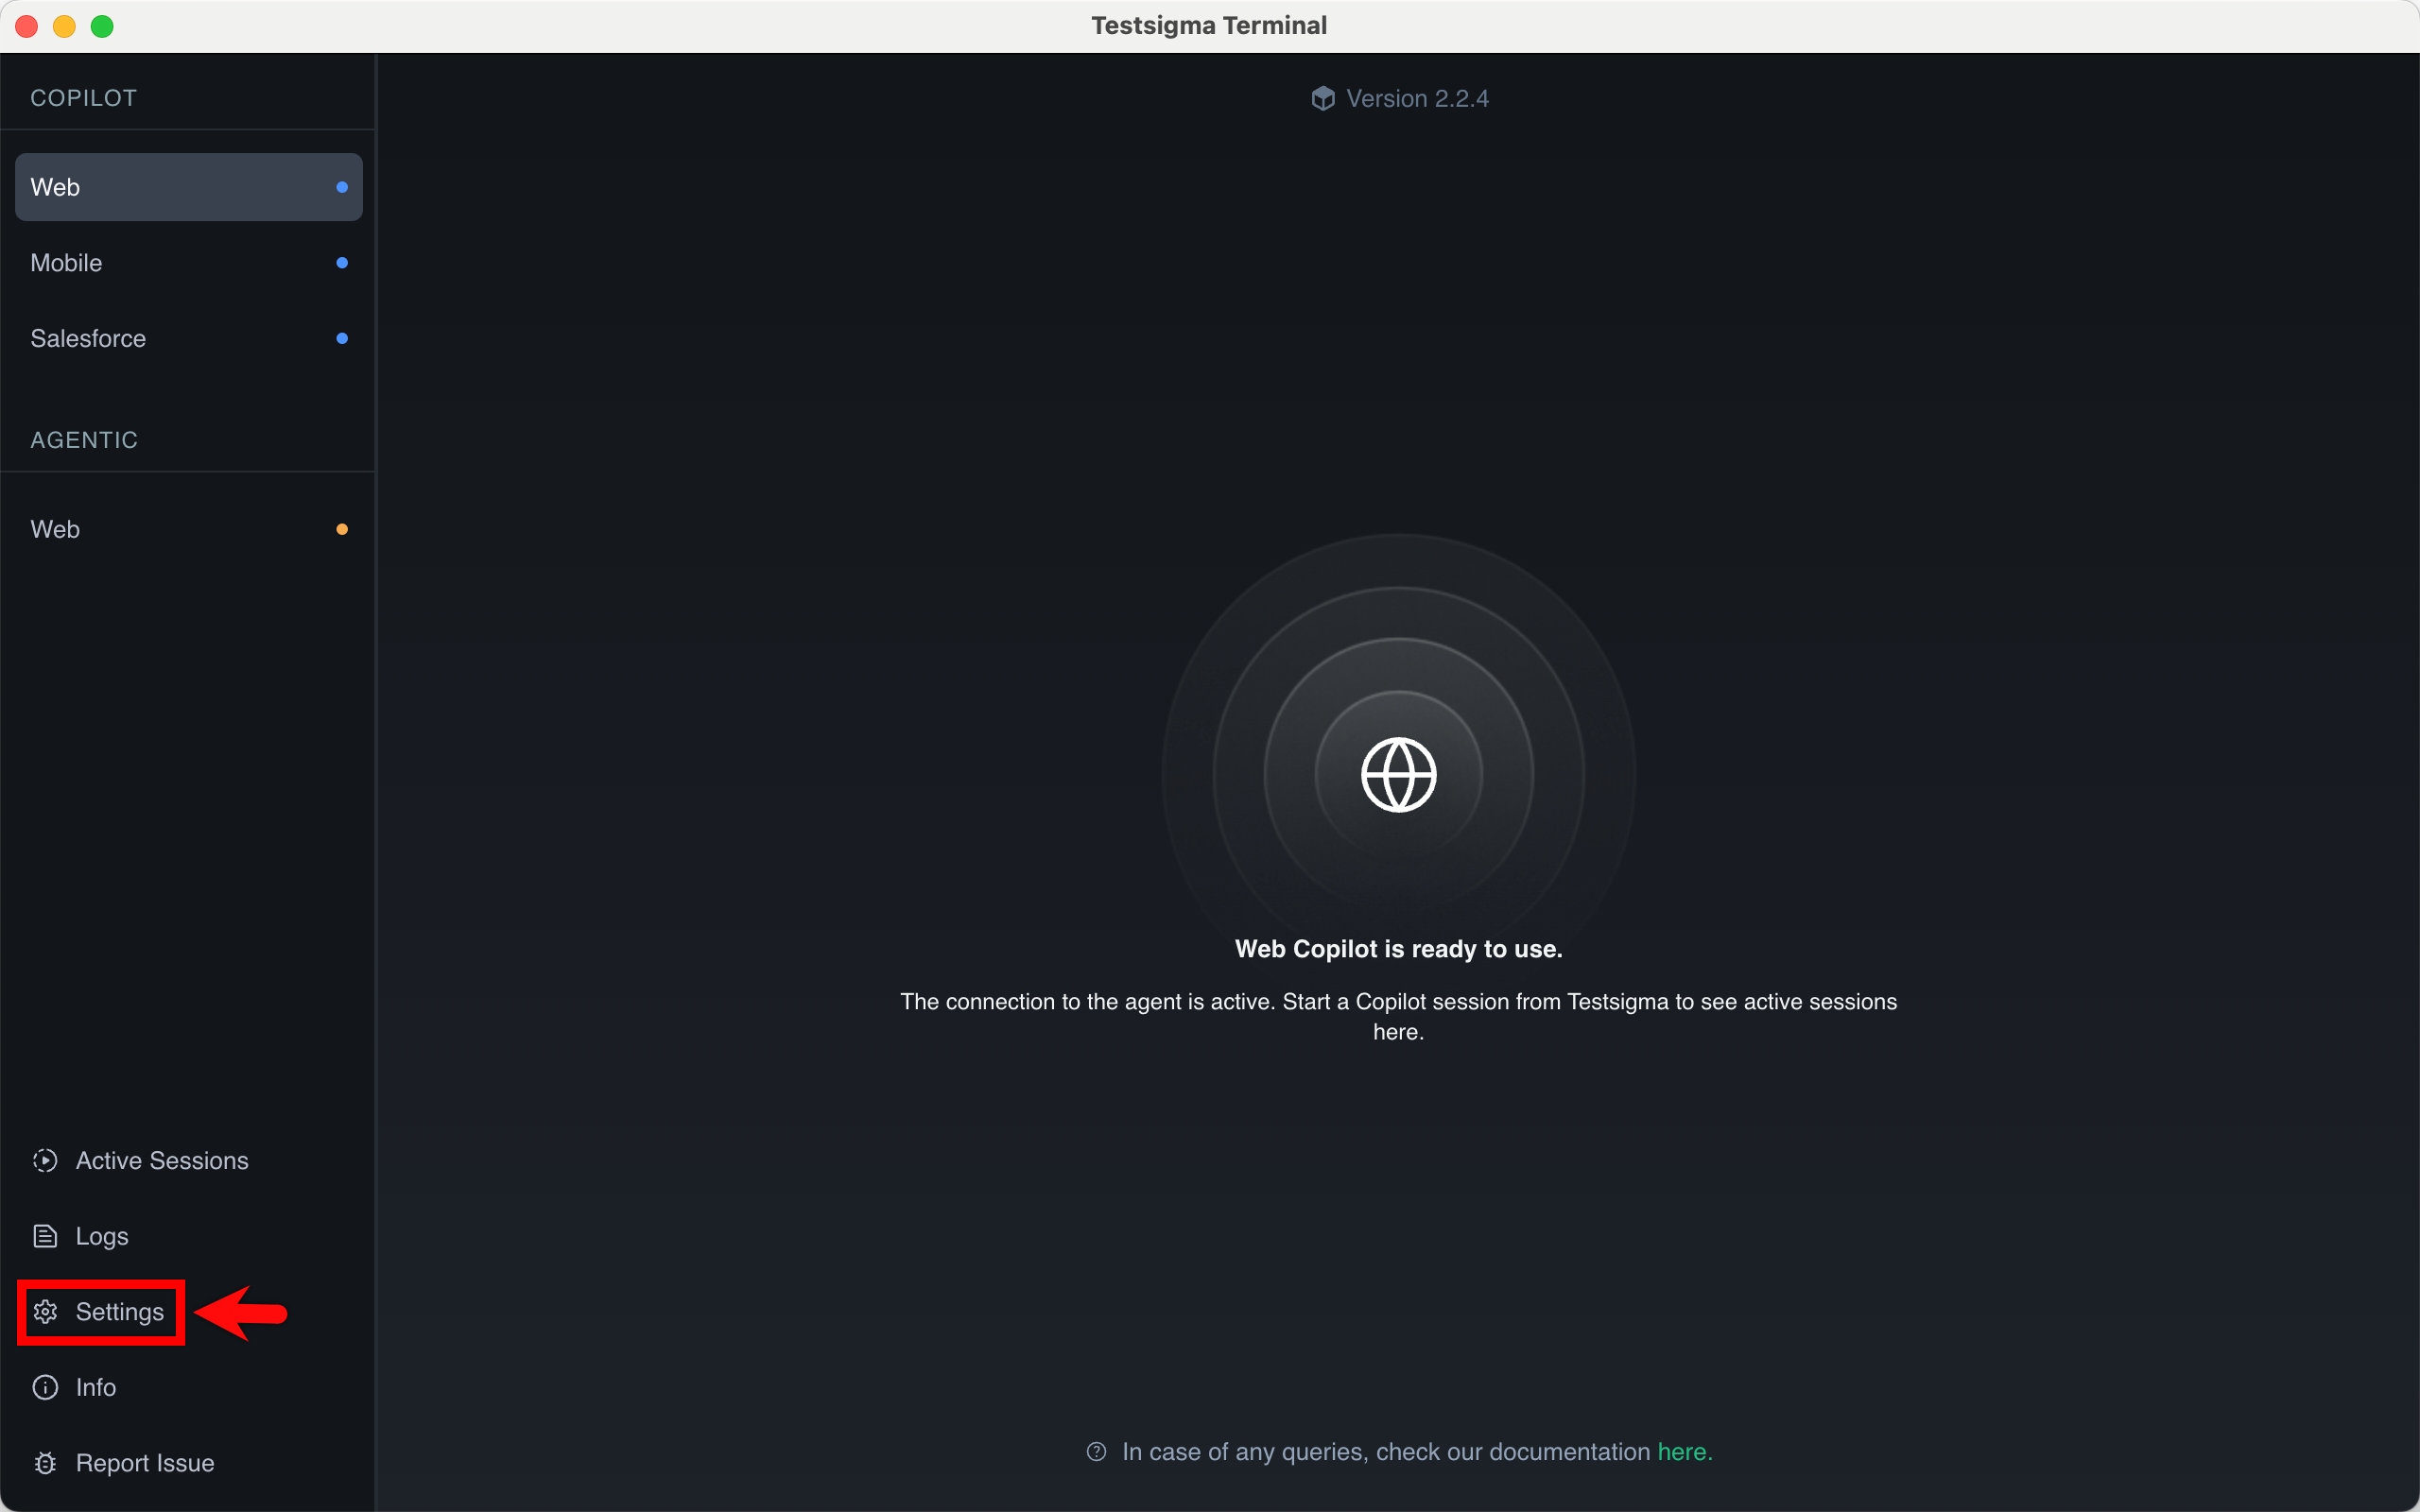
In the Terminal Settings page, you can perform the following actions:
-
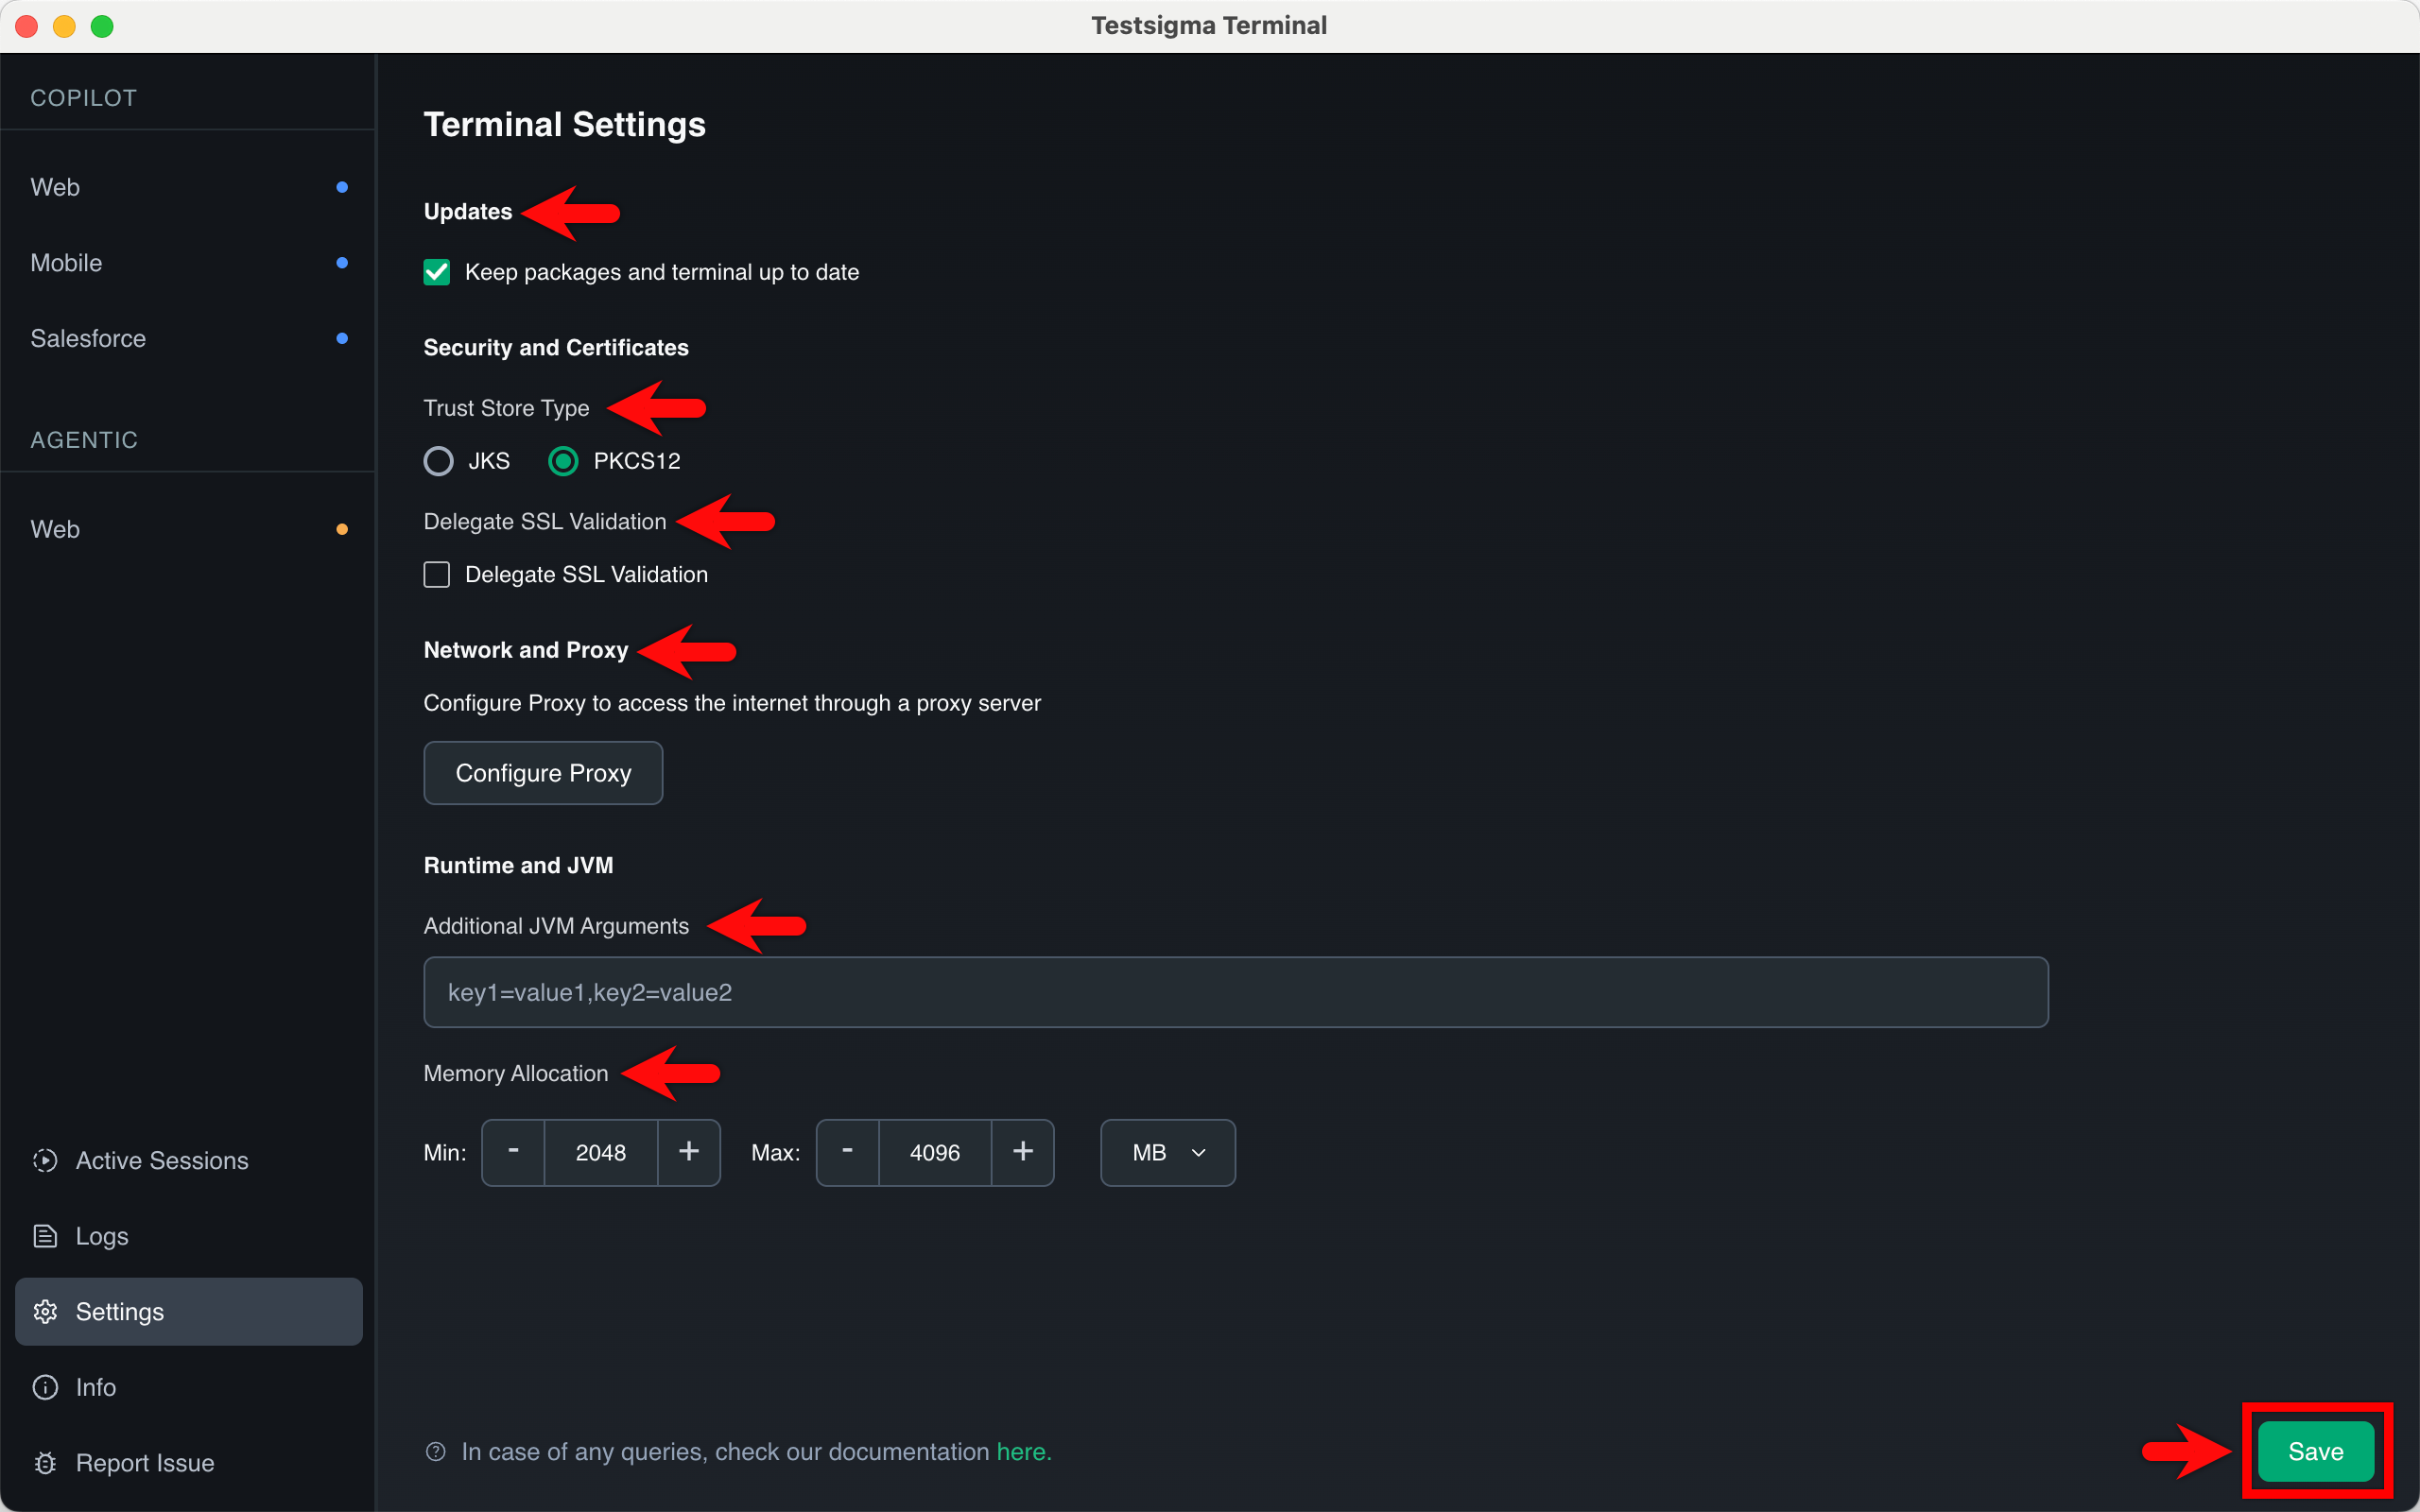
Updates
- Keep packages and terminal up to date: Select this checkbox to allow the Terminal to download required dependencies and application updates automatically.
-
Security and Certificates
- Trust Store Type: Select between JKS (Java KeyStore) or PKCS12 formats for managing security certificates.
- Delegate SSL Validation: Select the checkbox to manage how the Terminal validates SSL certificates during execution.
-
Network and Proxy Click Configure Proxy to define network rules for both HTTP and HTTPS traffic. For each protocol, you can specify:
- Proxy Host and Port: The address and port of your proxy server.
- Proxy User and Password: Credentials for authenticated proxy access.
- Non Proxy Hosts: Define specific addresses (e.g., localhost, 127.0.0.1) that should bypass the proxy server.
-
Runtime and JVM
- Additional JVM Arguments: Pass custom parameters to the Java Virtual Machine using key-value pairs (e.g., key1=value1).
- Memory Allocation: Manually define the Min and Max memory limits to optimize Terminal performance based on your system hardware.
- Flexible Units: Use the dropdown menu to specify these memory values in either MB or GB.
Once you have configured the settings, click Save.
-
- Click Info to view the information about the Terminal.
-
If you encounter issues with Testsigma Terminal, click Report Issue from the left panel.
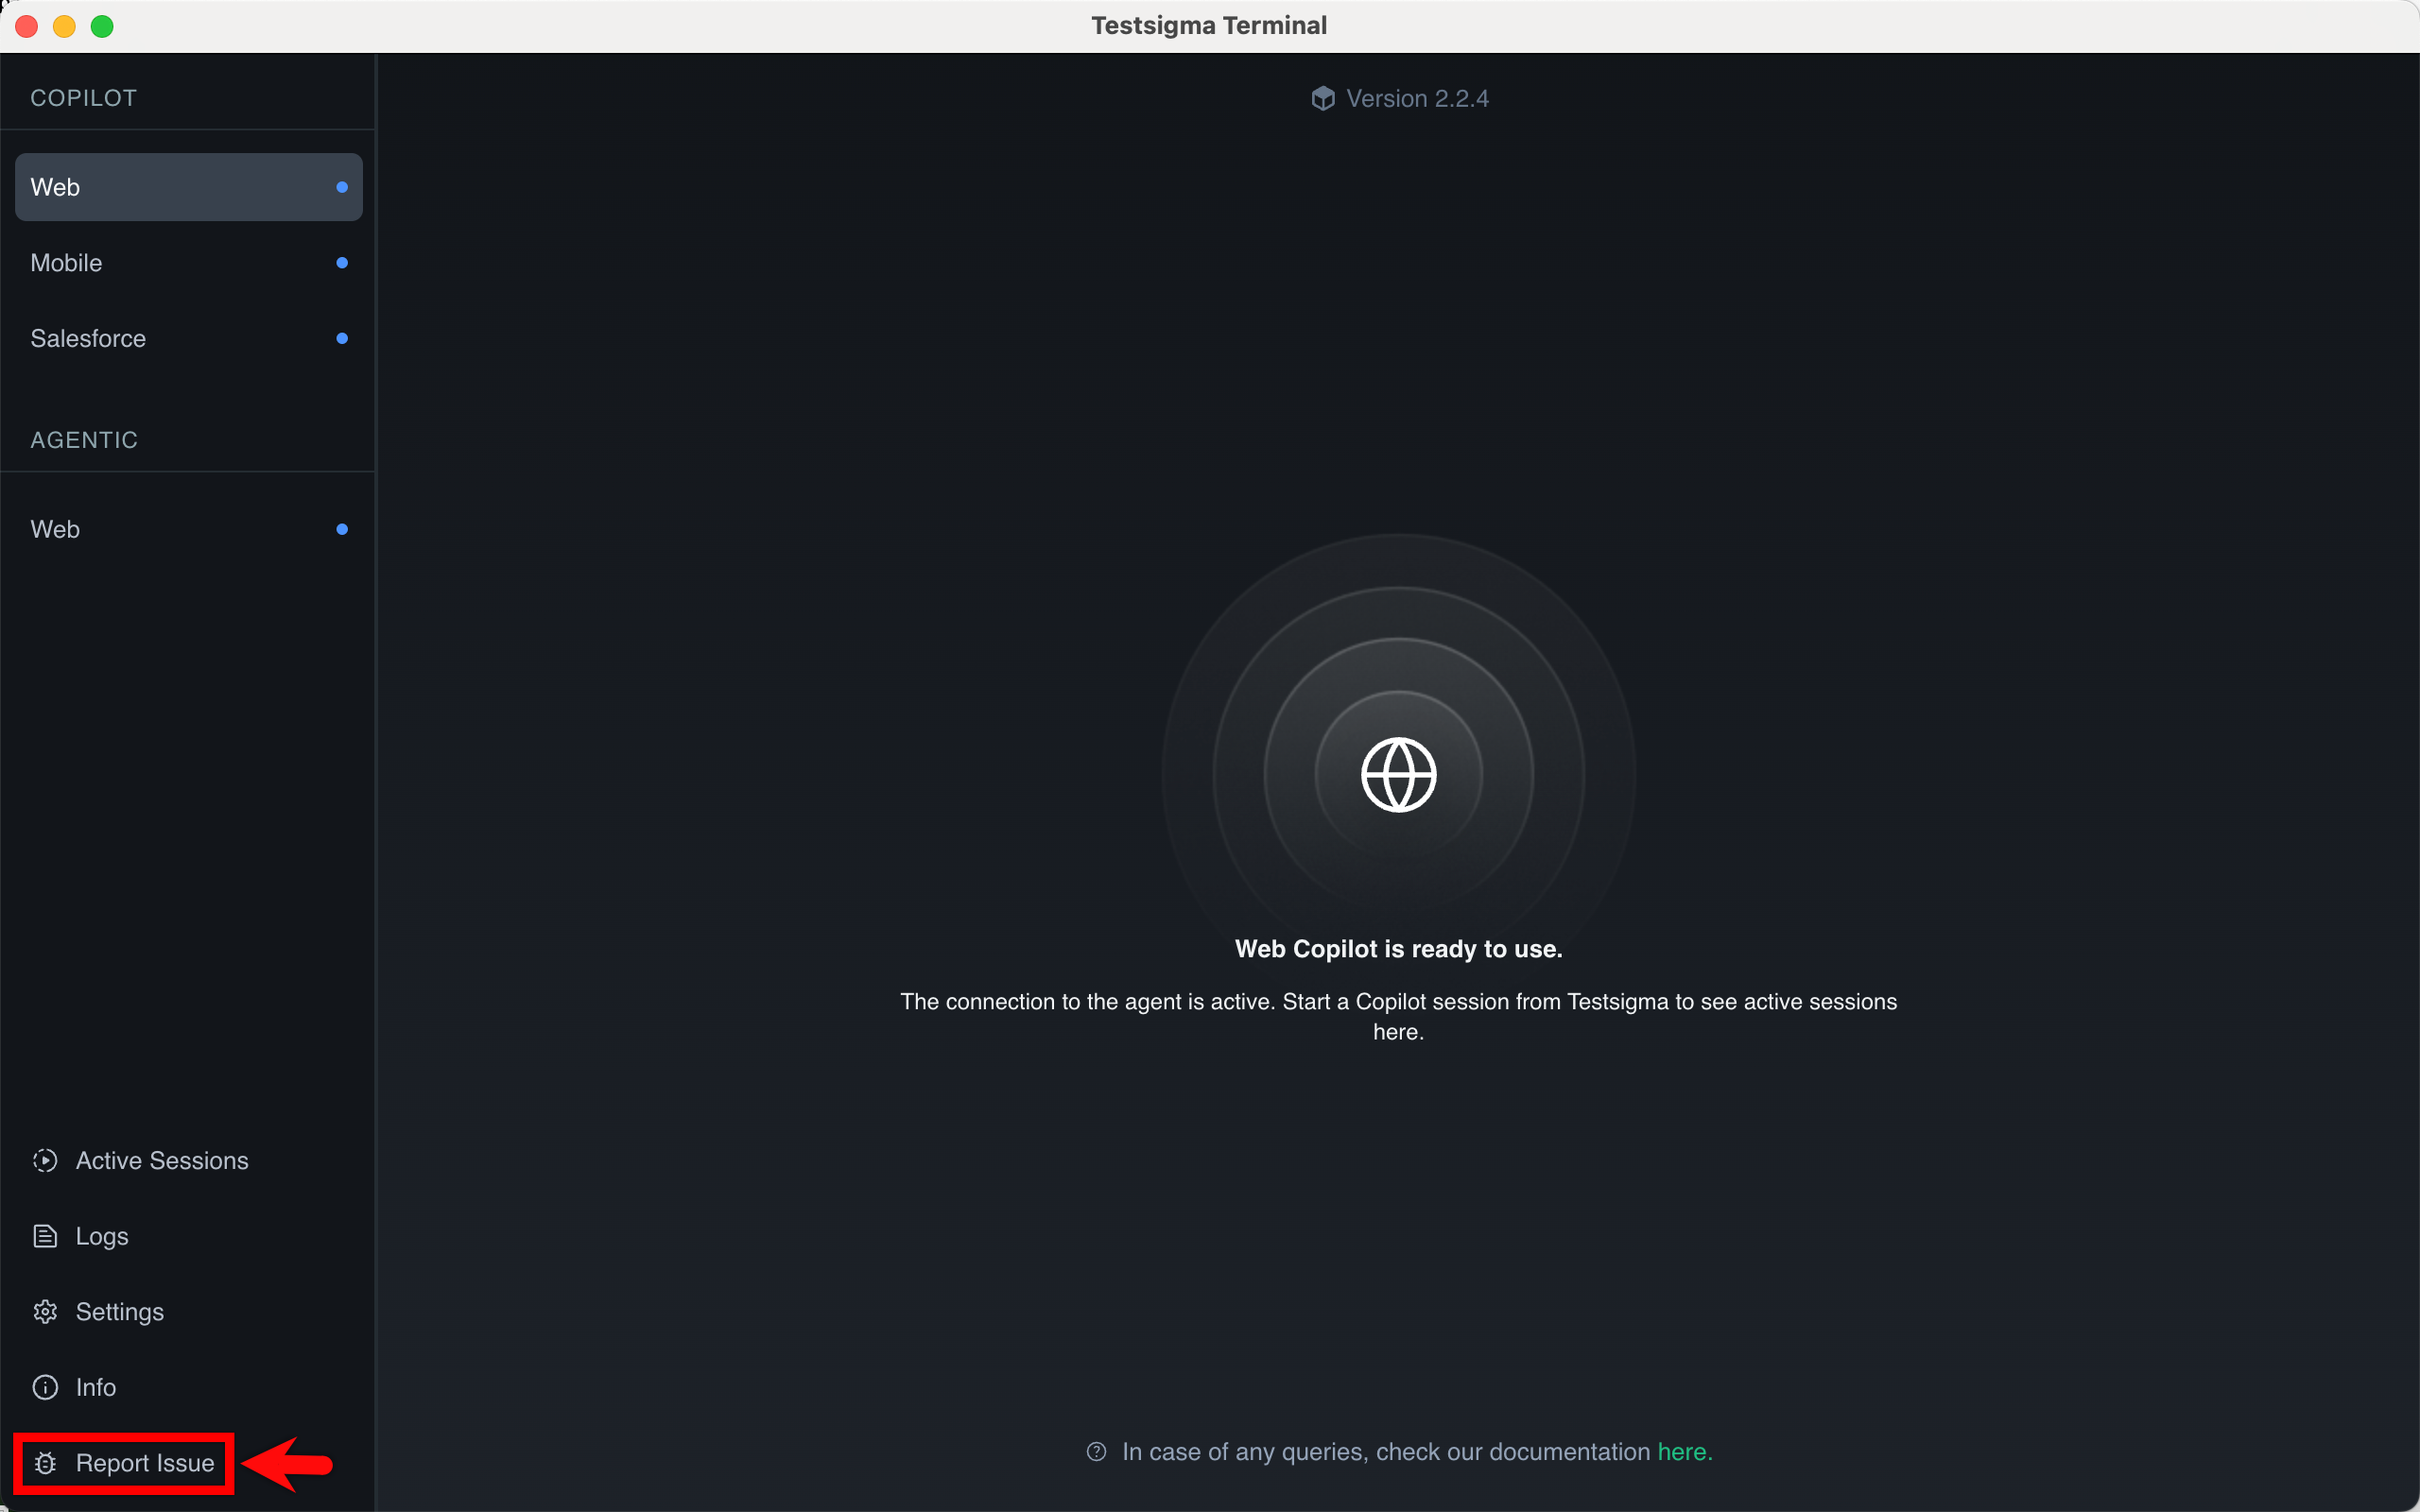
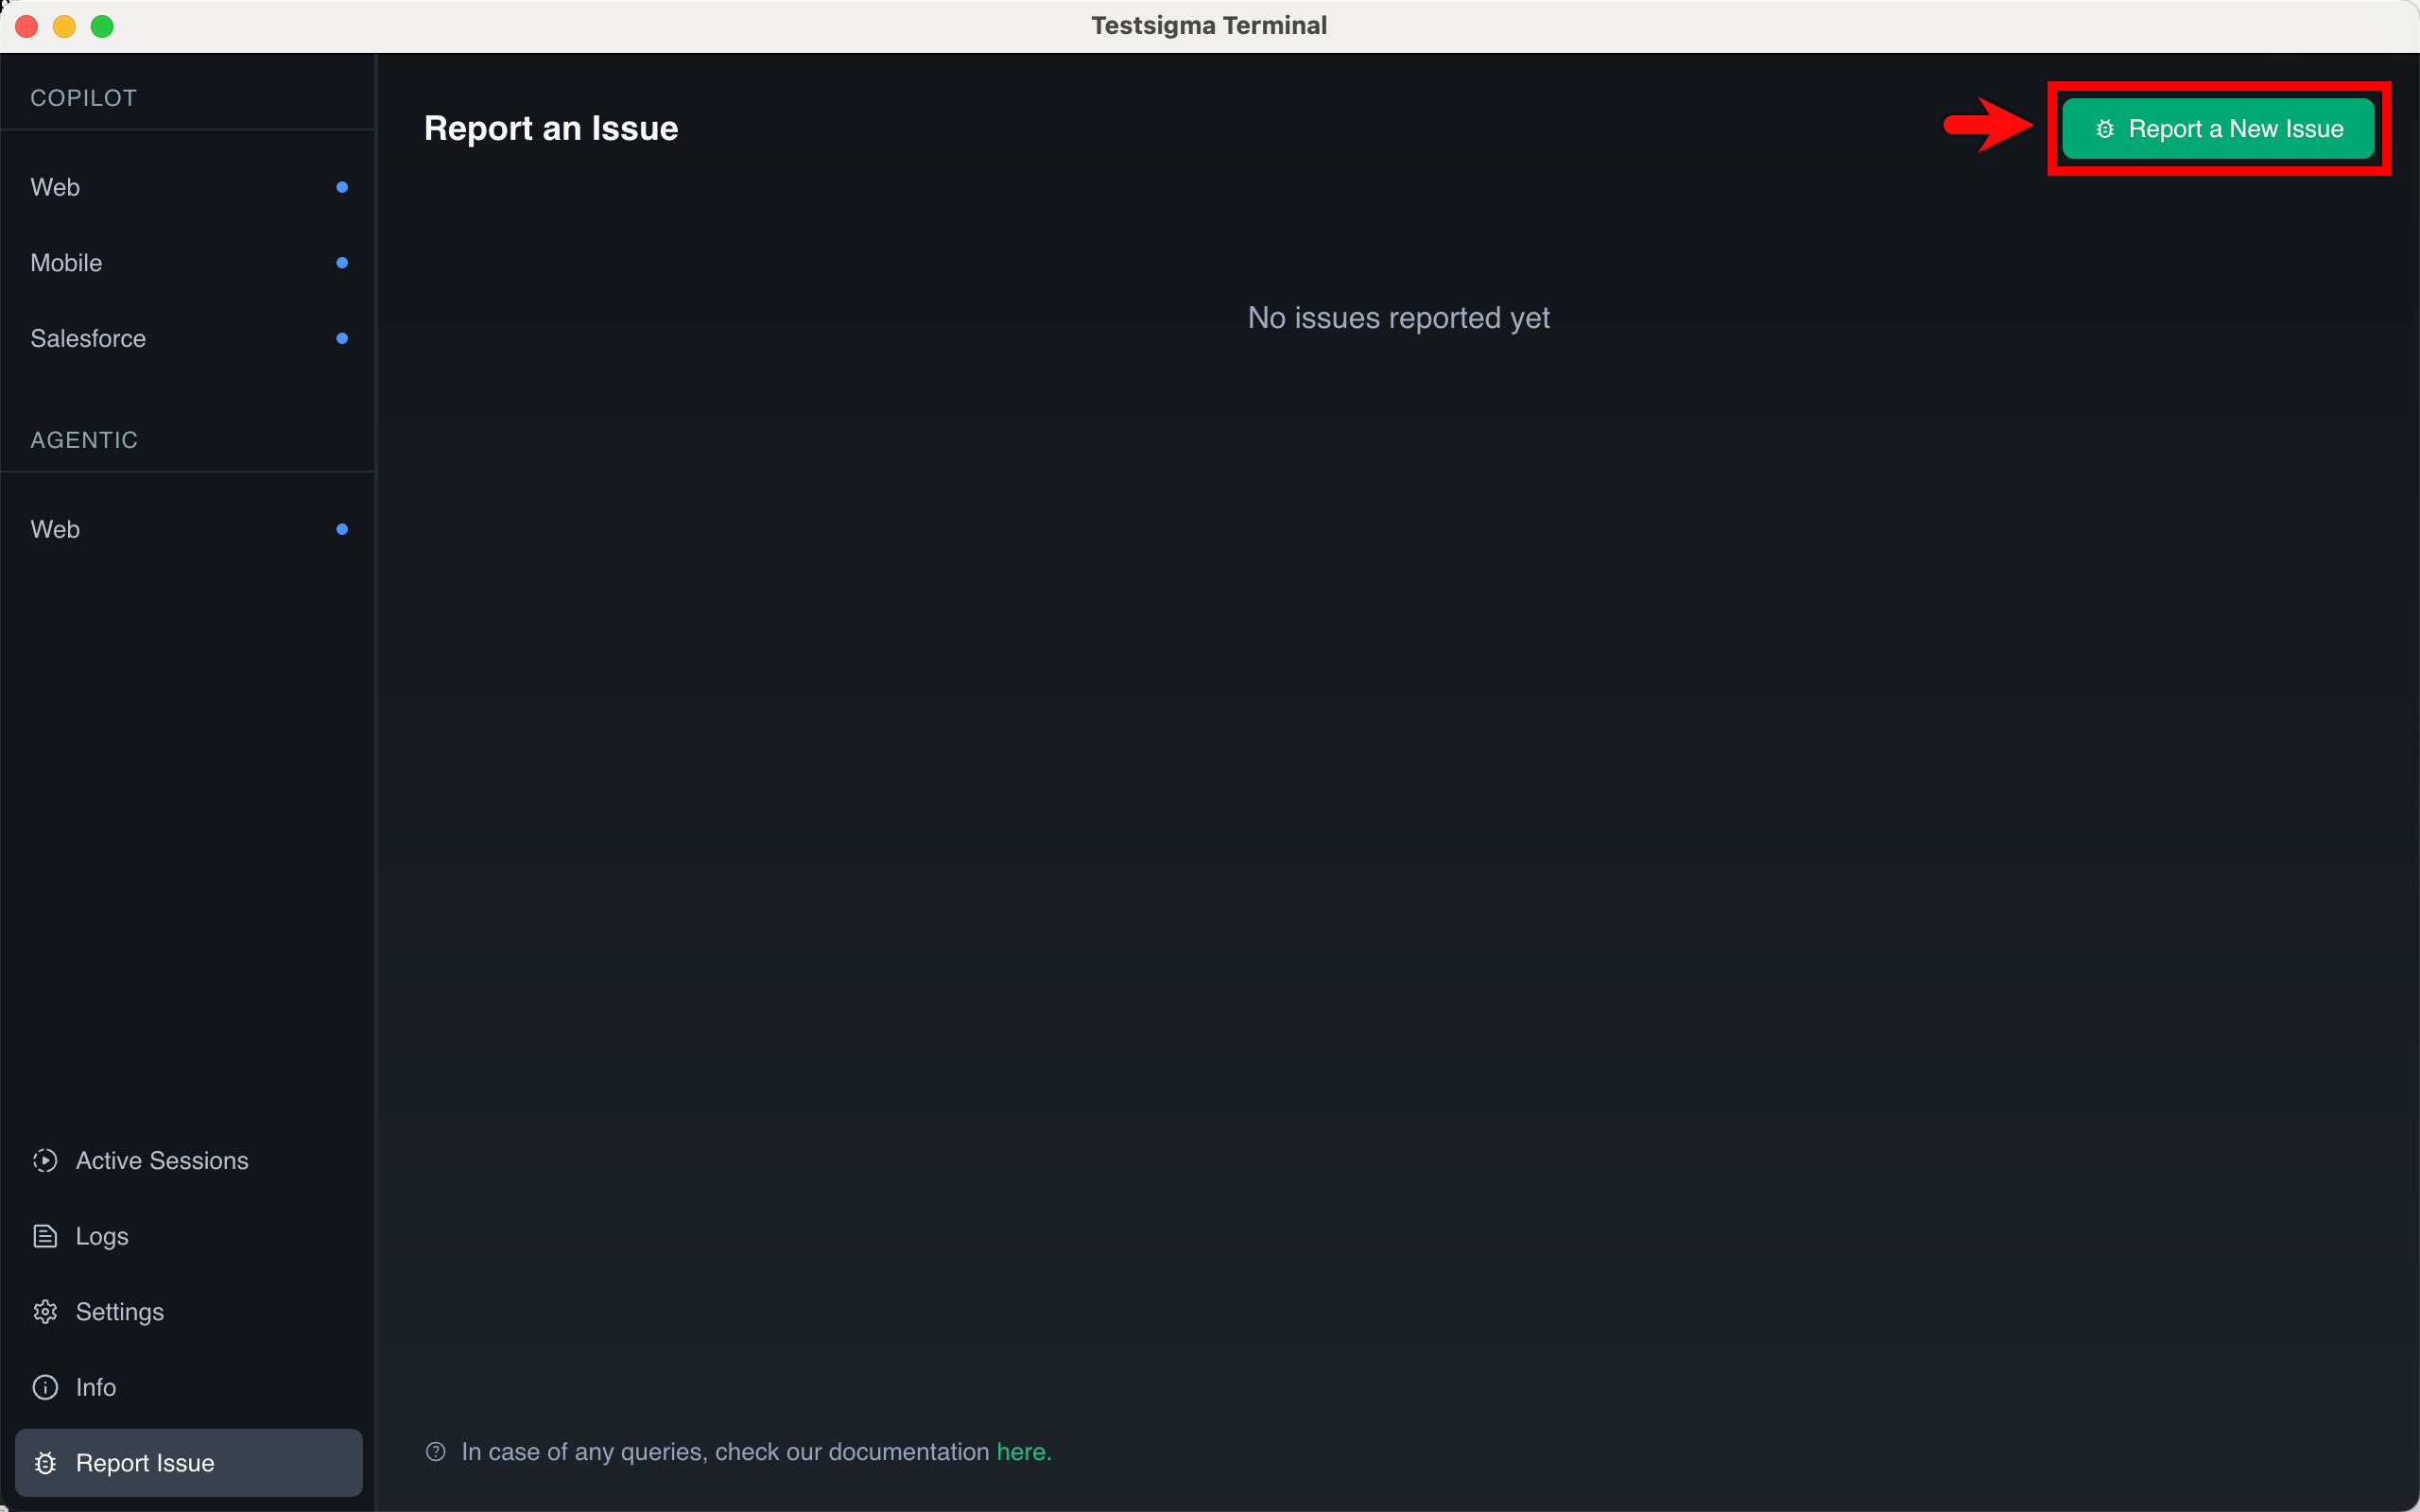
- On the Report an Issue page, click Report a New Issue.
- Enter a title and description.
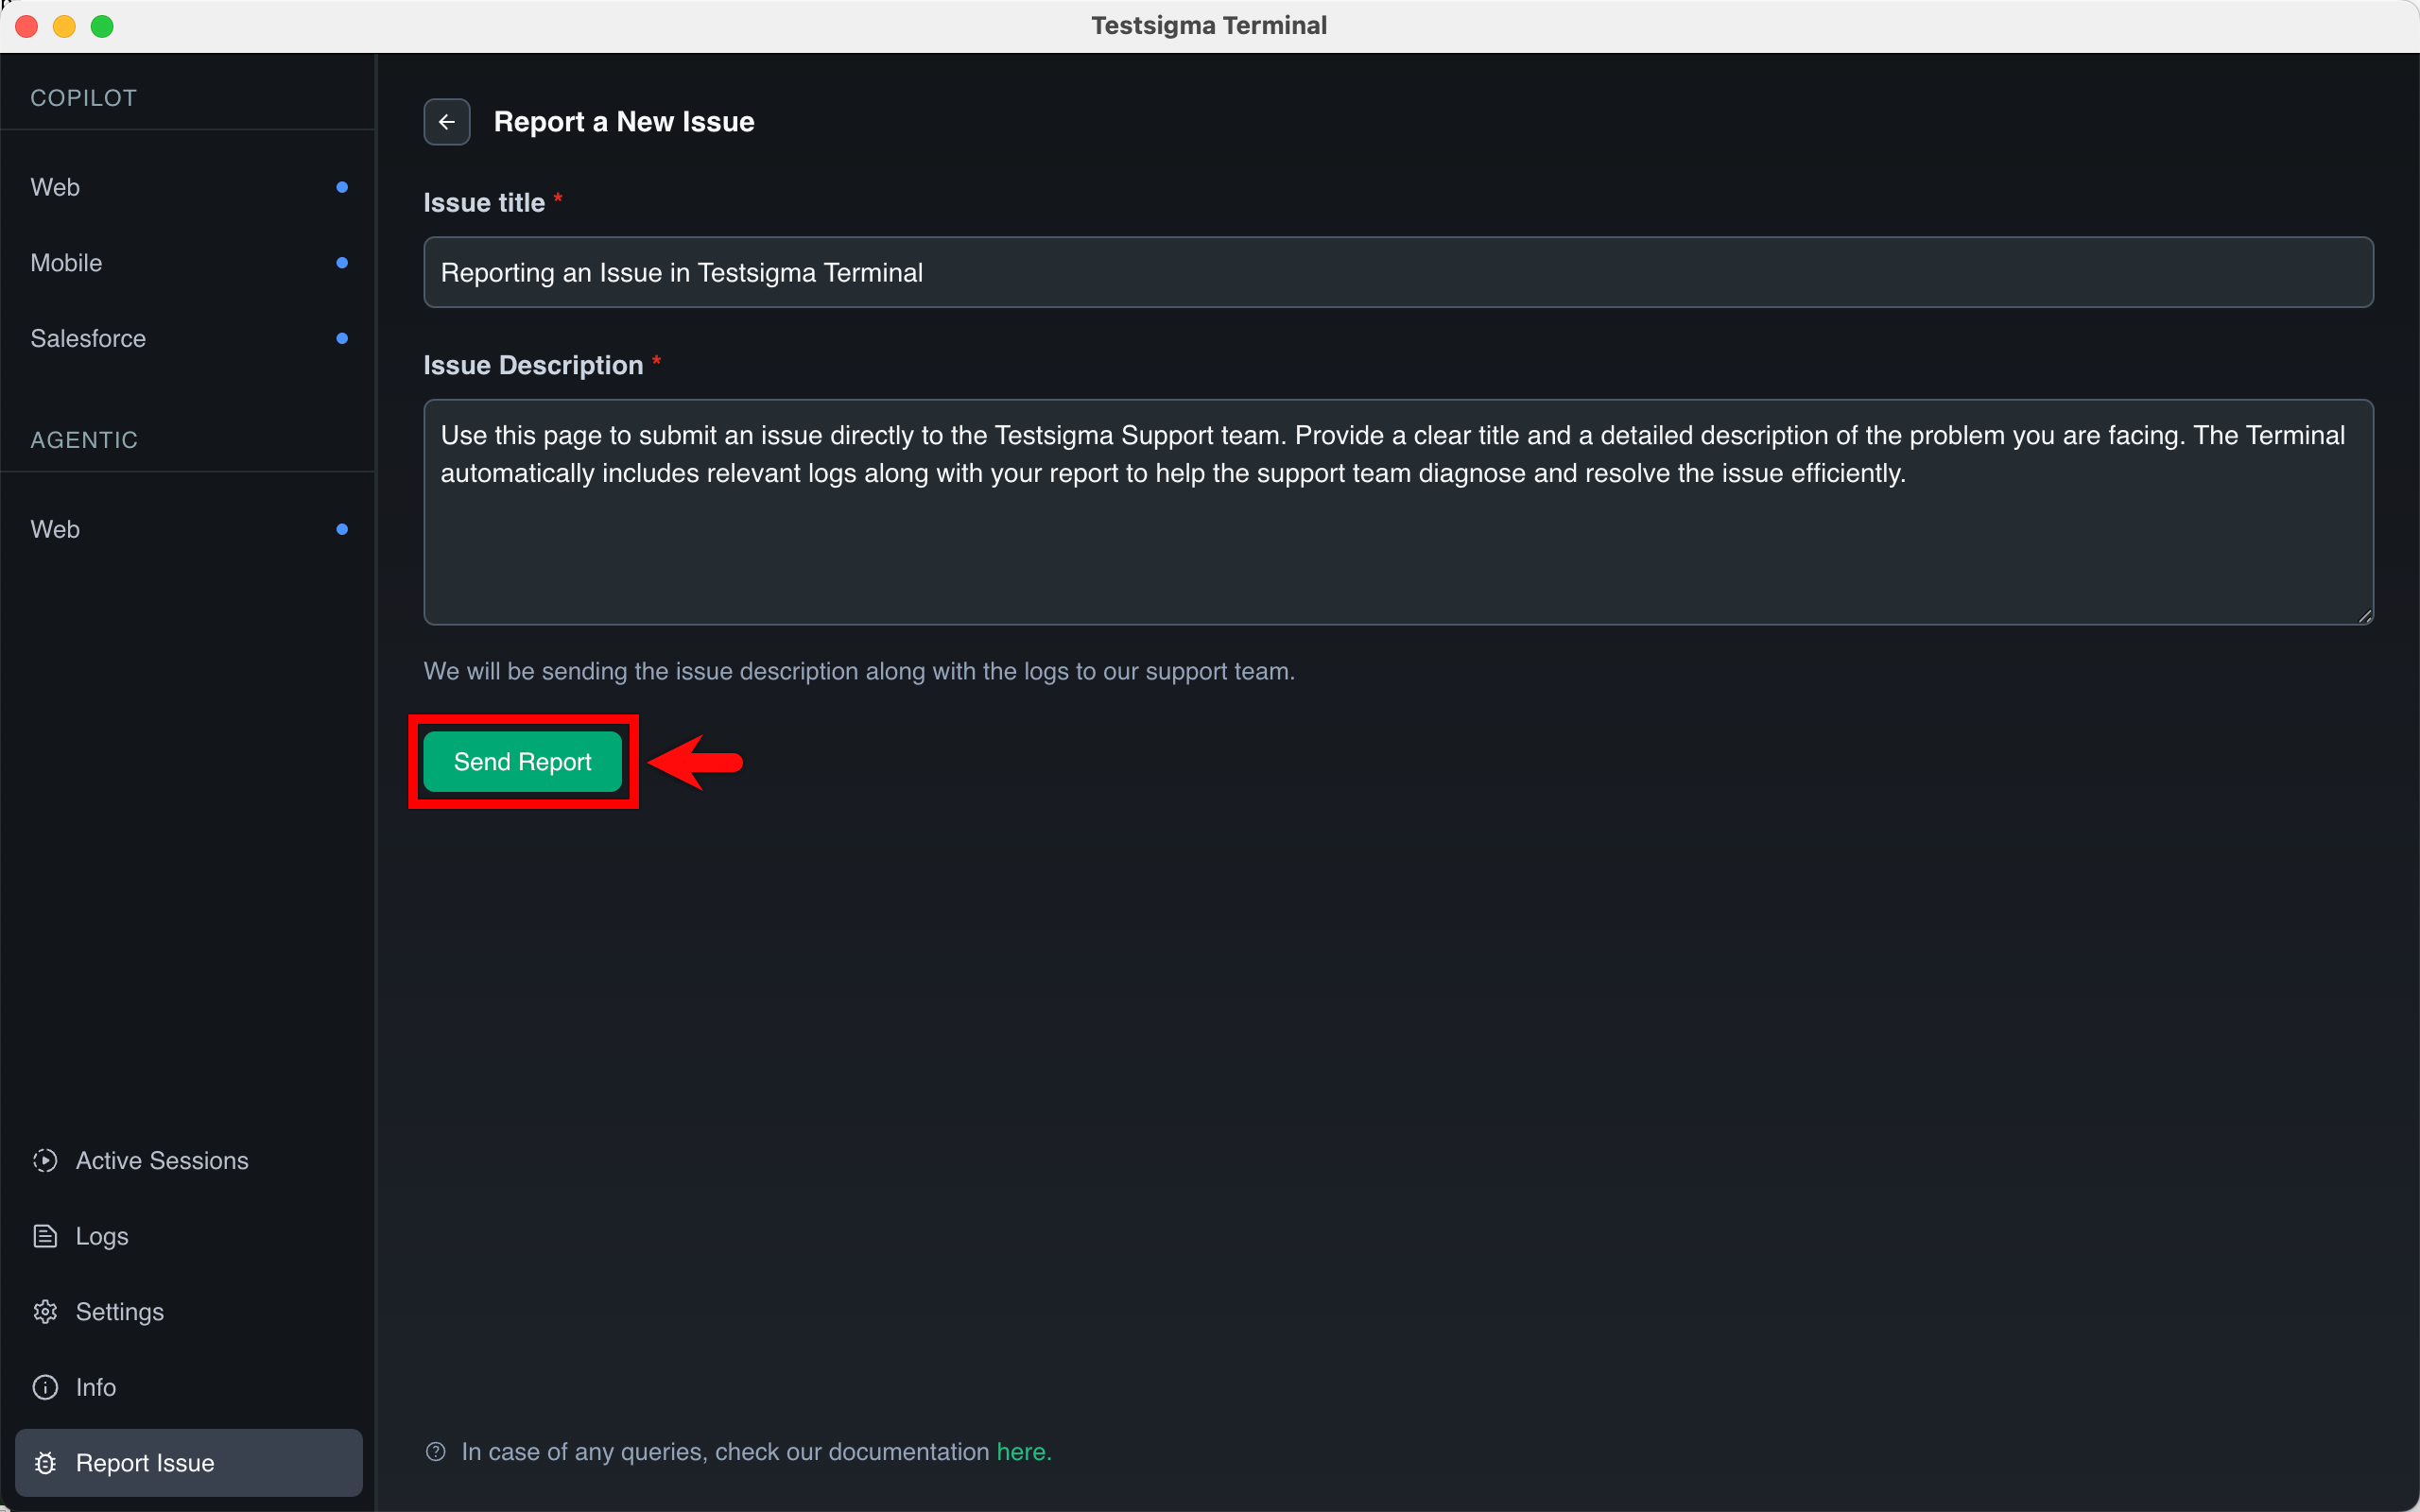
- Click Send Report.

- On the Report an Issue page, click Report a New Issue.
When you report an issue, the relevant logs are automatically attached for easier troubleshooting.
Want to contribute or report missing content?