What is Release Confidence Scoring and Why QA Teams Need it

Release confidence scoring shows when a build is truly ready. Testsigma helps QA teams spot weak coverage, flaky tests, and release risk faster.

Praveen Vishal
Written by
Nagasai Krishna Javvadi
Reviewed by
Nagasai Krishna Javvadi
reviewed-by-icon
Testers Verified
Last update: 27 Jul 2026
HomeBlogWhat is Release Confidence Scoring and Why QA Teams Need It

Key Takeaways

  • Release confidence scoring measures how production-ready a release is before deployment.
  • It combines test, defect, environment, and risk signals into one score.
  • Green tests alone can hide weak coverage, missed critical paths, and flaky-test noise.
  • The 5 core signals are test coverage, defect trends, environment stability, risk-based assessment, and regression pass rate/flaky test ratio.
  • The goal is a clearer go/no-go release decision, not a perfect score.

Before a release goes live, teams usually ask one question: Are we confident enough to ship?

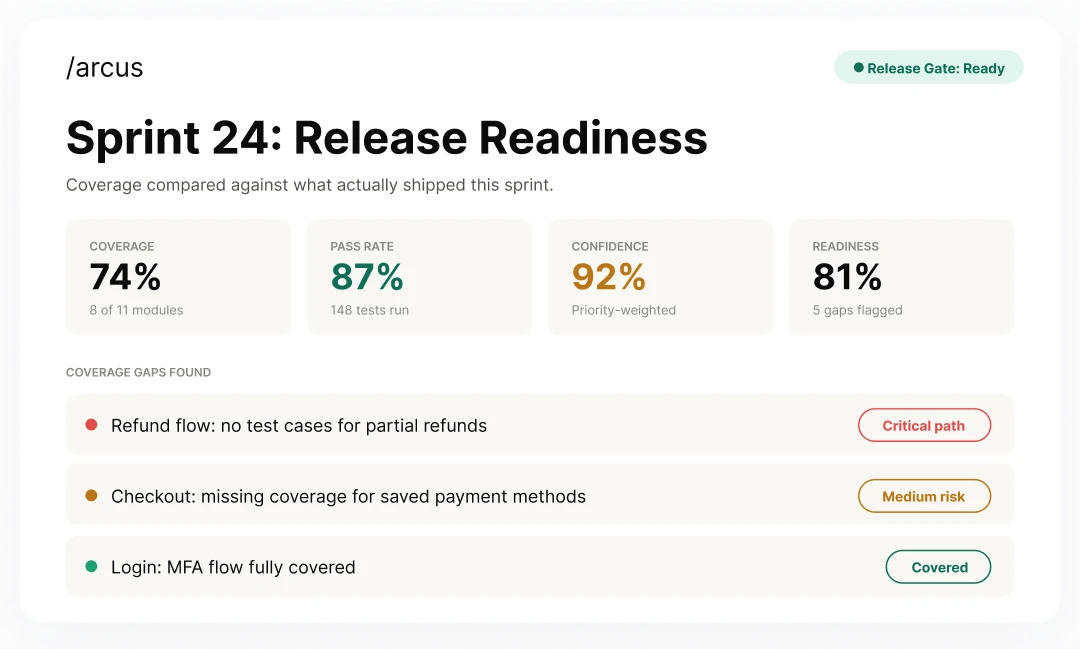
A release confidence score gives that answer in a measurable way. It shows how production-ready a software release is before deployment by combining test coverage, defect trends, environment stability, and regression results into one score. This gives QA and engineering teams a clearer basis for go/no-go release decisions.

What is Release Confidence Scoring?

Release confidence scoring is a way to measure release readiness before production. Instead of asking whether tests passed, it asks a sharper question.

How much risk is still sitting inside this release?

That risk can come from many places. A new checkout flow may have decent unit coverage but weak end-to-end coverage.

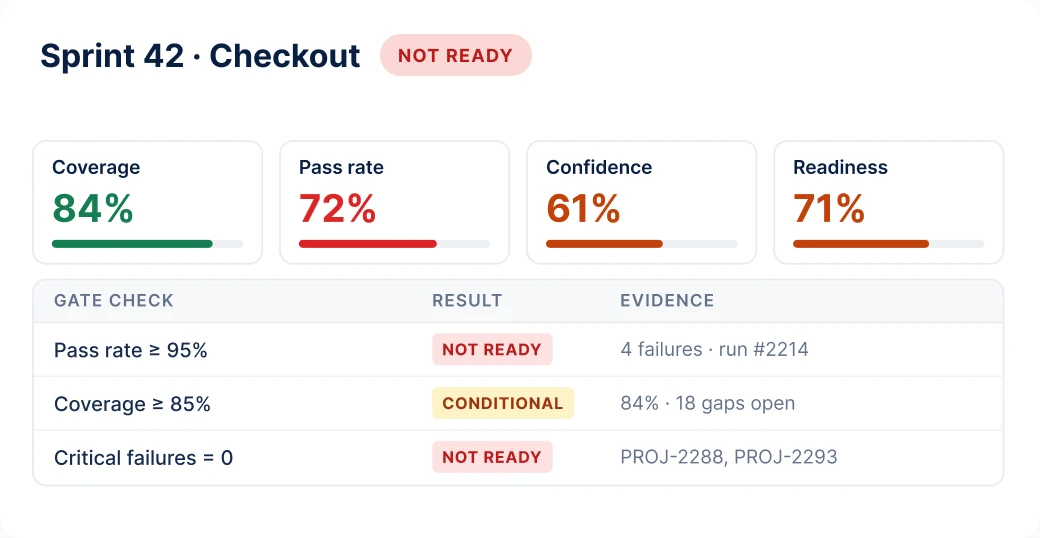
A staging environment may pass tests but behave differently from production. A regression suite may show 95% passed, while the remaining failures sit inside a business-critical workflow.

That is why a release confidence score looks at more than one signal. It combines testing data, defect patterns, environment health, change risk, and regression stability into a single view of release readiness.

Here’s where it helps:

  • QA teams can see whether test coverage is strong enough for the changed areas.
  • DevOps teams can decide whether a release should continue, be stopped, or need additional validation.
  • Engineering managers can make release decisions with data instead of gut feel.

The score does not replace human judgment. It gives the judgment better inputs.

Think of it as a release readiness assessment that sits between “all tests passed” and “we are safe to ship.” It helps teams catch weak signals before they become production incidents.

A high score means the release has enough evidence behind it. A low score means the team should look closer before pushing it live.

Why Are All Tests Passing Not Enough?

Green tests are useful. They are just not the same as releasing confidence.

A test suite can pass because it checked what it was designed to check. That does not mean it checked every workflow, data path, device, browser, integration, or edge case that can break after deployment.

The Gap between Test Coverage and Production Readiness

Release risk often sits outside the happy path. That gap usually shows up in a few places:

  • Test coverage can be outdated when the suite still reflects older workflows
  • Coverage can be too thin; unit tests pass, user journeys are untested
  • Passing tests doesn’t guarantee real user behavior across devices, browsers, APIs, and data states
  • Critical edge cases can be hidden until production traffic reveals them
  • Test debt and flaky tests can make weak signals look stronger than they are

A flaky test that passes after three retries is not a clean signal. It is noise pretending to be confidence.

That is why a production readiness review, or PRR, should look beyond pass/fail status. It should ask whether the release has enough validation across coverage, defects, environments, and risk.

Real-World Cost of Shipping Blind

The damage usually shows up after the release.

A payment update passes automated tests, but fails in production because gateway latency was never tested. A permissions change clears unit tests, but breaks admin access for a subset of users. A mobile release passes regression, but crashes on an OS version the suite did not cover.

In each case, the problem was not that testing failed completely. The problem was that the signals were incomplete.

Release confidence scoring gives teams a better way to make the go/no-go release decision before customers find the gap.

The 5 Core Signals in a Release Confidence Score

A good release confidence score does not depend on one metric. That is where teams get misled.

You need a mix of signals that show what was tested, what failed, what changed, and how stable the release path looks.

Test Coverage

Test coverage shows how much of the product is covered by automated or manual checks. But the useful question is not just “how much code is covered?”

The better question is this: Are the right workflows covered for this release?

Look at coverage across the layers that matter:

  • Unit tests for small pieces of logic
  • Integration tests for APIs, services, and connected systems
  • End-to-end tests for real user workflows

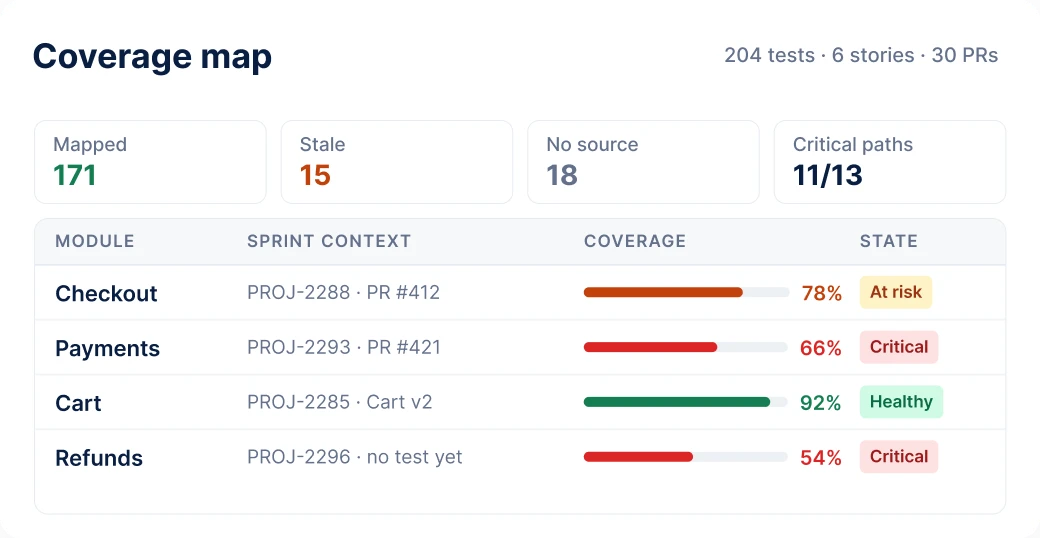
Strong test coverage metrics should reflect the changed areas in the release. If a checkout update ships with strong profile-page coverage but weak payment-flow coverage, the score should drop.

Defect Trend Analysis

Defect trends show whether the release is getting healthier or riskier as it moves toward production. A few open low-priority bugs may not block a release.

But rising blocker defects, reopened issues, and late-sprint failures tell a different story.

Here’s where it helps. If defects keep appearing in the same module, the release needs deeper validation there. You see fewer critical issues open as defects reduce and confidence improves.

Environment Stability

Environment parity means your test or staging environment closely matches production. The closer they are, the more trustworthy your results become.

Environment drift is the opposite. It happens when staging data, configs, services, browsers, devices, or dependencies move away from production.

That drift can turn clean test results into false confidence.

Risk-Based Assessment

Risk-based testing means testing more deeply where the release can hurt the business the most.

A small UI text change should not carry the same weight as a payment, login, permissions, security, or data migration change. The larger the change in surface area, the stronger the validation should be.

This is where release confidence scoring becomes practical. It helps teams weigh risk instead of treating every release like the same kind of work.

Regression Pass Rate and Flaky Test Ratio

Regression testing checks whether new changes have broken existing functionality.

A strong regression pass rate usually increases confidence. But only if the tests are stable.

A flaky test gives inconsistent results without a clear product change. It may pass once, fail once, then pass again after a retry. That makes the flaky test rate a serious confidence signal, not a side issue.

If flaky tests keep passing after retries, the release may look safer than it is.

Reduce flaky tests and improve release signals with Testsigma’s AI-powered test automation.

Reduce flaky tests and improve release signals with Testsigma’s AI-powered test automation.

Start Testing

How to Build a Release Confidence Scorecard in 5 Steps

A release confidence scorecard turns scattered quality signals into one view. It gives QA, DevOps, and engineering leaders a shared way to judge release readiness before the final call.

The goal is not to make the score perfect. The goal is to make the release risk visible.

Step-by-step Scorecard Construction

Start simple. A scorecard should be clear enough to review during a release readiness assessment, not so complex that nobody trusts it.

Build it in five steps:

  1. Pick the signals that matter for the release
  2. Assign a weight to each signal based on risk
  3. Set thresholds for yellow, green, and red
  4. Extract data from test runs, defects, CI/CD, and environments
  5. Review the score before the go/no-go decision

This works best when the scorecard connects to your release readiness checklist. That way, teams are not scoring in isolation. They are checking confidence against the same items they already reviewed before production.

Weighting Signals by Risk

Every release should not use the same scoring model.

A small UI copy change may need a lighter testing weight. A security patch may need more weight on risk, open defects, and production parity.

The trade-off is simple. Equal weights are easier to manage, but risk-based weights give a more honest view of the release.

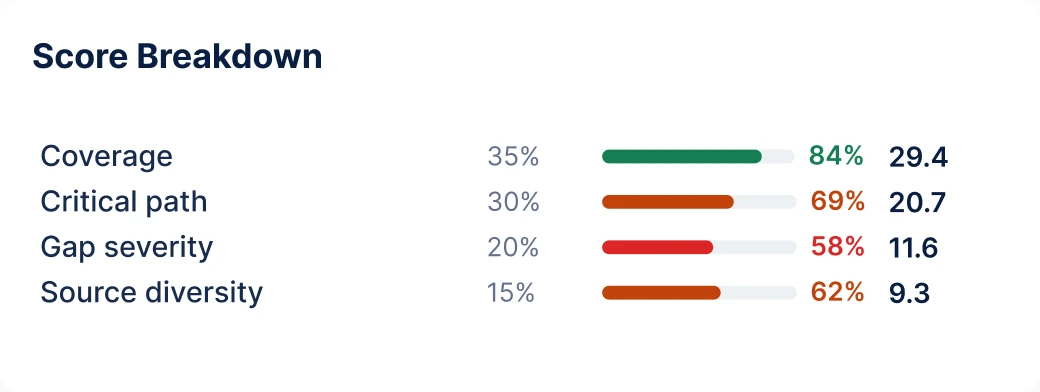
Sample Release Confidence Scorecard

SignalWeightGreen ThresholdRed Threshold
Test coverage metrics20%85%+ critical-flow coverageBelow 70% critical-flow coverage
Defect trend analysis20%No blocker or critical defects openAny blocker or rising critical defects
Environment stability15%Stable environment with production parityFrequent failures or known environment drift
Risk-based assessment20%Low-risk change surface areaHigh-risk changes without added validation
Regression pass rate15%95%+ regression pass rateBelow 85% regression pass rate
Flaky test ratio10%Below 5% flaky testsAbove 10% flaky tests

A scorecard like this keeps the release conversation grounded. Instead of asking, “Do we feel ready?” the team can ask, “Which signal is still weak?”

Release Confidence Score Vs. Dora Metrics: What’s the Difference?

DORA metrics and release confidence scoring are connected, but they answer different questions.

DORA metrics show how healthy your software delivery process is over time. A release confidence score shows whether this specific release is ready to go out now.

That difference matters.

DORA looks at delivery performance through four metrics:

  • Deployment frequency: How often your team successfully deploys to production
  • Lead Time for changes: How long does it take a code change to reach production
  • Change failure rate: How often deployments cause production failures
  • MTTR: How quickly the team restores service after a failure

These are useful software release quality metrics, especially for engineering leaders tracking delivery health. But they do not always tell a QA lead whether today’s release is safe.

A team can have strong deployment frequency and still ship a risky build. A team can recover quickly from failures and still miss a weak regression signal before release.

Here’s the cleaner way to separate them:

Release confidence scoreDORA metrics
Measures readiness before releaseMeasures delivery performance over time
Supports go/no-go release decisionsSupports DevOps process improvement
Focuses on tests, defects, environments, and riskFocuses on deployment frequency, lead time, CFR, and MTTR
Helps QA and engineering teams assess current release riskHelps leaders assess long-term delivery health
Works as a release readiness assessmentWorks as a delivery performance benchmark

DORA tells you how well your release engine runs. Release confidence scoring tells you whether this release should leave the garage.

Automating Release Confidence Scoring in CI/CD

Manual scorecards help. Automated scorecards scale better.

Once the signals are clear, teams can pull them into the CI/CD pipeline so that release confidence is checked before production, not after something breaks.

Where to Inject RCs Checks in the Pipeline

A CI/CD pipeline moves code from commit to build, test, staging, and deployment. Release confidence checks should sit where they can still stop risky work.

The best places are usually:

  • After unit and integration tests finish
  • Before deployment to staging
  • After regression testing is complete
  • Before production approval
  • Before progressive delivery or canary releases begin

This also supports shift-left testing. Teams catch weak coverage, unstable tests, and risky changes earlier instead of waiting for the final release meeting.

Integrating with Test Management Platforms

A release confidence score becomes stronger when it connects to real testing data.

That can include test case coverage, execution results, defect status, regression pass rate, flaky test rate, and risk mapped to the sprint scope.

The score should not live in a spreadsheet that gets updated once a week. It should reflect the current release state.

Here’s where test management platforms help. They provide teams a single place to see what was tested, what failed, what changed, and what still needs attention.

Real-Time Dashboards Vs. Gate-Based Scoring

Dashboards are useful for teams that want visibility throughout the sprint. You see confidence rise and fall as tests are run, defects closed, and environments stabilized.

Gates are stricter. If the score is below an agreed threshold, they warn or stop the release.

The tradeoff is control. Dashboards guide decisions. Gates enforce them.

Build stronger release gates with AI-powered testing across web, mobile, API, and desktop with Testsigma.

Build stronger release gates with AI-powered testing across web, mobile, API, and desktop with Testsigma.

Book a demo

5 Common Pitfalls When Implementing Release Confidence Scoring

Release confidence scoring works only when the score reflects real risk. If the inputs are weak, the score becomes another dashboard number nobody trusts.

Over-Indexing on Code Coverage Percentage

High code coverage looks good in a report. It does not always mean the right things are tested.

A release can have strong coverage around low-risk code and weak coverage around payment, login, permissions, or data workflows. That should lower confidence.

Ignoring Environment Drift

Environment drift can make test results misleading.

Even with different configs in staging, stale data, missing services, and different conditions in the browser and device, may still cause tests to pass. Only to not behave the same way in production. The score should account for that gap.

Treating Flaky Tests As Passing

Flaky tests are not harmless. A test that fails once, passes twice, and clears after a retry still tells you something is unstable. Counting it as a clean pass makes the release look safer than it is.

Using the Same Weights for Every Release

A low-risk UI change and a payment integration release should not be scored the same way. The weighting should shift based on the change surface area, business risk, and the workflows touched.

Making the Scorecard Too Complex

Too many signals can slow teams down.

The scorecard should be simple enough for QA, DevOps, and engineering managers to use during release review. If nobody can explain the score quickly, it will not guide the decision.

How Testsigma Improves Your Release Confidence Score

Release confidence scoring gets stronger when the signals are current, reliable, and tied to the work happening in the sprint.

That is where Testsigma can help. Not by replacing your release judgment, but by improving the testing signals that feed the score.

Healer Agent Reduces Flaky Test Ratio

Flaky tests weaken release confidence fast.

Testsigma’s Healer Agent helps reduce false failures caused by locator changes and minor UI shifts. When tests can recover from small application changes, teams spend less time chasing noise and more time investigating real failures.

That improves the flaky test ratio signal.

Analyzer Agent Automates Defect Trend Analysis

A release confidence score needs more than pass/fail results. It needs patterns.

Testsigma’s Analyzer Agent helps teams understand recurring failures, defect clusters, and test result trends. That makes it easier to see whether quality is improving or whether the same risky areas keep breaking.

This supports defect trend analysis before the go/no-go call.

Sprint Planner Agent Maps Coverage to Sprint Risk

Coverage gaps are harder to spot when teams only look at total test counts.

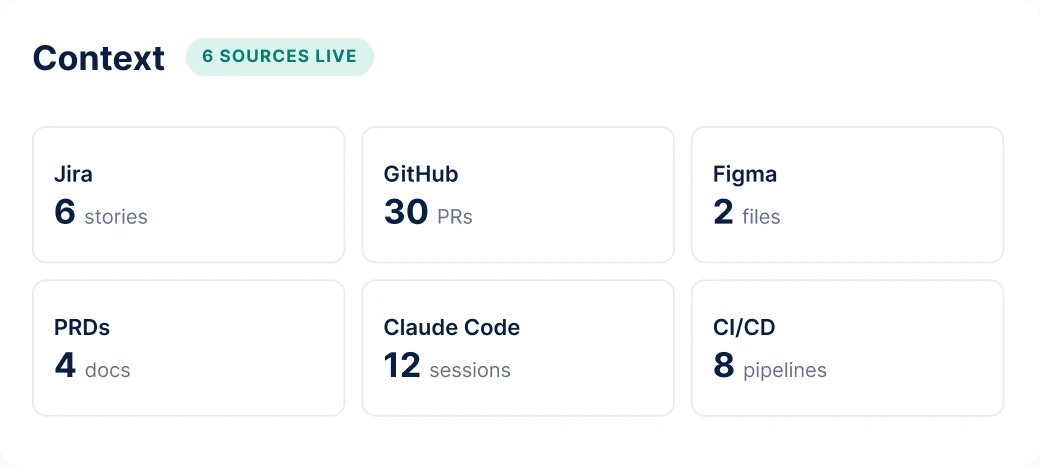
Testsigma’s Sprint Planner Agent helps connect the sprint scope with testing needs. If a release touches checkout, permissions, or API flows, teams can see where validation needs to be stronger.

That supports risk-based testing and better coverage planning.

Copilot Closes Coverage Gaps before Release

Sometimes the issue is simple. The right tests do not exist yet.

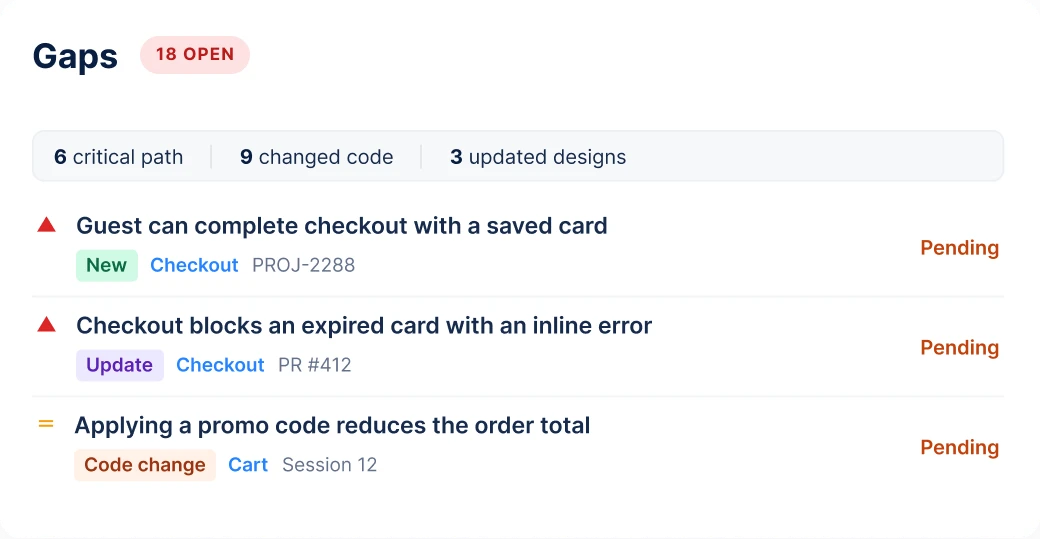
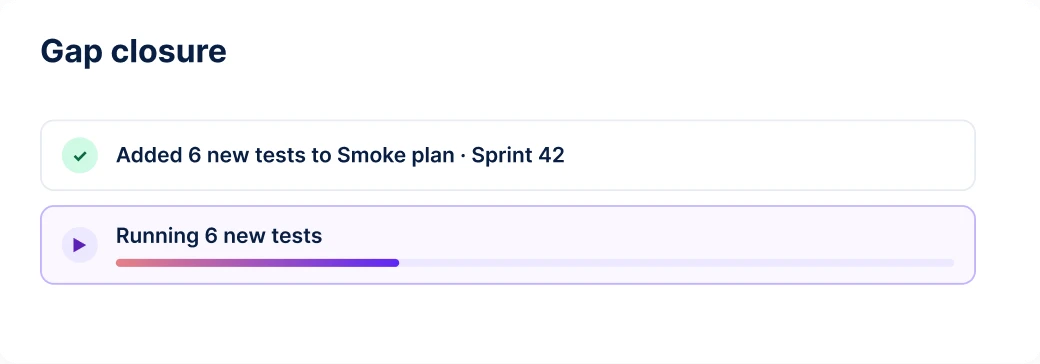
Testsigma Copilot helps teams create tests faster, which can close coverage gaps before production. This matters when QA teams need to add validation quickly without waiting on heavy scripting support.

See how Testsigma helps your team ship with confidence.

Make Release Confidence a Team Habit

Release confidence scoring does not make releases risk-free. Nothing does.

But it gives QA, DevOps, and engineering teams a better way to see risk before production. Instead of relying on green tests, last-minute meetings, or gut feel, teams can look at the signals that actually affect release safety.

The best scorecard is not the most complex one. It is the one your team can trust, review quickly, and connect to your CI/CD process. Once that happens, release decisions become less reactive.

And a lot harder to bluff.

Want to see how your team can ship with more confidence?

Want to see how your team can ship with more confidence?

Book a demo

FAQ’s

What is a Release Confidence Score?

A release confidence score shows if a release is production-ready. It combines test, defect, environment, regression, and flaky test signals.

How is Release Confidence Scoring Different from Test Coverage?

Test coverage shows what was tested. Release confidence scoring shows if the release is safe to ship.

What Metrics Go Into a Release Confidence Scorecard?

A scorecard usually includes coverage, defects, regression pass rate, and flaky tests. It should also track environmental stability and change risk.

Why do Teams Need Release Confidence Scoring if CI/CD is Already Automated?

CI/CD shows whether the pipeline passed. Release confidence scoring shows whether the release risk still remains.

How Does Release Confidence Scoring Help Reduce Rollbacks?

It finds weak signals before they go into production, so teams can fix bugs or add tests before users are impacted.

Written By

Praveen Vishal

Testsigma Author - Praveen Vishal

Praveen Vishal

An experienced technology marketer with a strong interest in AI, software testing, and innovation, creating meaningful content that connects with and educates the QA community. Falls for good coffee and bad puns.

Published on: 27 Jul 2026

RELATED BLOGS